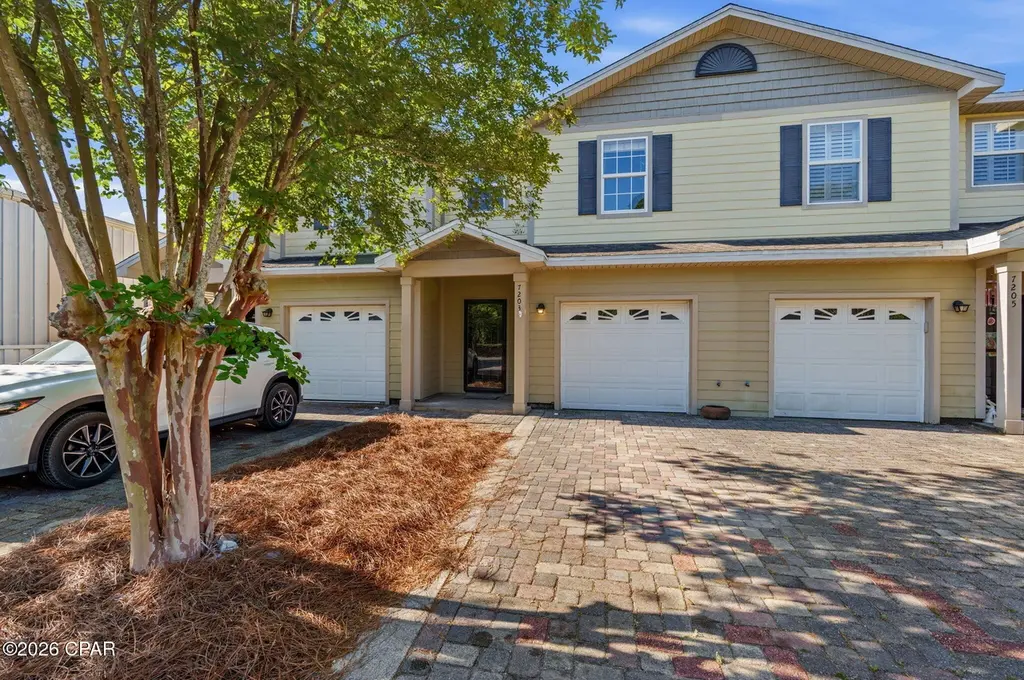
7203 Quail Hollow Dr · Upper Grand Lagoon, FL
Flood risk 1/10 · Minimal
- FEMA flood zone
- X (unshaded)
- Chance of flooding over 30 yrs
- 0.0%
- Est. flood insurance / yr
- $507 – $1,088
Fire risk 5/10 · Moderate
- Est. fire insurance / yr
- $947 – $1,759
Heat risk 10/10 · Severe
- Hot days now (above 106°F)
- 7 days/yr
- Hot days in 30 yrs
- 21 days/yr
Wind risk 9/10 · Severe
- Chance of severe wind over 30 yrs
- 99.0%
Air-quality risk 1/10 · Minimal
- Unhealthy air days now
- 0 days/yr
- Unhealthy air days in 30 yrs
- 0 days/yr
Risk factors via First Street. Map © Google.
Why this score? — see what drove the C- grade
The composite is a weighted blend of 9 inputs, each scored 0–100. Each bar is that input's sub-score; the figure is the points it added to the 100-point composite (weight × sub-score).
- Cash flow +15.8/30.0
- ARV discount +15.0/15.0
- DSCR +4.9/10.0
- Schools +4.3/10.0
- Livability +3.4/5.0
- 1% rule +3.2/10.0
- Rent growth +3.1/5.0
- Condition / age +2.5/5.0
- Appreciation +0.0/10.0
$245,000
🖨 Deal sheet 📄 Offer letter ✓ Due diligence
Listing remarks
Positioned in a highly convenient Panama City Beach location, this well-maintained two-story home offers easy access to the Navy Base, local schools, and a quick drive into Saint Andrews for shopping, dining, and everyday essentials. Inside, the home features an open-concept layout designed for comfortable living and entertaining, with a seamless flow between the family room, dining area, and kitchen. The main level is finished with LVP & tile flooring, while the kitchen is equipped with stainless steel appliances, granite countertops, and quality oak/maple cabinetry. Upstairs, you'll find two spacious primary bedroom suites, offering flexibility and privacy, along with a versatile bo
Key facts
- Oak maple cabinetry
- Granite countertops
- Open-concept layout
Tags
Property features AI
Finance
- HOA & community: Homeowners association; Community clubhouse; Fitness center; Community pool
Exterior
- Parking: Attached garage with 1 parking space
- Utilities: Cable connected; Electricity available; Phone connected; Public sewer
- Home design: HardiPlank-type exterior; Slab foundation
- Construction: HardiPlank-type construction; Slab foundation
- Exterior features: Deck; Patio; Privacy fencing; Storage shed(s); Sprinkler system; In-ground community pool
Interior
- Kitchen: Electric range
- Bedrooms: Two upstairs bedrooms (13 x 12 and 14 x 13)
- Bathrooms: Two full bathrooms and one half bathroom
- Heating & cooling: Central heating (electric); Central air conditioning; Ceiling fans
- Interior features: Interior steps
- Laundry & utility: Electric water heater
Neighborhood map
What this means for you Summary
Snapshot
- This is a 2-bed/3.0-bath townhouse listed at $245k.
Deal economics
- At list price, monthly cash flow is $113 ($1k/yr) — positive.
- The deal already cash-flows at list — no discount required.
- To meet the 1% rule (rent ≥ 1% of price), the offer needs to be $202k (17.7% below list).
- Recommended offer: $202k (17.7% below list) — sets the bar for 1% rule.
- Cap rate 6.8% vs local median 3.2% in Upper Grand Lagoon — top-decile yield for the area; either an underpriced asset or a hidden risk that comps aren't pricing in. Stress-test before assuming the spread holds.
Location & tenants
- Location reads 67/100 on livability (#583 in FL) — a middle-class / working-renter tenant base. Strengths: housing A+, crime A, cost of living B+; Watch: schools D, amenities F, commute F.
- Bay (suburban): math 51% / reading 51% proficiency, ranked #29 of 73 in FL (top 40%) — acceptable for families but not a draw, mixed tenant base, ~2y average lease.
- Market conditions: Rents rising (+2.5%/yr); 1022 active listings in the ZIP; 25 comparable units currently listed for rent nearby; rentals leasing fast (median 14d on market — plan ~1-2 weeks tenant-placement turnaround); solid renter incomes; 2,473 units permitted in Bay County in 2024 (559 in 5+ unit buildings).
Forward outlook
- Local home prices are declining (-3.0%/yr); year-one equity from $2k of loan paydown is wiped out by about $7k of value loss. Plan a longer hold.
- Bay County population projected at +24% by 2050 — long-run rental-demand tailwind backs the buy-and-hold thesis.
Negotiation context
- It's been on market 52 days — a 3% lower offer ($238k) is reasonable based on typical stale-listing flexibility.
- 4 sale attempts since 20y ago with the ask held roughly flat each time — persistent listings suggest the price (not the market) is what's stuck; bring a comps-based counter.
- Current owner paid $127k; list at $245k implies a 93% gain — meaningful room to come down on a strong offer.
Risks & watch-outs
- Climate carrying-cost: severe wind risk, 99% chance of damaging wind over 30y; moderate wildfire risk; extreme-heat days projected 7→21/yr by 2055 (HVAC capex compounding) — expect insurance premiums to compound above CPI over the hold.
Questions for the listing agent
- It's been on market 52 days. Have you received any prior offers? Is the seller open to a 18% concession, seller financing, or rate buy-down credit?
- Is there a deadline driving the sale (1031 exchange, divorce, estate, relocation)? That informs how much negotiation room exists.
- Schools are D-rated, which usually means shorter tenancies and higher turnover. Who's the typical renter profile here, and what's been the actual vacancy rate?
- What's the average days-on-market for RENTAL listings here right now (not sales)? A rising rental-DOM trend means longer vacancies and softer asking-rent achievability than the comps imply.
- What's the recent tenant-quality profile in this submarket — average credit score on applications, eviction rate, late-payment / NSF rate, and stable-employment percentage? A property-management company in the area should have these aggregated.
- How much new for-sale + rental construction is in the pipeline within 1–3 miles? Heavy new supply typically softens prices + rents 12–24 months out; constrained supply supports both.
Investment metrics
- 1% rule
- 0.82% ✗
- Cap rate
- 6.84%
- Cash-on-cash
- 1.97%
- DSCR
- 1.09
- GRM
- 10.1
CMA / ARV
- ARV (median comp)
- $315,864
- List price
- $245,000
- Delta
- -22.43%
- Verdict
- UNDERPRICED
- Comps
- 20 within 1.0 mi
Show comp detail 4 sales within ~0.75 mi
| Address | Dist | Beds/Ba | Sqft | Sold | Price | $/sf | Match |
|---|---|---|---|---|---|---|---|
| 6422 W Highway 98 #1305 | 0.70mi | 2/2.0 | 1,384 (+10%) | 12mo | $380,000 | $275 | 37 |
| 6422 W Highway 98 #1002 | 0.70mi | 2/2.0 | 1,384 (+10%) | 15mo | $410,000 | $296 | 34 |
| 6422 Hwy 98 #603 | 0.70mi | 2/2.0 | 1,384 (+10%) | 20mo | $390,000 | $282 | 31 |
| 6422 W Highway 98 #1503 | 0.70mi | 2/2.0 | 1,384 (+10%) | 22mo | $463,000 | $335 | 29 |
Match score weights: distance 35% · size 25% · config 20% · recency 20%. Top-matched comps best support the ARV.
Projected returns pro-forma
-3.0% appreciation · 2.55% rent growth · sell at horizon
- IRR
- -13.7%
- Equity multiple
- 0.51×
- Total profit
- $-33,536
- Equity at exit
- $36,530
- IRR
- -5.5%
- Equity multiple
- 0.65×
- Total profit
- $-24,068
- Equity at exit
- $21,183
Cash invested: $68,600 (down + closing). Projections, not guarantees.
Landlord ↔ Tenant lean methodology
- Overall (STATE)
- 87 Strongly Landlord-Friendly
- State Florida
- 87 Strongly Landlord-Friendly · R+3
- County
- — inherits STATE
- City
- — inherits STATE
ZIP-level market 32408
- Rents YoY
- 2.5%
- Active inventory
- 1022
- Price-to-rent
- 10.1×
Monthly cashflow live
- Estimated rent
- $2,017 high interval (Pro) →
- Mortgage (P&I)
- −$1,285
- Tax from tax record
- −$94 /mo · $1,125/yr
- Insurance
- −$102
- HOA
- −$0
- Vacancy / Maint / Mgmt
- −$424
- Net cashflow
- $113
Break-even live
UW: 25.0% down · 7.5% · 30yr · 1.5% tax · 5.0% vac · 8.0% maint · 8.0% mgmt
Financing live
Cash to close
- Down payment
- $61,250
- Closing costs
- $7,350
- Reserves months
- —
- Total cash needed
- —
Loan-product check · same deal, 3 products live
Conventional
25% down · 7.5% · 30yr
- Down + closing
- —
- Monthly P&I
- —
- Monthly cashflow
- —
- DSCR
- —
- Eligible?
- —
Personal DTI + credit; lowest rate.
DSCR
20% down · 8.5% · 30yr
- Down + closing
- —
- Monthly P&I
- —
- Monthly cashflow
- —
- DSCR
- —
- Eligible?
- —
No personal income docs; deal must DSCR.
Hard money
10% down · 12.0% · 12mo
- Down + closing
- —
- Monthly P&I
- —
- Monthly cashflow
- —
- DSCR
- —
- Eligible?
- —
Short-term bridge; refi at stabilization.
Rent comps 25 comps
| Address | Beds | Baths | Sqft | Rent | $/sqft | DOM | Units | Dist |
|---|---|---|---|---|---|---|---|---|
| 7110 London St Panama City Beach, FL | 2.0–3.0 | 2.5 | 1419 | $1,900 | $1.34 | 13d | 6 | 0.24mi |
| 2148 Sterling Cove Blvd Unit 1 Panama City Beach, FL | 2.0 | 1.5 | 1152 | $1,695 | $1.47 | 21d | 1 | 0.50mi |
| 2195 Wilkinson St Panama City, FL | 1.0–3.0 | 1.0–2.0 | 1017 | $1,940 | $1.91 | 13d | 41 | 0.59mi |
| 2110 Sterling Cove Blvd Panama City, FL | 2.0 | 2.0 | 1156 | $1,800 | $1.56 | 21d | 1 | 0.61mi |
| 7664 Shadow Lake Dr Unit 1523352P Panama City Beach, FL | 3.0 | 2.0 | 1539 | $3,210 | $2.09 | 13d | 1 | 0.64mi |
| 7682 Shadow Lake Dr Panama City Beach, FL | 3.0 | 2.5 | 1496 | $1,875 | $1.25 | 21d | 1 | 0.66mi |
| 6422 W Highway 98 #1405 Panama City Beach, FL | 2.0 | 2.0 | 1384 | $3,850 | $2.78 | 21d | 1 | 0.72mi |
| 1846 Annabellas Dr Panama City Beach, FL | 2.0 | 2.5 | 1404 | $1,850 | $1.32 | 21d | 1 | 0.95mi |
| 2340 Grand Oaks Ln Unit 1523381P Panama City Beach, FL | 2.0 | 1.0 | 1001 | $4,240 | $4.24 | 13d | 1 | 0.99mi |
| 1744 Annabellas Dr Panama City Beach, FL | 3.0 | 2.5 | 1578 | $2,100 | $1.33 | 13d | 1 | 1.03mi |
| 1734 Annabellas Dr Panama City Beach, FL | 3.0 | 2.5 | 1578 | $2,100 | $1.33 | 21d | 1 | 1.05mi |
| 140 Treasure Palm Dr Panama City, FL | 3.0 | 2.0 | 1564 | $2,350 | $1.50 | 21d | 1 | 1.10mi |
| 2103 Bent Oak Ct Panama City, FL | 3.0 | 2.0 | 1000 | $1,800 | $1.80 | 21d | 1 | 1.13mi |
| 8604 Whelch Dr Panama City, FL | 1.0–3.0 | 1.0–3.0 | 1087 | $2,250 | $2.07 | 13d | 18 | 1.16mi |
| 8551 Panama City Beach Pkwy Panama City Beach, FL | 1.0–3.0 | 1.0–2.0 | 964 | $1,792 | $1.86 | 13d | 12 | 1.16mi |
| 6625 Harbour Blvd Panama City Beach, FL | 2.0 | 2.0 | 1438 | $1,695 | $1.18 | 21d | 1 | 1.21mi |
| 8700 Front Beach Rd Panama City Beach, FL | 2.0–3.0 | 2.5 | 1543 | $2,200 | $1.43 | 13d | 2 | 1.25mi |
| 6588 Harbour Blvd Unit 1 Panama City Beach, FL | 2.0 | 2.5 | 1200 | $1,760 | $1.47 | 21d | 1 | 1.26mi |
| 6728 Sunrise Dr Panama City Beach, FL | 3.0 | 2.0 | 966 | $1,600 | $1.66 | 13d | 1 | 1.28mi |
| 2526 Laurie Ave Panama City, FL | 2.0 | 2.0 | 950 | $1,750 | $1.84 | 13d | 1 | 1.29mi |
| 447 Water Oak Cir Panama City, FL | 2.0 | 2.0 | 980 | $1,800 | $1.84 | 21d | 1 | 1.31mi |
| 1609 Vecuna Cir Panama City Beach, FL | 3.0 | 2.0 | 1268 | $2,100 | $1.66 | 13d | 1 | 1.39mi |
| 2216 Anne Ave Panama City, FL | 2.0 | 2.0 | 951 | $1,300 | $1.37 | 13d | 1 | 1.40mi |
| 2301 Anne Ave Unit 8901 Laird Panama City, FL | 2.0 | 2.0 | 900 | $1,625 | $1.81 | 13d | 1 | 1.43mi |
| 7813 N Lagoon Dr Panama City, FL | 2.0 | 2.0 | 1060 | $1,900 | $1.79 | 21d | 1 | 1.50mi |
Listing history 26 events
-
2026-06-19days on market $245,000 Active 52 DOM
-
2026-06-18days on market $245,000 Active 51 DOM
-
2026-06-17days on market $245,000 Active 50 DOM
-
2026-06-16days on market $245,000 Active 49 DOM
-
2026-06-15days on market $245,000 Active 48 DOM
-
2026-06-14days on market $245,000 Active 46 DOM
-
2026-06-13days on market $245,000 Active 45 DOM
-
2026-06-10days on market $245,000 Active 43 DOM
-
2026-06-09days on market $245,000 Active 42 DOM
-
2026-06-08days on market $245,000 Active 41 DOM
-
2026-06-07days on market $245,000 Active 40 DOM
-
2026-06-05days on market $245,000 Active 37 DOM
-
2026-06-03days on market $245,000 Active 36 DOM
-
2026-06-02days on market $245,000 Active 35 DOM
-
2026-06-01days on market $245,000 Active 34 DOM
-
2026-05-31days on market $245,000 Active 33 DOM
-
2026-05-30days on market $245,000 Active 32 DOM
-
2026-04-28$245,000 Active 1708-char remark
-
2021-12-14historical
-
2021-12-09historical
-
2015-11-04soldstatus $127,000
-
2010-04-07soldstatus $1,819,100
-
2009-12-10$128,900
-
2009-12-04soldstatus $115,000
-
2008-09-03$128,400
-
2006-10-15$174,900
ⓘ Source: listings_history table (triggers on properties + properties_extension) + one-shot
backfill from property_details.listing_events for pre-trigger history.
Tax reassessment forecast FL · Resets to sale price
- Current annual tax
- $1,125 · $94/mo
- Projected year-2 tax
- $2,034 · $169/mo
- Expected delta
- +$909/yr (+$76/mo · 80.8%)
ⓘ Screening estimate from a state-policy table — verify with the county assessor before closing.
Climate risk First Street
- Flood 1/10 Low FEMA zone X (unshaded) · 0% chance over 30 yrs
- Wildfire 5/10 Major
- Heat 10/10 Extreme 7 d/yr ≥106°F today · 21 d/yr by 30 yrs out
- Wind 9/10 Extreme 99% chance of damaging wind over 30 yrs
- Air quality 1/10 Low 0 unhealthy d/yr today · 0 by 30 yrs out
Nearby sold comps map
Loading sold comps map…
Walkable amenities ~0.75 mi
Loading nearby amenities…
Taxation est. · year 1
- Rental income
- $24,201
- − Mortgage interest
- −$13,724
- − Property taxes
- −$1,125
- − Insurance
- −$1,225
- − Repairs & maintenance
- −$1,936
- − Management
- −$1,936
- − Depreciation
- −$7,127
- Taxable loss
- −$2,872
- Est. tax savings @ 24.0%
- +$689
- After-tax cash flow
- $2,041/yr
For passive investors: Depreciation is non-cash, so a rental often shows a tax loss while cash-flowing — sheltering income. Rental losses are passive: they offset passive income freely, and up to $25,000/yr can offset ordinary (W-2) income if you actively participate and your MAGI is under $100k (phasing out to $0 by $150k); unused losses carry forward. On sale, claimed depreciation is recaptured at up to 25%, and gains may owe capital-gains tax (a 1031 exchange can defer both). Figures are a year-1 estimate at your 24.0% rate — not tax advice; consult a CPA.
Schools (NCES district)
- District
- Bay
- NCES district ID
- 1200090
- Math proficiency
- 51% ▼ -8.00%
- Reading proficiency
- 51% ▼ -7.00%
- Median HH income
- $47,740
- Composite
- 43.41/100
- National rank
- #3014
- State rank
- #29 of 73 in FL
Livability — Upper Grand Lagoon
- Score
- 67/100
- State rank
- #583
- US rank
- #11085
Category grades
Schools grade is shown separately in the Schools card above.
Census & demographics
- Census place
- Upper Grand Lagoon, FL
- County
- Bay County · 163,593 people
- City population
- 18,326
- Metro
- Panama City, FL
- Population (ZIP)
- 18,832
- Household income
- $80,822
- Rent vs Own
- Severe rent burden
- 817.0
Population outlook (Bay County) Hauer SSP2
- Today (2025)
- 206,264 people
- By 2030
- 217,740 · +5.6%
- By 2040
- 238,738 · +15.7%
- By 2050
- 255,545 · +23.9%
- By 2075
- 288,295 · +39.8%
- By 2100
- 288,638 · +39.9%
Race, ethnicity, and origin ACS 2023
- Neighborhood character
- Predominantly White (81%)
- Race & ethnicity
- White 81% Hispanic / Latino 7% Two or more races 6% Black 3% Asian 2%
- Hispanic origin (detail)
- Mexican 2% Puerto Rican 2%
- Common ancestry
- Romanian 4% Lithuanian 4% Italian 2%
- Foreign-born
- 11% · Canada, South Korea
- Languages at home
- 88% English-only · Spanish 5% Russian/Polish/Slavic 4% Tagalog/Filipino 1%
Political lean MEDSL · Bay
- 2024 margin
- Solid R (+47.4) · D 25.8% · R 73.1% · Other 1.1%
- 2008→2024 swing
- -6.6pp toward R · 2008: -40.7pp · 2024: -47.4pp
- All cycles
- 2024: R+47.4 2020: R+43.5 2016: R+46.3 2012: R+43.6 2008: R+40.7
Not yet ingested
- Civics
- —
Market trends
- HPI YoY
- ▼ -202.52%
- Current HPI
- 246.9126
- Rent YoY
- ▲ 2.55%
- Metro
- Panama City, FL
- State GDP YoY
- ▲ 3.28%
- F500 in state
- 36
Industry mix (Fortune 500 HQ in FL)
| Industry | F500 HQs | Revenue |
|---|---|---|
| Industrial Technology | 2 | $29B |
|
||
| Insurance | 2 | $17B |
|
||
| Retail | 1 | $60B |
|
||
| Technology Distribution | 1 | $58B |
|
||
| Homebuilding | 1 | $35B |
|
||
| Technology Manufacturing | 1 | $35B |
|
||
Price history
+40.1% since first listed9 events — show timeline
- 2026-04-28 Listed $245,000 CPARMLS
- 2021-12-14 Listing Removed — CPARMLS
- 2021-12-09 Listing Removed — CPARMLS
- 2015-11-04 Sold (Public Records) $127,000 Public Records
- 2010-04-07 Sold (Public Records) $1,819,100 Public Records
- 2009-12-10 Listed $128,900 CPARMLS
- 2009-12-04 Sold (MLS) $115,000 CPARMLS
- 2008-09-03 Listed $128,400 CPARMLS
- 2006-10-15 Listed $174,900 CPARMLS
Property tax history
+2.2%/yrLatest (2025): $1,125 · +3.7% YoY. Source: county tax records.
Cash-flow waterfall
monthlySold comps — $/sqft
last 12 mo · ≤1 miLoading sold comps…