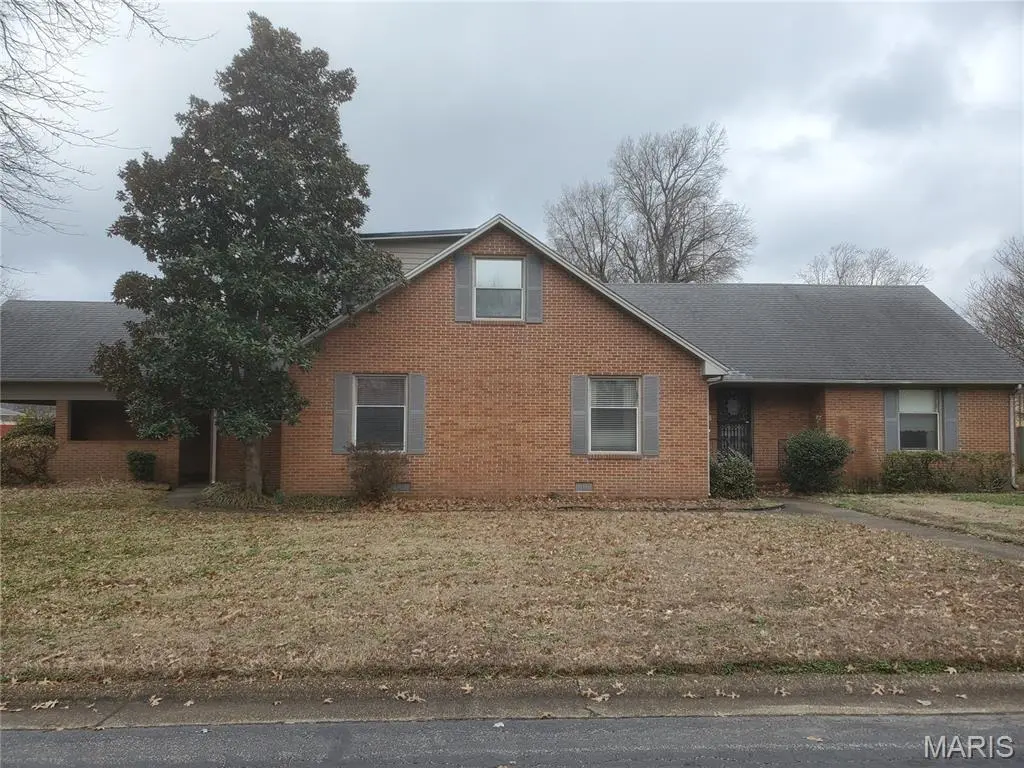
100 N Clayton St · Charleston, MO
Flood risk 1/10 · Minimal
- FEMA flood zone
- X (shaded)
- Chance of flooding over 30 yrs
- 0.0%
- Est. flood insurance / yr
- $507 – $1,088
Fire risk 1/10 · Minimal
- Est. fire insurance / yr
- $1,054 – $1,958
Heat risk 6/10 · Moderate
- Hot days now (above 109°F)
- 7 days/yr
- Hot days in 30 yrs
- 21 days/yr
Wind risk 3/10 · Minor
- Chance of severe wind over 30 yrs
- 7.0%
Air-quality risk 2/10 · Minimal
- Unhealthy air days now
- 1 days/yr
- Unhealthy air days in 30 yrs
- 1 days/yr
Risk factors via First Street. Map © Google.
Why this score? — see what drove the D grade
The composite is a weighted blend of 9 inputs, each scored 0–100. Each bar is that input's sub-score; the figure is the points it added to the 100-point composite (weight × sub-score).
- ARV discount +13.9/15.0
- Appreciation +8.3/10.0
- Cash flow +7.2/30.0
- Livability +2.7/5.0
- Rent growth +2.5/5.0
- Condition / age +2.5/5.0
- DSCR +1.4/10.0
- Schools +1.3/10.0
- 1% rule +1.2/10.0
$179,000
🖨 Deal sheet (PDF) 📄 Offer letter ✓ Due diligence
Listing remarks
Very nice home sitting on a corner lot on the far East side of town. This mostly BRICK home has 4 bedrooms, some with cedar lined closets and 3 1/2 bathrooms. The large Den has a Gas Log Fireplace and the office is set up for you, complete with a desk & filing cabinet. The backyard is fenced in and includes a nice wooden deck and storage shed. This is a GREAT opportunity to own a large solid home for under $70 a square foot. This home has been PRE-Inspected so be sure to ask to see the report.
Key facts
- Cedar lined closets
- Gas log fireplace
- Fenced backyard
Tags
Property features AI
Finance
- Other: Home warranty not included; Lease not considered
Exterior
- Parking: Carport (2 spaces); Driveway
- Utilities: Public water; Public sewer; Electric service by Ameren; Natural gas connected
- Home design: Single-family residence; One and one-half story; Residential property
- Construction: Brick construction; Shingle roof; Utility building on property; Above-grade finished area approximately 2,685
- Exterior features: Deck; Back yard with wood fencing; City lot on a corner
Interior
- Kitchen: Refrigerator; Gas water heater
- Bedrooms: 4 bedrooms total (2 on main level, 2 upper level)
- Bathrooms: 3 full bathrooms; 1 half bathroom (main level)
- Heating & cooling: Forced air heating (natural gas); Central air conditioning
- Interior features: Cedar closets; Double vanity; Gas log fireplace in den
- Laundry & utility: Main level laundry room
Neighborhood map
What this means for you Summary
Snapshot
- This is a 4-bed/3.5-bath other listed at $179k.
Deal economics
- At list price, monthly cash flow is $-248 ($-3k/yr) — negative.
- To cash-flow at today's rent, offer at most $135k (24.5% below list).
- To meet the 1% rule (rent ≥ 1% of price), the offer needs to be $111k (38.2% below list).
- Recommended offer: $111k (38.2% below list) — sets the bar for 1% rule.
Location & tenants
- Location reads 53/100 on livability (#842 in MO) — a working-class tenant base; expect higher turnover. Strengths: cost of living A+, housing A+; Watch: crime F, amenities F, commute F.
- Charleston R-I (town): math 11% / reading 23% proficiency, ranked #310 of 324 in MO (top 96%) — low school quality limits family demand, transient renter base, plan for 1-2y turnover; 78% free/reduced lunch — lower-income household profile, screen leases tightly.
- Zoned schools: Charleston High (math 15% / reading 37%, grade F, #430 of 521 statewide, top 83%, 331 students, 97% FRL) — zoned schools average 97% FRL vs 78% district-wide (19 pts higher); higher-poverty schools than district average — tighter screening recommended.
- Market conditions: 21 active listings in the ZIP; 7 units permitted in Mississippi County in 2024 (0 in 5+ unit buildings).
Forward outlook
- In year one you build about $13k of equity ($1k loan paydown + $12k appreciation (6.7% local appreciation)).
- Mississippi County population projected to shrink 9% by 2050 — rents likely to lag national; underwrite the cash flow, not the appreciation.
- By year 3, paydown + projected appreciation supports a ~$33k cash-out refi (75% LTV) — recoverable capital for the next deal without selling this one.
Negotiation context
- Only 8 days on market — expect competitive offers; lowballing is unlikely to land.
- 2 sale attempts with the ask held roughly flat each time — persistent listings suggest the price (not the market) is what's stuck; bring a comps-based counter.
Risks & watch-outs
- Climate carrying-cost: extreme-heat days projected 7→21/yr by 2055 (HVAC capex compounding) — expect insurance premiums to compound above CPI over the hold.
Questions for the listing agent
- What do current leases actually rent for vs. the listed asking? Can we see a recent rent roll and the last 12 months of T-12 income?
- Built in 1962 — when were the roof, HVAC, electrical panel, plumbing, and water heater last replaced?
- Is there a deadline driving the sale (1031 exchange, divorce, estate, relocation)? That informs how much negotiation room exists.
- Schools are F-rated, which usually means shorter tenancies and higher turnover. Who's the typical renter profile here, and what's been the actual vacancy rate?
- Crime grade is F in this area — have there been break-ins, vandalism, or insurance claims at this property in the last 3 years? What carrier currently insures it and at what premium?
- The area grade is low — what's the realistic commute time and amenity access for the typical tenant pool here? Any planned neighborhood developments (good or bad) we should know about?
- What's the average days-on-market for RENTAL listings here right now (not sales)? A rising rental-DOM trend means longer vacancies and softer asking-rent achievability than the comps imply.
- What's the recent tenant-quality profile in this submarket — average credit score on applications, eviction rate, late-payment / NSF rate, and stable-employment percentage? A property-management company in the area should have these aggregated.
- How much new for-sale + rental construction is in the pipeline within 1–3 miles? Heavy new supply typically softens prices + rents 12–24 months out; constrained supply supports both.
Investment metrics
- 1% rule
- 0.62% ✗
- Cap rate
- 4.63%
- Cash-on-cash
- -5.94%
- DSCR
- 0.74
- GRM
- 13.5
CMA / ARV
- ARV (median comp)
- $208,770
- List price
- $179,000
- Delta
- -13.83%
- Verdict
- UNDERPRICED
- Comps
- 15 within 1.0 mi
Projected returns pro-forma
6.65% appreciation · 3.0% rent growth · sell at horizon
- IRR
- 12.2%
- Equity multiple
- 1.85×
- Total profit
- $42,799
- Equity at exit
- $119,954
- IRR
- 12.8%
- Equity multiple
- 3.73×
- Total profit
- $136,596
- Equity at exit
- $224,248
Cash invested: $50,120 (down + closing). Projections, not guarantees.
Landlord ↔ Tenant lean methodology
- Overall (STATE)
- 81 Strongly Landlord-Friendly
- State Missouri
- 81 Strongly Landlord-Friendly · R+10
- County
- — inherits STATE
- City
- — inherits STATE
ZIP-level market 63834
- Home prices YoY
- 5.3%
- Active inventory
- 21
- Price-to-rent
- 13.5×
Monthly cashflow live
- Estimated rent
- $1,106 medium interval (Pro) →
- Mortgage (P&I)
- −$939
- Tax from tax record
- −$108 /mo · $1,300/yr
- Insurance
- −$75
- HOA
- −$0
- Vacancy / Maint / Mgmt
- −$232
- Net cashflow
- $-248
Break-even live
Sensitivity live
| Price | -10% $-147 | -5% $-198 | +0% $-248 | +5% $-299 | +10% $-350 |
|---|---|---|---|---|---|
| Rent | -10% $-336 | -5% $-292 | +0% $-248 | +5% $-205 | +10% $-161 |
| Rate | -1.0pp $-158 | -0.5pp $-203 | base $-248 | +0.5pp $-295 | +1.0pp $-342 |
UW: 25.0% down · 7.5% · 30yr · 1.5% tax · 5.0% vac · 8.0% maint · 8.0% mgmt
Financing live
Cash to close
- Down payment
- $44,750
- Closing costs
- $5,370
- Reserves months
- —
- Total cash needed
- —
Loan-product check · same deal, 3 products live
Conventional
25% down · 7.5% · 30yr
- Down + closing
- —
- Monthly P&I
- —
- Monthly cashflow
- —
- DSCR
- —
- Eligible?
- —
Personal DTI + credit; lowest rate.
DSCR
20% down · 8.5% · 30yr
- Down + closing
- —
- Monthly P&I
- —
- Monthly cashflow
- —
- DSCR
- —
- Eligible?
- —
No personal income docs; deal must DSCR.
Hard money
10% down · 12.0% · 12mo
- Down + closing
- —
- Monthly P&I
- —
- Monthly cashflow
- —
- DSCR
- —
- Eligible?
- —
Short-term bridge; refi at stabilization.
Listing history 16 events
-
2026-06-21days on market $179,000 Active 8 DOM
-
2026-06-18days on market $179,000 Active 6 DOM
-
2026-06-17days on market $179,000 Active 5 DOM
-
2026-06-16days on market $179,000 Active 4 DOM
-
2026-06-15days on market $179,000 Active 3 DOM
-
2026-06-13pricedays on market $179,000 Active 1 DOM
-
2026-06-08days on market $179,900 Active 109 DOM
-
2026-06-07days on market $179,900 Active 108 DOM
-
2026-06-05days on market $179,900 Active 106 DOM
-
2026-06-04days on market $179,900 Active 104 DOM
-
2026-06-02days on market $179,900 Active 103 DOM
-
2026-06-01days on market $179,900 Active 102 DOM
-
2026-05-31days on market $179,900 Active 101 DOM
-
2026-04-21price $179,900 502-char remark
-
2026-02-19$199,000 Active 502-char remark
-
2026-02-04historical $199,000 502-char remark
ⓘ Source: listings_history table (triggers on properties + properties_extension) + one-shot
backfill from property_details.listing_events for pre-trigger history.
Tax reassessment forecast MO · Resets to sale price
- Current annual tax
- $1,300 · $108/mo
- Projected year-2 tax
- $1,736 · $145/mo
- Expected delta
- +$436/yr (+$36/mo · 33.6%)
ⓘ Screening estimate from a state-policy table — verify with the county assessor before closing.
Climate risk First Street
- Flood 1/10 Low FEMA zone X (shaded) · 0% chance over 30 yrs
- Wildfire 1/10 Low
- Heat 6/10 Major 7 d/yr ≥109°F today · 21 d/yr by 30 yrs out
- Wind 3/10 Moderate 7% chance of damaging wind over 30 yrs
- Air quality 2/10 Low 1 unhealthy d/yr today · 1 by 30 yrs out
Nearby sold comps map
Loading sold comps map…
Walkable amenities ~0.75 mi
Loading nearby amenities…
Taxation est. · year 1
- Rental income
- $13,267
- − Mortgage interest
- −$10,027
- − Property taxes
- −$1,300
- − Insurance
- −$895
- − Repairs & maintenance
- −$1,061
- − Management
- −$1,061
- − Depreciation
- −$5,207
- Taxable loss
- −$6,285
- Est. tax savings @ 24.0%
- +$1,508
- After-tax cash flow
- $-1,470/yr
For passive investors: Depreciation is non-cash, so a rental often shows a tax loss while cash-flowing — sheltering income. Rental losses are passive: they offset passive income freely, and up to $25,000/yr can offset ordinary (W-2) income if you actively participate and your MAGI is under $100k (phasing out to $0 by $150k); unused losses carry forward. On sale, claimed depreciation is recaptured at up to 25%, and gains may owe capital-gains tax (a 1031 exchange can defer both). Figures are a year-1 estimate at your 24.0% rate — not tax advice; consult a CPA.
Schools (NCES district)
- District
- Charleston R-I
- NCES district ID
- 2908670
- Math proficiency
- 11% ▲ 2.00%
- Reading proficiency
- 23% ▼ -1.00%
- Median HH income
- $29,019
- Composite
- 13.37/100
- National rank
- #9531
- State rank
- #310 of 324 in MO
Livability — Charleston
- Score
- 53/100
- State rank
- #842
- US rank
- #24671
Category grades
Schools grade is shown separately in the Schools card above.
Census & demographics
- Census place
- Charleston, MO
- Population (ZIP)
- 5,218
Population outlook (Mississippi County) Hauer SSP2
- Today (2025)
- 13,403 people
- By 2030
- 13,101 · -2.3%
- By 2040
- 12,626 · -5.8%
- By 2050
- 12,233 · -8.7%
- By 2075
- 10,704 · -20.1%
- By 2100
- 8,345 · -37.7%
Race, ethnicity, and origin ACS 2023
- Neighborhood character
- Diverse neighborhood (Simpson 0.56)
- Race & ethnicity
- Black 49% White 45% Two or more races 6%
- Common ancestry
- Iranian 1% Slovak 1% Portuguese 1%
- Foreign-born
- 0% · Canada
- Languages at home
- 98% English-only · Spanish 1%
Political lean MEDSL · Mississippi
- 2024 margin
- Solid R (+53.7) · D 22.8% · R 76.5%
- 2008→2024 swing
- -39.0pp toward R · 2008: -14.7pp · 2024: -53.7pp
- All cycles
- 2024: R+53.7 2020: R+49.6 2016: R+41.5 2012: R+23.2 2008: R+14.7
Not yet ingested
- Civics
- —
Market trends
- HPI YoY
- ▲ 6.65%
- Current HPI
- 131.78
- Rent YoY
- —
- Metro
- —
- State GDP YoY
- ▲ 1.84%
- F500 in state
- 20
Industry mix (Fortune 500 HQ in MO)
| Industry | F500 HQs | Revenue |
|---|---|---|
| Healthcare | 1 | $163B |
|
||
| Insurance | 1 | $21B |
|
||
| Industrial Technology | 1 | $17B |
|
||
| Retail | 1 | $16B |
|
||
| Industrial Distribution | 1 | $10B |
|
||
| Utilities | 1 | $9B |
|
||
Price history
-10.1% since first listed4 events — show timeline
- 2026-06-12 Listed $179,000 MARIS as Distributed by MLS Grid
- 2026-04-21 Price Changed $179,900 MARIS as Distributed by MLS Grid
- 2026-02-19 Listed $199,000 MARIS as Distributed by MLS Grid
- 2026-02-04 Coming Soon — MARIS as Distributed by MLS Grid
Property tax history
+0.5%/yrLatest (2025): $1,300 · +3.7% YoY. Source: county tax records.
Cash-flow waterfall
monthlySold comps — $/sqft
last 12 mo · ≤1 miLoading sold comps…