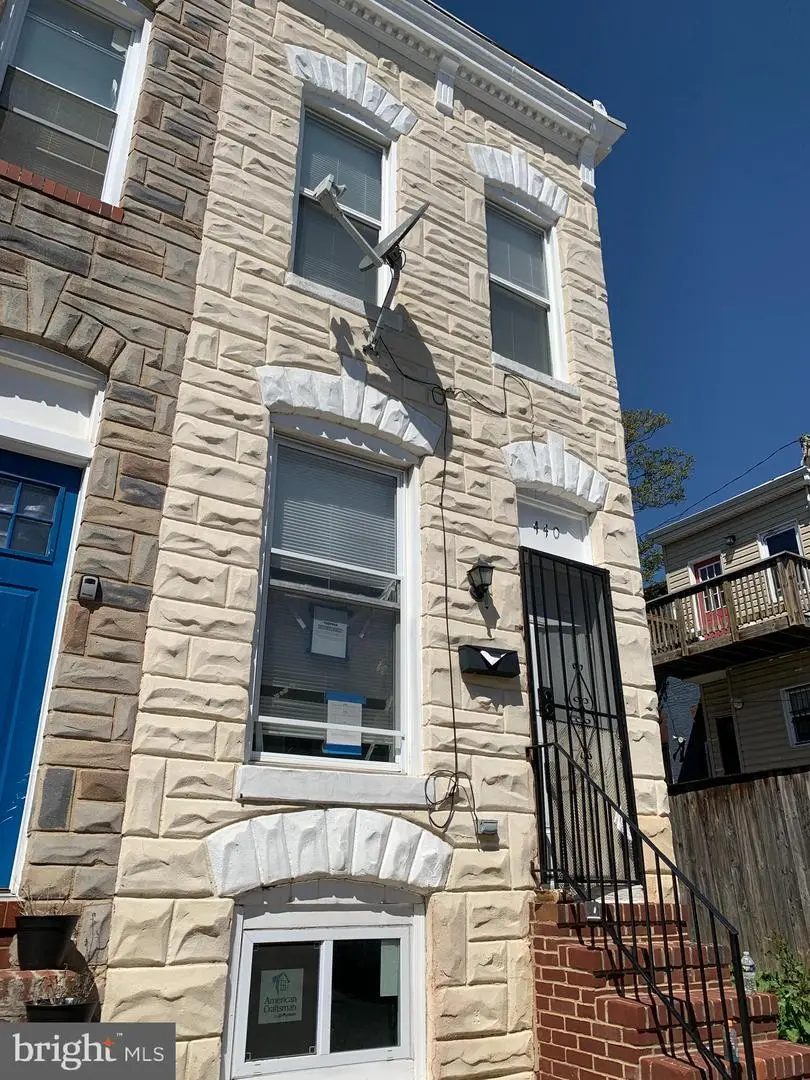
440 N Rose St N · Baltimore, MD
Flood risk 1/10 · Minimal
- FEMA flood zone
- X (unshaded)
- Chance of flooding over 30 yrs
- 0.0%
- Est. flood insurance / yr
- $473 – $860
Fire risk 1/10 · Minimal
- Est. fire insurance / yr
- $755 – $1,403
Heat risk 8/10 · Major
- Hot days now (above 103°F)
- 7 days/yr
- Hot days in 30 yrs
- 15 days/yr
Wind risk 6/10 · Moderate
- Chance of severe wind over 30 yrs
- 27.0%
Air-quality risk 4/10 · Minor
- Unhealthy air days now
- 6 days/yr
- Unhealthy air days in 30 yrs
- 7 days/yr
Risk factors via First Street. Map © Google.
Why this score? — see what drove the B+ grade
The composite is a weighted blend of 9 inputs, each scored 0–100. Each bar is that input's sub-score; the figure is the points it added to the 100-point composite (weight × sub-score).
- Cash flow +30.0/30.0
- ARV discount +15.0/15.0
- 1% rule +10.0/10.0
- DSCR +10.0/10.0
- Livability +3.8/5.0
- Rent growth +2.8/5.0
- Condition / age +2.5/5.0
- Schools +1.0/10.0
- Appreciation +0.0/10.0
$99,900
🖨 Deal sheet 📄 Offer letter ✓ Due diligence
Listing remarks
NOT AN AUCTION, NOT A SHORT SALE, NOT A BANK OWNED, NOT A FORECLOSURE, NOT WHOLESALING---QUICK AND EASY. Minimum $2,000 EMD. Excellent Opportunity in a developing area of Baltimore! . .. use your imagination! The McElderry Park area is an East Baltimore neighborhood is a community of residents developed in the late 1800s. The area includes Northeast Market, East Monument Main Street District, and Johns Hopkins Broadway medical campuses as amenities. The neighborhood has an active community association, affordable housing, public art, community-managed green spaces, and two public schools. Property sold "as is". Home Inspections for informational purposes only. Seller will make n
Key facts
- Northeast market
- Two public schools
- Public art
Tags
Property features AI
Finance
- Other: Total below-grade area 456 (assessor); Above-grade finished area 960 (assessor); Below-grade unfinished area 456 (assessor); Year built source: assessor; Pets allowed with no restrictions
- Financial info: Ownership is ground rent (amount $78 paid semi-annually); Annual ground rent listed under income/expense
Exterior
- Parking: On-street parking
- Utilities: Public water; Public sewer
- Home design: End of Row/Townhouse structure; Property condition described as average; In city limits (Baltimore City)
- Construction: Brick construction; Brick/mortar foundation; Above-grade and below-grade structures
- Exterior features: End-of-row townhouse; Ground rent exists (semi-annual payment)
Interior
- Bedrooms: Two bedrooms on the first upper level
- Bathrooms: One full bathroom
- Heating & cooling: Other heating system; Natural gas heating; Natural gas hot water
- Interior features: Full basement with connecting stairway; Living area per assessor
Neighborhood map
What this means for you Summary
Snapshot
- This is a 2-bed/1.0-bath townhouse listed at $100k.
Deal economics
- At list price, monthly cash flow is $550 ($7k/yr) — positive.
- The deal already cash-flows at list — no discount required.
- Meets the 1% rule at list price ($2k rent vs $100k).
- Cap rate 12.9% vs local median 6.0% in Baltimore — top-decile yield for the area; either an underpriced asset or a hidden risk that comps aren't pricing in. Stress-test before assuming the spread holds.
Location & tenants
- Location reads 76/100 on livability (#90 in MD, #3,396 nationally) — a middle-class / working-renter tenant base. Strengths: amenities A+, commute A+, housing A+; Watch: schools D, crime F.
- Baltimore City Public Schools (urban): math 7% / reading 16% proficiency, ranked #24 of 24 in MD (top 100%) — low school quality limits family demand, transient renter base, plan for 1-2y turnover; 79% free/reduced lunch — lower-income household profile, screen leases tightly.
- Market conditions: Rents rising (+1.3%/yr); 391 active listings in the ZIP; 40 comparable units currently listed for rent nearby; rentals at typical pace (median 24d on market — plan ~3-4 weeks tenant-placement turnaround); solid renter incomes; 1,273 units permitted in Baltimore city in 2024 (1,104 in 5+ unit buildings).
Forward outlook
- Local home prices are declining (-3.0%/yr); year-one equity from $691 of loan paydown is wiped out by about $3k of value loss. Plan a longer hold.
- Baltimore County population projected to shrink 4% by 2050 — rents likely to lag national; underwrite the cash flow, not the appreciation.
- At projected returns (-3.0% appreciation + 1.3% rent growth), your $28k cash investment doubles in ~6 years — after that, you're playing with house money.
Negotiation context
- Only 1 days on market — expect competitive offers; lowballing is unlikely to land.
- 8 sale attempts since 27y ago with the ask held roughly flat each time — persistent listings suggest the price (not the market) is what's stuck; bring a comps-based counter.
Risks & watch-outs
- Watch-outs: property tax is 3.1% of price; built in 1900 — expect roof / HVAC / electrical / plumbing capex.
- Climate carrying-cost: major wind risk, 27% chance of damaging wind over 30y; extreme-heat days projected 7→15/yr by 2055 (HVAC capex compounding) — expect insurance premiums to compound above CPI over the hold.
Questions for the listing agent
- Built in 1900 — when were the roof, HVAC, electrical panel, plumbing, and water heater last replaced?
- Property tax is high relative to price — has the assessment been appealed recently, and will the sale trigger a re-assessment?
- Is there a deadline driving the sale (1031 exchange, divorce, estate, relocation)? That informs how much negotiation room exists.
- Schools are D-rated, which usually means shorter tenancies and higher turnover. Who's the typical renter profile here, and what's been the actual vacancy rate?
- Crime grade is F in this area — have there been break-ins, vandalism, or insurance claims at this property in the last 3 years? What carrier currently insures it and at what premium?
- What's the average days-on-market for RENTAL listings here right now (not sales)? A rising rental-DOM trend means longer vacancies and softer asking-rent achievability than the comps imply.
- What's the recent tenant-quality profile in this submarket — average credit score on applications, eviction rate, late-payment / NSF rate, and stable-employment percentage? A property-management company in the area should have these aggregated.
- How much new for-sale + rental construction is in the pipeline within 1–3 miles? Heavy new supply typically softens prices + rents 12–24 months out; constrained supply supports both.
Investment metrics
- 1% rule
- 1.74% ✓
- Cap rate
- 12.90%
- Cash-on-cash
- 23.61%
- DSCR
- 2.05
- GRM
- 4.8
CMA / ARV
- ARV (on-the-fly)
- $170,880
- Comps found
- 12
Show comp detail 12 sales within ~0.75 mi
| Address | Dist | Beds/Ba | Sqft | Sold | Price | $/sf | Match |
|---|---|---|---|---|---|---|---|
| 530 N Curley St | 0.31mi | 3/1.0 (+1) | 960 (0%) | 2mo | $85,000 | $89 | 79 |
| 735 N Lakewood Ave | 0.26mi | 3/1.5 (+1) | 970 (+1%) | 2mo | $80,000 | $82 | 78 |
| 155 N Streeper St | 0.29mi | 2/2.0 | 912 (-5%) | 0mo | $220,000 | $241 | 74 |
| 410 N Washington St | 0.43mi | 2/2.5 | 950 (-1%) | 2mo | $226,900 | $239 | 71 |
| 441 N East Ave | 0.52mi | 3/1.5 (+1) | 976 (+2%) | 2mo | $175,000 | $179 | 65 |
| 629 N Kenwood Ave | 0.25mi | 2/1.5 | 1,100 (+15%) | 1mo | $76,500 | $70 | 61 |
| 322 S Duncan St | 0.69mi | 2/1.5 | 924 (-4%) | 0mo | $280,000 | $303 | 60 |
| 2202 Prentiss Pl | 0.53mi | 2/2.0 | 900 (-6%) | 2mo | $160,000 | $178 | 59 |
| 20 N Decker Ave | 0.46mi | 3/1.0 (+1) | 1,040 (+8%) | 2mo | $149,000 | $143 | 58 |
| 14 S Curley St | 0.46mi | 2/1.0 | 1,092 (+14%) | 1mo | $269,000 | $246 | 55 |
| 2709 E Hoffman St | 0.72mi | 2/1.0 | 840 (-12%) | 1mo | $115,000 | $137 | 45 |
| 3500 E Fairmount Ave | 0.72mi | 2/1.0 | 1,092 (+14%) | 2mo | $107,000 | $98 | 42 |
Match score weights: distance 35% · size 25% · config 20% · recency 20%. Top-matched comps best support the ARV.
Projected returns pro-forma
-3.0% appreciation · 1.31% rent growth · sell at horizon
- IRR
- 14.7%
- Equity multiple
- 1.57×
- Total profit
- $16,058
- Equity at exit
- $14,895
- IRR
- 22.0%
- Equity multiple
- 2.72×
- Total profit
- $48,014
- Equity at exit
- $8,638
Cash invested: $27,972 (down + closing). Projections, not guarantees.
Landlord ↔ Tenant lean methodology
- Overall (CITY)
- 12 Strongly Tenant-Friendly
- State Maryland
- 27 Tenant-Leaning · D+14
- County
- — inherits STATE
- City Baltimore
- 12 Strongly Tenant-Friendly · D+58
ZIP-level market 21224
- Rents YoY
- 1.3%
- Active inventory
- 391
- Price-to-rent
- 4.8×
Monthly cashflow live
- Estimated rent
- $1,739 high interval (Pro) →
- Mortgage (P&I)
- −$524
- Tax from tax record
- −$258 /mo · $3,098/yr
- Insurance
- −$42
- HOA
- −$0
- Vacancy / Maint / Mgmt
- −$365
- Net cashflow
- $550
Break-even live
UW: 25.0% down · 7.5% · 30yr · 1.5% tax · 5.0% vac · 8.0% maint · 8.0% mgmt
Financing live
Cash to close
- Down payment
- $24,975
- Closing costs
- $2,997
- Reserves months
- —
- Total cash needed
- —
Loan-product check · same deal, 3 products live
Conventional
25% down · 7.5% · 30yr
- Down + closing
- —
- Monthly P&I
- —
- Monthly cashflow
- —
- DSCR
- —
- Eligible?
- —
Personal DTI + credit; lowest rate.
DSCR
20% down · 8.5% · 30yr
- Down + closing
- —
- Monthly P&I
- —
- Monthly cashflow
- —
- DSCR
- —
- Eligible?
- —
No personal income docs; deal must DSCR.
Hard money
10% down · 12.0% · 12mo
- Down + closing
- —
- Monthly P&I
- —
- Monthly cashflow
- —
- DSCR
- —
- Eligible?
- —
Short-term bridge; refi at stabilization.
Rent comps 40 comps
| Address | Beds | Baths | Sqft | Rent | $/sqft | DOM | Units | Dist |
|---|---|---|---|---|---|---|---|---|
| 402 N Milton Ave Unit 402B Baltimore, MD | 2.0 | 1.0 | 950 | $1,290 | $1.36 | 43d | 1 | 0.02mi |
| 400 N Rose St #1 Baltimore, MD | 1.0 | 1.0 | 588 | $1,080 | $1.84 | 43d | 1 | 0.03mi |
| 233 N Rose St Baltimore, MD | 2.0 | 2.5 | 934 | $1,750 | $1.87 | 17d | 1 | 0.06mi |
| 224 N Rose St Baltimore, MD | 2.0 | 2.5 | 1120 | $1,875 | $1.67 | 17d | 1 | 0.06mi |
| 437 N Montford Ave Baltimore, MD | 3.0 | 1.5 | 1100 | $1,450 | $1.32 | 43d | 1 | 0.08mi |
| 517 N Rose St Baltimore, MD | 3.0 | 1.0 | 845 | $1,400 | $1.66 | 4d | 1 | 0.10mi |
| 415 N Glover St Baltimore, MD | 2.0 | 2.5 | 1092 | $1,600 | $1.47 | 23d | 1 | 0.12mi |
| 502 N Glover St Baltimore, MD | 2.0 | 1.5 | 827 | $1,250 | $1.51 | 20d | 1 | 0.13mi |
| 2608 E Fayette St Unit 1 Baltimore, MD | 2.0 | 1.0 | 900 | $1,700 | $1.89 | 14d | 1 | 0.14mi |
| 2308 Jefferson St Baltimore, MD | 3.0 | 1.0 | 907 | $1,450 | $1.60 | 43d | 1 | 0.14mi |
| 107 N Port St Baltimore, MD | 2.0 | 2.0 | 870 | $1,995 | $2.29 | 23d | 1 | 0.17mi |
| 104 N Rose St Baltimore, MD | 3.0 | 2.0 | 936 | $2,500 | $2.67 | 43d | 1 | 0.17mi |
| 127 N Glover St Baltimore, MD | 2.0 | 1.5 | 1110 | $2,100 | $1.89 | 2d | 1 | 0.19mi |
| 618 N Montford Ave Baltimore, MD | 3.0 | 1.0 | 1050 | $1,468 | $1.40 | 14d | 1 | 0.19mi |
| 618 N Montford Ave Baltimore, MD | 3.0 | 1.0 | 1050 | $1,468 | $1.40 | 43d | 1 | 0.19mi |
| 415 N Belnord Ave Baltimore, MD | 2.0 | 1.0 | 1008 | $1,300 | $1.29 | 23d | 1 | 0.19mi |
| 531 N Belnord Ave Baltimore, MD | 2.0 | 1.5 | 1100 | $1,700 | $1.55 | 23d | 1 | 0.22mi |
| 720 N Port St Baltimore, MD | 2.0 | 1.0 | 950 | $1,300 | $1.37 | 43d | 1 | 0.25mi |
| 16 N Bradford St Baltimore, MD | 2.0 | 3.5 | 930 | $2,400 | $2.58 | 4d | 1 | 0.26mi |
| 108 N Madeira St Baltimore, MD | 2.0 | 2.0 | 1098 | $1,900 | $1.73 | 43d | 1 | 0.27mi |
| 712 N Duncan St Baltimore, MD | 2.0 | 1.5 | 1000 | $2,000 | $2.00 | 43d | 1 | 0.36mi |
| 2729 Ashland Ave Baltimore, MD | 3.0 | 1.0 | 1000 | $1,350 | $1.35 | 2d | 1 | 0.39mi |
| 520 N Decker Ave Baltimore, MD | 2.0 | 1.0 | 1000 | $1,650 | $1.65 | 43d | 1 | 0.41mi |
| 107 S Collington Ave Unit 2 REAR Baltimore, MD | 1.0 | 1.0 | 600 | $1,800 | $3.00 | 4d | 1 | 0.45mi |
| 203 N Ellwood Ave Unit Main Baltimore, MD | 2.0 | 2.0 | 880 | $2,200 | $2.50 | 23d | 1 | 0.47mi |
| 29 N Ellwood Ave Baltimore, MD | 3.0 | 1.5 | 1100 | $2,395 | $2.18 | 23d | 1 | 0.51mi |
| 211 S Madeira St Baltimore, MD | 2.0 | 1.0 | 819 | $1,650 | $2.01 | 4d | 1 | 0.51mi |
| 1923 Ashland Ave Baltimore, MD | 2.0 | 2.0 | 862 | $1,770 | $2.05 | 19d | 2 | 0.53mi |
| 1923 Ashland Ave Unit 401 Baltimore, MD | 2.0 | 2.0 | 850 | $1,795 | $2.11 | 20d | 1 | 0.53mi |
| 227 S Madeira St Baltimore, MD | 2.0 | 2.5 | 1100 | $2,200 | $2.00 | 43d | 1 | 0.53mi |
| 3205 Esther Pl Baltimore, MD | 2.0 | 2.0 | 960 | $1,850 | $1.93 | 23d | 1 | 0.55mi |
| 2019 E Pratt St Unit 2 Baltimore, MD | 1.0 | 1.0 | 810 | $1,400 | $1.73 | 43d | 1 | 0.57mi |
| 16 S Wolfe St Unit B Baltimore, MD | 2.0 | 2.0 | 1014 | $1,800 | $1.78 | 17d | 1 | 0.58mi |
| 1901 E Lombard St Apt 3 Baltimore, MD | 1.0 | 1.0 | 650 | $1,750 | $2.69 | 14d | 1 | 0.59mi |
| 1901 E Lombard St Baltimore, MD | 1.0 | 1.0 | 702 | $1,750 | $2.49 | 43d | 1 | 0.59mi |
| 1901 E Lombard St Baltimore, MD | 1.0 | 1.0 | 660 | $1,800 | $2.73 | 21d | 1 | 0.59mi |
| 1901 E Lombard St Apt 2 Baltimore, MD | 1.0 | 1.0 | 650 | $1,650 | $2.54 | 2d | 1 | 0.59mi |
| 1901 E Lombard St Apt 3 Baltimore, MD | 1.0 | 1.0 | 650 | $1,750 | $2.69 | 4d | 1 | 0.59mi |
| 1901 E Lombard St Baltimore, MD | 1.0 | 1.0 | 650 | $1,750 | $2.69 | 23d | 1 | 0.59mi |
| 1901 E Lombard St Apt 4 Baltimore, MD | 1.0 | 1.0 | 650 | $1,750 | $2.69 | 21d | 1 | 0.59mi |
Listing history 22 events
-
2026-05-22status Pending
-
2026-05-21$99,900 Active
-
2020-03-05soldstatus $1,050,150
-
2016-12-28soldstatus $30,000
-
2014-04-29historical Expired
-
2014-04-29historical
-
2013-10-31Active
-
2013-10-31$49,900
-
2010-10-07historical Expired
-
2010-10-07historical
-
2010-04-06Active
-
2010-04-06$119,900
-
2001-11-26soldstatus $3,000
-
2001-09-04historical
-
2001-07-28$6,000
-
2001-07-28historical
-
2001-06-30
-
2000-12-05historical
-
1999-07-08
-
1998-07-01soldstatus $155,000
-
1998-02-12soldstatus $8,400
-
1990-05-08soldstatus $12,000
ⓘ Source: listings_history table (triggers on properties + properties_extension) + one-shot
backfill from property_details.listing_events for pre-trigger history.
Tax reassessment forecast MD · Partial reset (capped growth)
- Current annual tax
- $3,098 · $258/mo
- Projected year-2 tax
- $3,098 · $258/mo
- Expected delta
- $0/yr ($0/mo · 0.0%)
ⓘ Screening estimate from a state-policy table — verify with the county assessor before closing.
Climate risk First Street
- Flood 1/10 Low FEMA zone X (unshaded) · 0% chance over 30 yrs
- Wildfire 1/10 Low
- Heat 8/10 Severe 7 d/yr ≥103°F today · 15 d/yr by 30 yrs out
- Wind 6/10 Major 27% chance of damaging wind over 30 yrs
- Air quality 4/10 Moderate 6 unhealthy d/yr today · 7 by 30 yrs out
Nearby sold comps map
Loading sold comps map…
Walkable amenities ~0.75 mi
Loading nearby amenities…
Taxation est. · year 1
- Rental income
- $20,870
- − Mortgage interest
- −$5,596
- − Property taxes
- −$3,098
- − Insurance
- −$500
- − Repairs & maintenance
- −$1,670
- − Management
- −$1,670
- − Depreciation
- −$2,906
- Taxable income
- $5,431
- Est. tax owed @ 24.0%
- −$1,303
- After-tax cash flow
- $5,300/yr
For passive investors: Depreciation is non-cash, so a rental often shows a tax loss while cash-flowing — sheltering income. Rental losses are passive: they offset passive income freely, and up to $25,000/yr can offset ordinary (W-2) income if you actively participate and your MAGI is under $100k (phasing out to $0 by $150k); unused losses carry forward. On sale, claimed depreciation is recaptured at up to 25%, and gains may owe capital-gains tax (a 1031 exchange can defer both). Figures are a year-1 estimate at your 24.0% rate — not tax advice; consult a CPA.
Schools (NCES district)
- District
- Baltimore City Public Schools
- NCES district ID
- 2400090
- Math proficiency
- 7% ▼ -9.00%
- Reading proficiency
- 16% ▼ -5.00%
- Median HH income
- $42,108
- Composite
- 10.08/100
- National rank
- #9805
- State rank
- #24 of 24 in MD
Livability — Baltimore
- Score
- 76/100
- State rank
- #90
- US rank
- #3396
Category grades
Schools grade is shown separately in the Schools card above.
Census & demographics
- Census place
- Baltimore, MD
- County
- Baltimore City · 558,601 people
- City population
- 588,727
- Metro
- Baltimore-Columbia-Towson, MD
- Population (ZIP)
- 47,465
- Household income
- $89,017
- Rent vs Own
- Severe rent burden
- 1786.0
Population outlook (Baltimore County) Hauer SSP2
- Today (2025)
- 624,249 people
- By 2030
- 621,541 · -0.4%
- By 2040
- 609,756 · -2.3%
- By 2050
- 597,249 · -4.3%
- By 2075
- 552,236 · -11.5%
- By 2100
- 513,934 · -17.7%
Race, ethnicity, and origin ACS 2023
- Neighborhood character
- Diverse neighborhood (Simpson 0.62)
- Race & ethnicity
- White 55% Hispanic / Latino 21% Black 16% Two or more races 7% Asian 4%
- Hispanic origin (detail)
- Mexican 4% Puerto Rican 2% Dominican 1%
- Common ancestry
- Romanian 5% Lithuanian 2% Italian 1%
- Foreign-born
- 17% · Canada, China, Vietnam
- Languages at home
- 76% English-only · Spanish 18% Other Indo-European 2% Russian/Polish/Slavic 1%
Political lean MEDSL · Baltimore
- 2024 margin
- Solid D (+73.0) · D 85.2% · R 12.2% · Other 2.6%
- 2008→2024 swing
- -2.5pp toward R · 2008: 75.5pp · 2024: 73.0pp
- All cycles
- 2024: D+73.0 2020: D+76.6 2016: D+74.6 2012: D+76.4 2008: D+75.5
Not yet ingested
- Civics
- —
Market trends
- HPI YoY
- ▼ -332.23%
- Current HPI
- 241.284
- Rent YoY
- ▲ 1.31%
- Metro
- Baltimore-Columbia-Towson, MD
- State GDP YoY
- ▲ 2.97%
- F500 in state
- 12
Industry mix (Fortune 500 HQ in MD)
| Industry | F500 HQs | Revenue |
|---|---|---|
| Aerospace / Defense | 1 | $71B |
|
||
| Utilities | 1 | $25B |
|
||
| Hotels | 1 | $24B |
|
||
| Consumer Goods | 1 | $7B |
|
||
| Real Estate | 1 | $6B |
|
||
| Chemicals | 1 | $2B |
|
||
Price history
+732.5% since first listed22 events — show timeline
- 2026-05-22 Pending — BRIGHT MLS
- 2026-05-21 Listed $99,900 BRIGHT MLS
- 2020-03-05 Sold (Public Records) $1,050,150 Public Records
- 2016-12-28 Sold (Public Records) $30,000 Public Records
- 2014-04-29 Delisted — MRIS
- 2014-04-29 Listing Removed — BRIGHT MLS
- 2013-10-31 Listed — MRIS
- 2013-10-31 Listed $49,900 BRIGHT MLS
- 2010-10-07 Delisted — MRIS
- 2010-10-07 Listing Removed — BRIGHT MLS
- 2010-04-06 Listed — MRIS
- 2010-04-06 Listed $119,900 BRIGHT MLS
- 2001-11-26 Sold (MLS) $3,000 MRIS
- 2001-09-04 Delisted — MRIS
- 2001-07-28 Delisted — MRIS
- 2001-07-28 Listed $6,000 MRIS
- 2001-06-30 Listed — MRIS
- 2000-12-05 Delisted — MRIS
- 1999-07-08 Listed — MRIS
- 1998-07-01 Sold (Public Records) $155,000 Public Records
- 1998-02-12 Sold (Public Records) $8,400 Public Records
- 1990-05-08 Sold (Public Records) $12,000 Public Records
Property tax history
+4.7%/yrLatest (2025): $3,098 · +10.7% YoY. Source: county tax records.
Cash-flow waterfall
monthlySold comps — $/sqft
last 12 mo · ≤1 miLoading sold comps…