4158 66th Street Cir W #4158 · Bradenton, FL
Flood risk 1/10 · Minimal
- FEMA flood zone
- X (unshaded)
- Chance of flooding over 30 yrs
- 0.0%
- Est. flood insurance / yr
- $507 – $1,088
Fire risk 3/10 · Minor
- Est. fire insurance / yr
- $947 – $1,759
Heat risk 10/10 · Severe
- Hot days now (above 106°F)
- 7 days/yr
- Hot days in 30 yrs
- 28 days/yr
Wind risk 10/10 · Severe
- Chance of severe wind over 30 yrs
- 99.0%
Air-quality risk 3/10 · Minor
- Unhealthy air days now
- 2 days/yr
- Unhealthy air days in 30 yrs
- 2 days/yr
Risk factors via First Street. Map © Google.
Why this score? — see what drove the C- grade
The composite is a weighted blend of 9 inputs, each scored 0–100. Each bar is that input's sub-score; the figure is the points it added to the 100-point composite (weight × sub-score).
- Cash flow +17.0/30.0
- 1% rule +8.9/10.0
- ARV discount +7.5/15.0
- DSCR +5.3/10.0
- Schools +4.4/10.0
- Livability +4.0/5.0
- Condition / age +2.5/5.0
- Rent growth +2.4/5.0
- Appreciation +0.0/10.0
$155,000
🖨 Deal sheet (PDF) 📄 Offer letter ✓ Due diligence
Listing remarks
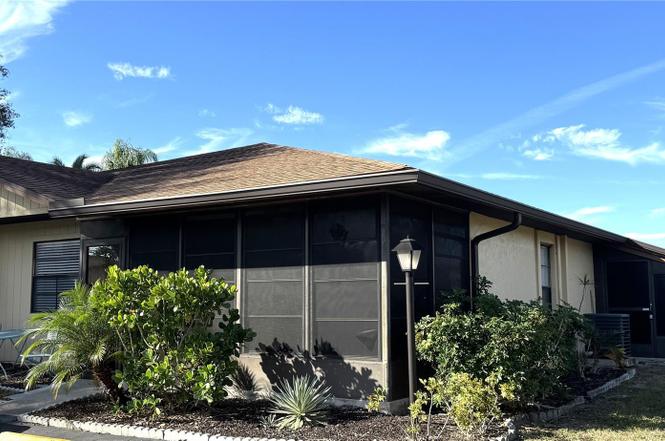
Under contract-accepting backup offers. Welcome to one of Bradenton’s Best Kept Secrets! Heritage Village West, a 55+ community that is a hop skip and a jump to dining and just a minute drive to shopping. This ground level 2-bedroom 2 full bath condo has had a few updates including skip trowelled living room and kitchen ceilings as well as an attractive front entry door, 6 panel interior doors, kitchen appliances including an LG French door fridge, smooth top range, dishwasher and microwave hood. The spacious indoor laundry room has overflow cabinets with a small countertop in addition to a full size washer and dryer and extra space for storage. These are ground level villas with no o
Key facts
- Ground level condo
- Front entry door
- Smooth top range
Tags
Neighborhood map
What this means for you Summary
Snapshot
- This is a 2-bed/2.0-bath condo listed at $155k.
Deal economics
- At list price, monthly cash flow is $105 ($1k/yr) — positive.
- The deal already cash-flows at list — no discount required.
- Meets the 1% rule at list price ($2k rent vs $155k).
- Recommended offer: $141k (9.0% below list) — sets the bar for market timing.
- Cap rate 7.1% vs local median 3.6% in Bradenton — top-decile yield for the area; either an underpriced asset or a hidden risk that comps aren't pricing in. Stress-test before assuming the spread holds.
Location & tenants
- Location reads 81/100 on livability (#101 in FL, #1,528 nationally) — a professional / high-income tenant draw. Strengths: commute A+, cost of living A+, housing A+; Watch: employment D+, crime D, amenities F.
- Manatee (suburban): math 54% / reading 50% proficiency, ranked #26 of 73 in FL (top 36%) — acceptable for families but not a draw, mixed tenant base, ~2y average lease.
- Market conditions: Rents soft (-0.3%/yr); 510 active listings in the ZIP; 40 comparable units currently listed for rent nearby; rentals at typical pace (median 18d on market — plan ~3-4 weeks tenant-placement turnaround); solid renter incomes; 7,472 units permitted in Manatee County in 2024 (1,782 in 5+ unit buildings).
- This rent runs 32% of the median local income ($82k/yr) — at the standard rent-burdened threshold; future hikes will face affordability resistance.
Forward outlook
- Local home prices are declining (-3.0%/yr); year-one equity from $1k of loan paydown is wiped out by about $5k of value loss. Plan a longer hold.
- Manatee County population projected at +43% by 2050 — long-run rental-demand tailwind backs the buy-and-hold thesis.
Negotiation context
- It's been on market 119 days — a 9% lower offer ($141k) is reasonable based on typical stale-listing flexibility.
- 3 sale attempts since 16y ago with the ask held roughly flat each time — persistent listings suggest the price (not the market) is what's stuck; bring a comps-based counter.
Risks & watch-outs
- Watch-outs: HOA is 25% of rent.
- Climate carrying-cost: severe wind risk, 99% chance of damaging wind over 30y; extreme-heat days projected 7→28/yr by 2055 (HVAC capex compounding) — expect insurance premiums to compound above CPI over the hold.
Questions for the listing agent
- It's been on market 119 days. Have you received any prior offers? Is the seller open to a 9% concession, seller financing, or rate buy-down credit?
- What does the HOA fee cover, when was the last increase, and are there any pending special assessments or reserve-fund shortfalls?
- Any open or pending special assessments — roof, HVAC, plumbing, elevator, façade? What's the per-unit balance and payoff schedule, and is the seller paying it off at close or rolling it to the buyer?
- Why hasn't it sold? Are there any deal-killer items the seller is aware of (foundation, flood, title, zoning, code violations)?
- Is there a deadline driving the sale (1031 exchange, divorce, estate, relocation)? That informs how much negotiation room exists.
- Crime grade is D in this area — have there been break-ins, vandalism, or insurance claims at this property in the last 3 years? What carrier currently insures it and at what premium?
- What's the average days-on-market for RENTAL listings here right now (not sales)? A rising rental-DOM trend means longer vacancies and softer asking-rent achievability than the comps imply.
- What's the recent tenant-quality profile in this submarket — average credit score on applications, eviction rate, late-payment / NSF rate, and stable-employment percentage? A property-management company in the area should have these aggregated.
- How much new apartment / multifamily construction is in the pipeline within 1–3 miles? Heavy new supply (>2% of stock underway) typically softens rents 12–24 months out; light construction supports rent growth.
Investment metrics
- 1% rule
- 1.39% ✓
- Cap rate
- 7.10%
- Cash-on-cash
- 2.90%
- DSCR
- 1.13
- GRM
- 6.0
CMA / ARV
No comps found within radius.
Projected returns pro-forma
-3.0% appreciation · 0.0% rent growth · sell at horizon
- IRR
- -16.5%
- Equity multiple
- 0.44×
- Total profit
- $-24,408
- Equity at exit
- $23,111
- IRR
- -19.3%
- Equity multiple
- 0.18×
- Total profit
- $-35,656
- Equity at exit
- $13,402
Cash invested: $43,400 (down + closing). Projections, not guarantees.
Landlord ↔ Tenant lean methodology
- Overall (STATE)
- 87 Strongly Landlord-Friendly
- State Florida
- 87 Strongly Landlord-Friendly · R+3
- County
- — inherits STATE
- City
- — inherits STATE
ZIP-level market 34209
- Rents YoY
- -0.3%
- Active inventory
- 510
- Price-to-rent
- 6.0×
Monthly cashflow live
- Estimated rent
- $2,160 high interval (Pro) →
- Mortgage (P&I)
- −$813
- Tax est. 1.5%
- −$194 /mo · $2,325/yr
- Insurance
- −$65
- HOA
- −$530
- Vacancy / Maint / Mgmt
- −$454
- Net cashflow
- $105
Break-even live
Sensitivity live
| Price | -10% $212 | -5% $158 | +0% $105 | +5% $51 | +10% $-2 |
|---|---|---|---|---|---|
| Rent | -10% $-66 | -5% $20 | +0% $105 | +5% $190 | +10% $275 |
| Rate | -1.0pp $183 | -0.5pp $144 | base $105 | +0.5pp $65 | +1.0pp $24 |
UW: 25.0% down · 7.5% · 30yr · 1.5% tax · 5.0% vac · 8.0% maint · 8.0% mgmt
Financing live
Cash to close
- Down payment
- $38,750
- Closing costs
- $4,650
- Reserves months
- —
- Total cash needed
- —
Loan-product check · same deal, 3 products live
Conventional
25% down · 7.5% · 30yr
- Down + closing
- —
- Monthly P&I
- —
- Monthly cashflow
- —
- DSCR
- —
- Eligible?
- —
Personal DTI + credit; lowest rate.
DSCR
20% down · 8.5% · 30yr
- Down + closing
- —
- Monthly P&I
- —
- Monthly cashflow
- —
- DSCR
- —
- Eligible?
- —
No personal income docs; deal must DSCR.
Hard money
10% down · 12.0% · 12mo
- Down + closing
- —
- Monthly P&I
- —
- Monthly cashflow
- —
- DSCR
- —
- Eligible?
- —
Short-term bridge; refi at stabilization.
Rent comps 40 comps
| Address | Beds | Baths | Sqft | Rent | $/sqft | DOM | Units | Dist |
|---|---|---|---|---|---|---|---|---|
| 4209 66th Street Cir W Bradenton, FL | 2.0 | 2.0 | 1044 | $2,900 | $2.78 | 25d | 1 | 0.01mi |
| 4161 66th Street Cir W Bradenton, FL | 2.0 | 2.0 | 1044 | $1,800 | $1.72 | 17d | 1 | 0.01mi |
| 4112 66th Street Cir W Bradenton, FL | 2.0 | 2.0 | 1100 | $1,960 | $1.78 | 21d | 1 | 0.12mi |
| 6711 45th Ave W Unit A Bradenton, FL | 2.0 | 2.0 | 1100 | $1,700 | $1.55 | 17d | 1 | 0.23mi |
| 4116 62nd St W Bradenton, FL | 2.0 | 2.0 | 840 | $1,650 | $1.96 | 4d | 1 | 0.23mi |
| 4601 66th St W Bradenton, FL | 3.0 | 1.0–2.0 | 917 | $2,065 | $2.25 | 3d | 24 | 0.26mi |
| 4501 71st St W Bradenton, FL | 1.0–2.0 | 1.0–2.0 | 850 | $1,680 | $1.98 | 3d | 28 | 0.36mi |
| 4572 Red Maple Rd #901 Bradenton, FL | 2.0 | 2.0 | 1224 | $1,600 | $1.31 | 25d | 1 | 0.36mi |
| 4063 Overture Cir Bradenton, FL | 3.0 | 2.0 | 1277 | $2,400 | $1.88 | 25d | 1 | 0.41mi |
| 4118 59th St W Bradenton, FL | 2.0 | 1.0 | 756 | $1,800 | $2.38 | 17d | 1 | 0.41mi |
| 4037 Overture Cir Unit 4037 Bradenton, FL | 3.0 | 2.0 | 1381 | $2,195 | $1.59 | 25d | 1 | 0.44mi |
| 4005 Overture Cir Unit 4005 Bradenton, FL | 3.0 | 2.0 | 1381 | $2,700 | $1.96 | 25d | 1 | 0.46mi |
| 7202 Hamilton Rd Unit 7202 Bradenton, FL | 3.0 | 2.0 | 1277 | $2,250 | $1.76 | 17d | 1 | 0.47mi |
| 5907 36th Ave Cir W #5907 Bradenton, FL | 2.0 | 2.0 | 937 | $2,800 | $2.99 | 25d | 1 | 0.49mi |
| 4196 Overture Cir Unit 4196 Bradenton, FL | 3.0 | 2.0 | 1277 | $2,300 | $1.80 | 4d | 1 | 0.50mi |
| 7333 Skybird Rd Bradenton, FL | 3.0 | 2.0 | 1277 | $3,500 | $2.74 | 25d | 1 | 0.55mi |
| 6709 35th Ave W Unit 1346494P Bradenton, FL | 3.0 | 2.0 | 1227 | $4,527 | $3.69 | 17d | 1 | 0.58mi |
| 4122 Overture Cir #533 Bradenton, FL | 3.0 | 2.0 | 1381 | $2,900 | $2.10 | 25d | 1 | 0.58mi |
| 4880 51st St W Bradenton, FL | 1.0–4.0 | 1.0–3.0 | 1019 | $1,527 | $1.50 | 4d | 11 | 0.63mi |
| 4850 51st St W Bradenton, FL | 1.0–2.0 | 1.0–2.0 | 800 | $1,750 | $2.19 | 16d | 3 | 0.64mi |
| 4850 51st St W Bradenton, FL | 1.0–2.0 | 1.0–2.0 | 800 | $1,750 | $2.19 | 4d | 2 | 0.64mi |
| 4112 Cape Vista Dr Bradenton, FL | 3.0 | 2.0 | 1450 | $3,495 | $2.41 | 25d | 1 | 0.67mi |
| 2914 64th St W Bradenton, FL | 2.0 | 2.0 | 1135 | $2,025 | $1.78 | 25d | 1 | 0.76mi |
| 4802 51st St W Bradenton, FL | 1.0–2.0 | 1.0–2.0 | 1007 | $1,950 | $1.94 | 17d | 15 | 0.76mi |
| 4802 51st St W Bradenton, FL | 1.0–2.0 | 1.0–2.0 | 1007 | $1,950 | $1.94 | 4d | 13 | 0.76mi |
| 4005 78th St W Bradenton, FL | 3.0 | 2.0 | 1000 | $1,895 | $1.90 | 4d | 1 | 0.77mi |
| 2926 63rd St W Bradenton, FL | 2.0 | 2.0 | 946 | $2,100 | $2.22 | 4d | 1 | 0.78mi |
| 5909 30th Ave W Bradenton, FL | 1.0–2.0 | 1.0–2.0 | 788 | $1,670 | $2.12 | 3d | 6 | 0.80mi |
| 4325 80th St W Bradenton, FL | 3.0 | 1.5 | 1000 | $2,200 | $2.20 | 25d | 1 | 0.87mi |
| 4210 Ironwood Cir Unit 103J Bradenton, FL | 1.0 | 1.0 | 750 | $1,800 | $2.40 | 25d | 1 | 0.93mi |
| 4110 Ironwood Cir #104 Bradenton, FL | 2.0 | 2.0 | 1152 | $1,800 | $1.56 | 25d | 1 | 0.94mi |
| 5933 28th Ave W Bradenton, FL | 1.0–2.0 | 1.0–2.0 | 945 | $2,013 | $2.13 | 3d | 6 | 0.99mi |
| 4040 Ironwood Cir Unit 404F Bradenton, FL | 2.0 | 2.0 | 1008 | $1,750 | $1.74 | 13d | 1 | 1.01mi |
| 4040 Ironwood Cir Unit 406F Bradenton, FL | 2.0 | 2.0 | 1008 | $1,675 | $1.66 | 17d | 1 | 1.01mi |
| 2724 72nd St W Unit 2010 Bradenton, FL | 2.0 | 2.0 | 942 | $1,950 | $2.07 | 4d | 1 | 1.02mi |
| 4460 Ironwood Cir Unit 406 Bradenton, FL | 1.0 | 1.0 | 750 | $1,600 | $2.13 | 22d | 1 | 1.02mi |
| 4460 Ironwood Cir Unit 406 Bradenton, FL | 1.0 | 1.0 | 750 | $1,600 | $2.13 | 3d | 1 | 1.02mi |
| 4460 Ironwood Cir Unit 501A Bradenton, FL | 1.0 | 1.5 | 840 | $2,595 | $3.09 | 25d | 1 | 1.02mi |
| 4550 47th St W Bradenton, FL | 1.0–3.0 | 1.0–2.0 | 930 | $1,800 | $1.94 | 3d | 27 | 1.05mi |
| 4240 Ironwood Cir #404 Bradenton, FL | 2.0 | 2.0 | 1008 | $2,495 | $2.48 | 25d | 1 | 1.08mi |
HOA detail condo
- Monthly dues
- $530 · $6,360/yr
- Assessments
- None detected in remarks — confirm with the listing agent.
Listing history 5 events
-
2026-04-01status Pending
-
2025-12-03$155,000 Active
-
2010-11-01$87,000
-
2010-10-07historical
-
2010-03-23$120,000
ⓘ Source: listings_history table (triggers on properties + properties_extension) + one-shot
backfill from property_details.listing_events for pre-trigger history.
Climate risk First Street
- Flood 1/10 Low FEMA zone X (unshaded) · 0% chance over 30 yrs
- Wildfire 3/10 Moderate
- Heat 10/10 Extreme 7 d/yr ≥106°F today · 28 d/yr by 30 yrs out
- Wind 10/10 Extreme 99% chance of damaging wind over 30 yrs
- Air quality 3/10 Moderate 2 unhealthy d/yr today · 2 by 30 yrs out
Nearby sold comps map
Loading sold comps map…
Walkable amenities ~0.75 mi
Loading nearby amenities…
Taxation est. · year 1
- Rental income
- $25,915
- − Mortgage interest
- −$8,682
- − Property taxes
- −$2,325
- − Insurance
- −$775
- − Repairs & maintenance
- −$2,073
- − Management
- −$2,073
- − HOA
- −$6,360
- − Depreciation
- −$4,509
- Taxable loss
- −$883
- Est. tax savings @ 24.0%
- +$212
- After-tax cash flow
- $1,470/yr
For passive investors: Depreciation is non-cash, so a rental often shows a tax loss while cash-flowing — sheltering income. Rental losses are passive: they offset passive income freely, and up to $25,000/yr can offset ordinary (W-2) income if you actively participate and your MAGI is under $100k (phasing out to $0 by $150k); unused losses carry forward. On sale, claimed depreciation is recaptured at up to 25%, and gains may owe capital-gains tax (a 1031 exchange can defer both). Figures are a year-1 estimate at your 24.0% rate — not tax advice; consult a CPA.
Schools (NCES district)
- District
- Manatee
- NCES district ID
- 1201230
- Math proficiency
- 54% ▼ -6.00%
- Reading proficiency
- 50% ▼ -2.00%
- Median HH income
- $49,607
- Composite
- 44.43/100
- National rank
- #2806
- State rank
- #26 of 73 in FL
Livability — Bradenton
- Score
- 81/100
- State rank
- #101
- US rank
- #1528
Category grades
Schools grade is shown separately in the Schools card above.
Census & demographics
- Census place
- Bradenton, FL
- County
- Manatee County · 416,364 people
- City population
- 227,091
- Metro
- North Port-Sarasota-Bradenton, FL
- Population (ZIP)
- 33,224
- Household income
- $81,728
- Rent vs Own
- Severe rent burden
- 1126.0
Population outlook (Manatee County) Hauer SSP2
- Today (2025)
- 447,342 people
- By 2030
- 488,911 · +9.3%
- By 2040
- 567,934 · +27.0%
- By 2050
- 637,995 · +42.6%
- By 2075
- 781,970 · +74.8%
- By 2100
- 848,272 · +89.6%
Race, ethnicity, and origin ACS 2023
- Neighborhood character
- Predominantly White (84%)
- Race & ethnicity
- White 84% Hispanic / Latino 11% Two or more races 6% Black 2% Asian 1%
- Hispanic origin (detail)
- Puerto Rican 4% Cuban 3%
- Common ancestry
- Romanian 3% Slovak 3% Lithuanian 3%
- Foreign-born
- 9% · Canada, Jamaica, China
- Languages at home
- 90% English-only · Spanish 6% Russian/Polish/Slavic 1% Other Indo-European 1%
Political lean MEDSL · Manatee
- 2024 margin
- Strong R (+23.5) · D 37.9% · R 61.4%
- 2008→2024 swing
- -16.5pp toward R · 2008: -7.0pp · 2024: -23.5pp
- All cycles
- 2024: R+23.5 2020: R+16.1 2016: R+17.1 2012: R+12.5 2008: R+7.0
Not yet ingested
- Civics
- —
Market trends
- HPI YoY
- ▼ -360.34%
- Current HPI
- 320.0061
- Rent YoY
- ▼ -0.30%
- Metro
- North Port-Sarasota-Bradenton, FL
- State GDP YoY
- ▲ 3.28%
- F500 in state
- 36
Industry mix (Fortune 500 HQ in FL)
| Industry | F500 HQs | Revenue |
|---|---|---|
| Industrial Technology | 2 | $29B |
|
||
| Insurance | 2 | $17B |
|
||
| Retail | 1 | $60B |
|
||
| Technology Distribution | 1 | $58B |
|
||
| Homebuilding | 1 | $35B |
|
||
| Technology Manufacturing | 1 | $35B |
|
||
Price history
+29.2% since first listed5 events — show timeline
- 2026-04-01 Pending — Stellar MLS as Distributed by MLS Grid
- 2025-12-03 Listed $155,000 Stellar MLS as Distributed by MLS Grid
- 2010-11-01 Listed $87,000 Stellar MLS as Distributed by MLS Grid
- 2010-10-07 Listing Removed — Stellar MLS as Distributed by MLS Grid
- 2010-03-23 Listed $120,000 Stellar MLS as Distributed by MLS Grid
Cash-flow waterfall
monthlySold comps — $/sqft
last 12 mo · ≤1 miLoading sold comps…