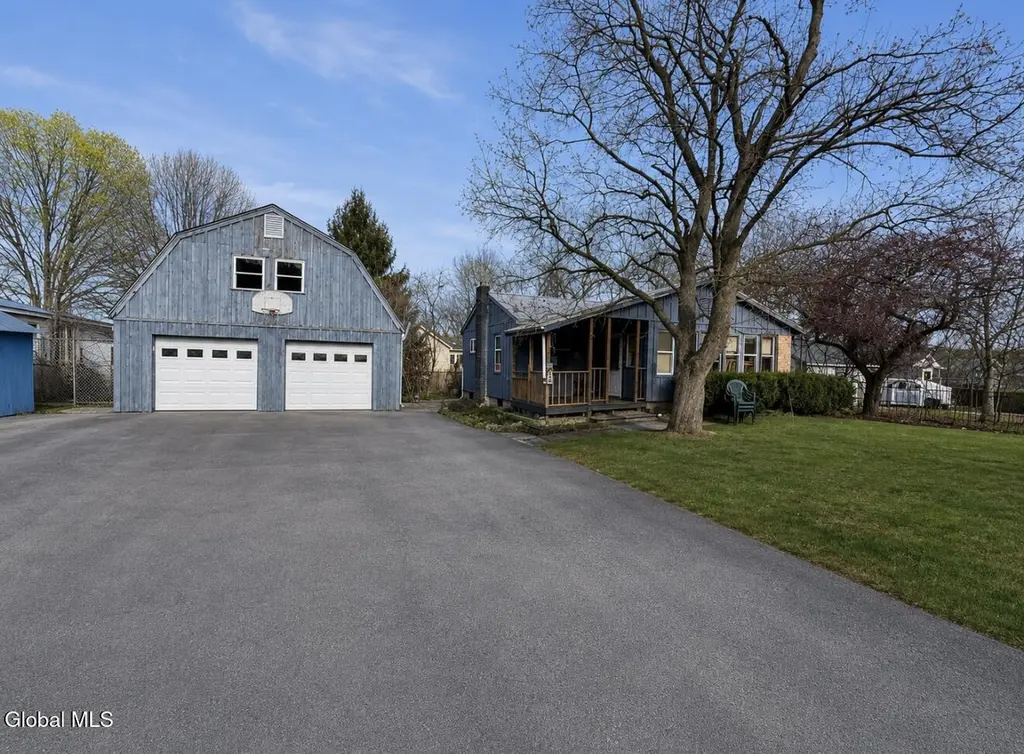
42 Indiana Ave · West Glens Falls, NY
Flood risk 4/10 · Minor
- FEMA flood zone
- X
- Chance of flooding over 30 yrs
- 0.2%
- Est. flood insurance / yr
- $473 – $860
Fire risk 3/10 · Minor
- Est. fire insurance / yr
- $691 – $1,283
Heat risk 3/10 · Minor
- Hot days now (above 96°F)
- 7 days/yr
- Hot days in 30 yrs
- 16 days/yr
Wind risk 2/10 · Minimal
- Chance of severe wind over 30 yrs
- 3.0%
Air-quality risk 1/10 · Minimal
- Unhealthy air days now
- 0 days/yr
- Unhealthy air days in 30 yrs
- 0 days/yr
Risk factors via First Street. Map © Google.
Why this score? — see what drove the C grade
The composite is a weighted blend of 9 inputs, each scored 0–100. Each bar is that input's sub-score; the figure is the points it added to the 100-point composite (weight × sub-score).
- Cash flow +18.1/30.0
- ARV discount +15.0/15.0
- 1% rule +6.0/10.0
- DSCR +5.7/10.0
- Schools +5.2/10.0
- Livability +3.6/5.0
- Rent growth +2.5/5.0
- Condition / age +2.5/5.0
- Appreciation +0.0/10.0
$99,999
🖨 Deal sheet 📄 Offer letter ✓ Due diligence
Listing remarks
Charming 2-bedroom home with rustic character and solid potential, located in a peaceful Queensbury setting. All utilities are currently functioning, making this property an excellent opportunity for an owner-occupant, weekend retreat, or investment project. The home features a unique barn-style design, spacious outdoor areas, and a private setting with plenty of room to make it your own. With just a light cleanup and some cosmetic renovations, this property could be move-in ready in a short time. Ideal for buyers looking to add value while preserving the home's distinctive charm. Conveniently located near Lake George, shopping, restaurants, and major routes while still offering a quiet cou
Key facts
- Barn-style design
- Private setting
- Quiet country feel
Tags
Property features AI
Exterior
- Parking: Detached garage; 2 garage spaces; Total parking for 6 vehicles; Driveway parking
- Utilities: Public water; Public sewer
- Home design: Single family residence; Facing direction not specified; Living area reported as 758
- Construction: Wood siding construction
- Exterior features: Paved driveway
Interior
- Kitchen: Electric oven; Refrigerator
- Bedrooms: Bedroom on the first level
- Bathrooms: 1 full bathroom on the first level
- Heating & cooling: Oil heating; Cooling system (other)
- Interior features: 5 total rooms; Basement (other)
Neighborhood map
What this means for you Summary
Snapshot
- This is a 1-bed/1.0-bath single-family listed at $100k.
Deal economics
- At list price, monthly cash flow is $88 ($1k/yr) — positive.
- The deal already cash-flows at list — no discount required.
- Meets the 1% rule at list price ($1k rent vs $100k).
- Recommended offer: $97k (3.0% below list) — sets the bar for market timing.
- Cap rate 7.3% vs local median 2.4% in West Glens Falls — top-decile yield for the area; either an underpriced asset or a hidden risk that comps aren't pricing in. Stress-test before assuming the spread holds.
Location & tenants
- Location reads 71/100 on livability (#388 in NY) — a middle-class / working-renter tenant base. Strengths: employment A+, housing A+, health & safety A+; Watch: crime C-, cost of living C-, amenities F.
- Queensbury Union Free School District (suburban): math 57% / reading 62% proficiency, ranked #230 of 590 in NY (top 39%) — acceptable for families but not a draw, mixed tenant base, ~2y average lease.
- Zoned schools: Queensbury Elementary School (math 67% / reading 62%, grade B, #591 of 2,108 statewide, top 31%, 880 students, 41% FRL); Queensbury Senior High School (math 79% / reading 98%, grade A, #299 of 1,100 statewide, top 27%, 980 students, 31% FRL).
- Zoned-school proficiency averages 76% at this address vs 60% district-wide (+17 pts) — the actual schools serving this property are materially stronger than the Queensbury Union Free School District average implies; a family-tenant draw the district grade alone would hide.
- Market conditions: 160 active listings in the ZIP; 1 comparable units currently listed for rent nearby; 180 units permitted in Warren County in 2024 (40 in 5+ unit buildings).
Forward outlook
- Local home prices are declining (-3.0%/yr); year-one equity from $691 of loan paydown is wiped out by about $3k of value loss. Plan a longer hold.
- Warren County population projected at -19% by 2050 — secular population decline; favor cash flow + early exit over multi-decade hold.
Negotiation context
- It's been on market 35 days — a 3% lower offer ($97k) is reasonable based on typical stale-listing flexibility.
- 3 sale attempts since 23y ago; this cycle's ask has dropped $20k (17%) from the opening price — seller is motivated, your offer sets the floor, not the list.
- Current owner paid $60k; list at $100k implies a 66% gain — meaningful room to come down on a strong offer.
Risks & watch-outs
- Watch-outs: property tax is 2.6% of price; built in 1940 — expect roof / HVAC / electrical / plumbing capex.
Questions for the listing agent
- It's been on market 35 days. Have you received any prior offers? Is the seller open to a 3% concession, seller financing, or rate buy-down credit?
- Built in 1940 — when were the roof, HVAC, electrical panel, plumbing, and water heater last replaced?
- Property tax is high relative to price — has the assessment been appealed recently, and will the sale trigger a re-assessment?
- Is there a deadline driving the sale (1031 exchange, divorce, estate, relocation)? That informs how much negotiation room exists.
- Schools are F-rated, which usually means shorter tenancies and higher turnover. Who's the typical renter profile here, and what's been the actual vacancy rate?
- What's the average days-on-market for RENTAL listings here right now (not sales)? A rising rental-DOM trend means longer vacancies and softer asking-rent achievability than the comps imply.
- What's the recent tenant-quality profile in this submarket — average credit score on applications, eviction rate, late-payment / NSF rate, and stable-employment percentage? A property-management company in the area should have these aggregated.
- How much new for-sale + rental construction is in the pipeline within 1–3 miles? Heavy new supply typically softens prices + rents 12–24 months out; constrained supply supports both.
Investment metrics
- 1% rule
- 1.10% ✓
- Cap rate
- 7.35%
- Cash-on-cash
- 3.77%
- DSCR
- 1.17
- GRM
- 7.6
CMA / ARV
- ARV (median comp)
- $186,632
- List price
- $99,999
- Delta
- -46.42%
- Verdict
- UNDERPRICED
- Comps
- 10 within 1.0 mi
Show comp detail 1 sale within ~0.75 mi
| Address | Dist | Beds/Ba | Sqft | Sold | Price | $/sf | Match |
|---|---|---|---|---|---|---|---|
| 27 Maine Ave | 0.34mi | 2/1.0 (+1) | 840 (+11%) | 20mo | $162,000 | $193 | 44 |
Match score weights: distance 35% · size 25% · config 20% · recency 20%. Top-matched comps best support the ARV.
Projected returns pro-forma
-3.0% appreciation · 3.0% rent growth · sell at horizon
- IRR
- -10.3%
- Equity multiple
- 0.62×
- Total profit
- $-10,526
- Equity at exit
- $14,910
- IRR
- -0.9%
- Equity multiple
- 0.94×
- Total profit
- $-1,656
- Equity at exit
- $8,646
Cash invested: $28,000 (down + closing). Projections, not guarantees.
Landlord ↔ Tenant lean methodology
- Overall (STATE)
- 15 Strongly Tenant-Friendly
- State New York
- 15 Strongly Tenant-Friendly · D+10
- County
- — inherits STATE
- City
- — inherits STATE
ZIP-level market 12804
- Home prices YoY
- -9.0%
- Active inventory
- 160
- Price-to-rent
- 7.6×
Monthly cashflow live
- Estimated rent
- $1,100 medium interval (Pro) →
- Mortgage (P&I)
- −$524
- Tax from tax record
- −$215 /mo · $2,579/yr
- Insurance
- −$42
- HOA
- −$0
- Vacancy / Maint / Mgmt
- −$231
- Net cashflow
- $88
Break-even live
UW: 25.0% down · 7.5% · 30yr · 1.5% tax · 5.0% vac · 8.0% maint · 8.0% mgmt
Financing live
Cash to close
- Down payment
- $25,000
- Closing costs
- $3,000
- Reserves months
- —
- Total cash needed
- —
Loan-product check · same deal, 3 products live
Conventional
25% down · 7.5% · 30yr
- Down + closing
- —
- Monthly P&I
- —
- Monthly cashflow
- —
- DSCR
- —
- Eligible?
- —
Personal DTI + credit; lowest rate.
DSCR
20% down · 8.5% · 30yr
- Down + closing
- —
- Monthly P&I
- —
- Monthly cashflow
- —
- DSCR
- —
- Eligible?
- —
No personal income docs; deal must DSCR.
Hard money
10% down · 12.0% · 12mo
- Down + closing
- —
- Monthly P&I
- —
- Monthly cashflow
- —
- DSCR
- —
- Eligible?
- —
Short-term bridge; refi at stabilization.
Rent comps 1 comps
| Address | Beds | Baths | Sqft | Rent | $/sqft | DOM | Units | Dist |
|---|---|---|---|---|---|---|---|---|
| 15 Staple St Glens Falls, NY | 1.0 | 1.0 | 897 | $1,100 | $1.23 | 23d | 1 | 1.46mi |
Listing history 23 events
-
2026-06-19days on market $99,999 Active 35 DOM
-
2026-06-18days on market $99,999 Active 34 DOM
-
2026-06-17days on market $99,999 Active 33 DOM
-
2026-06-17price $99,999 Active 32 DOM
-
2026-06-16days on market $109,999 Active 32 DOM
-
2026-06-15days on market $109,999 Active 31 DOM
-
2026-06-14days on market $109,999 Active 29 DOM
-
2026-06-12pricedays on market $109,999 Active 28 DOM
-
2026-06-09days on market $119,999 Active 25 DOM
-
2026-06-08days on market $119,999 Active 24 DOM
-
2026-06-07days on market $119,999 Active 23 DOM
-
2026-06-07days on market $119,999 Active 22 DOM
-
2026-06-04days on market $119,999 Active 19 DOM
-
2026-06-02days on market $119,999 Active 18 DOM
-
2026-06-01days on market $119,999 Active 17 DOM
-
2026-05-31days on market $119,999 Active 16 DOM
-
2026-05-31days on market $119,999 Active 15 DOM
-
2026-05-15$119,999 Active 712-char remark
-
2019-02-28historical
-
2004-12-30historical
-
2004-11-24soldstatus $60,420
-
2004-04-04$59,900
-
2003-10-15$118,000
ⓘ Source: listings_history table (triggers on properties + properties_extension) + one-shot
backfill from property_details.listing_events for pre-trigger history.
Tax reassessment forecast NY · Partial reset (capped growth)
- Current annual tax
- $2,579 · $215/mo
- Projected year-2 tax
- $2,579 · $215/mo
- Expected delta
- $0/yr ($0/mo · 0.0%)
ⓘ Screening estimate from a state-policy table — verify with the county assessor before closing.
Climate risk First Street
- Flood 4/10 Moderate FEMA zone X · 20% chance over 30 yrs
- Wildfire 3/10 Moderate
- Heat 3/10 Moderate 7 d/yr ≥96°F today · 16 d/yr by 30 yrs out
- Wind 2/10 Low 3% chance of damaging wind over 30 yrs
- Air quality 1/10 Low 0 unhealthy d/yr today · 0 by 30 yrs out
Nearby sold comps map
Loading sold comps map…
Walkable amenities ~0.75 mi
Loading nearby amenities…
Taxation est. · year 1
- Rental income
- $13,200
- − Mortgage interest
- −$5,601
- − Property taxes
- −$2,579
- − Insurance
- −$500
- − Repairs & maintenance
- −$1,056
- − Management
- −$1,056
- − Depreciation
- −$2,909
- Taxable loss
- −$501
- Est. tax savings @ 24.0%
- +$120
- After-tax cash flow
- $1,177/yr
For passive investors: Depreciation is non-cash, so a rental often shows a tax loss while cash-flowing — sheltering income. Rental losses are passive: they offset passive income freely, and up to $25,000/yr can offset ordinary (W-2) income if you actively participate and your MAGI is under $100k (phasing out to $0 by $150k); unused losses carry forward. On sale, claimed depreciation is recaptured at up to 25%, and gains may owe capital-gains tax (a 1031 exchange can defer both). Figures are a year-1 estimate at your 24.0% rate — not tax advice; consult a CPA.
Schools (NCES district)
- District
- Queensbury Union Free School District
- NCES district ID
- 3624030
- Math proficiency
- 57% ▼ -6.00%
- Reading proficiency
- 62% ▲ 2.00%
- Median HH income
- $61,595
- Composite
- 51.76/100
- National rank
- #1679
- State rank
- #230 of 590 in NY
Livability — West Glens Falls
- Score
- 71/100
- State rank
- #388
- US rank
- #6663
Category grades
Schools grade is shown separately in the Schools card above.
Census & demographics
- Census place
- West Glens Falls, NY
- Population (ZIP)
- 28,175
Population outlook (Warren County) Hauer SSP2
- Today (2025)
- 62,372 people
- By 2030
- 60,491 · -3.0%
- By 2040
- 55,616 · -10.8%
- By 2050
- 50,437 · -19.1%
- By 2075
- 40,843 · -34.5%
- By 2100
- 31,159 · -50.0%
Race, ethnicity, and origin ACS 2023
- Neighborhood character
- Predominantly White (92%)
- Race & ethnicity
- White 92% Two or more races 4% Hispanic / Latino 3%
- Common ancestry
- Lithuanian 8% Romanian 6% Slovak 4%
- Foreign-born
- 4% · Canada
- Languages at home
- 96% English-only · Spanish 2% French/Haitian/Cajun 1% German/W. Germanic 1%
Political lean MEDSL · Warren
- 2024 margin
- Toss-up / Even · D 47.9% · R 52.1%
- 2008→2024 swing
- -6.9pp toward R · 2008: 2.6pp · 2024: -4.2pp
- All cycles
- 2024: R+4.2 2020: R+0.2 2016: R+10.6 2012: D+2.1 2008: D+2.6
Not yet ingested
- Civics
- —
Market trends
- HPI YoY
- ▼ -33.40%
- Current HPI
- 337.1909
- Rent YoY
- —
- Metro
- —
- State GDP YoY
- ▲ 2.60%
- F500 in state
- 92
Industry mix (Fortune 500 HQ in NY)
| Industry | F500 HQs | Revenue |
|---|---|---|
| Financial Services | 10 | $950B |
|
||
| Consumer Goods | 9 | $162B |
|
||
| Insurance | 4 | $225B |
|
||
| Telecommunications | 2 | $144B |
|
||
| Pharmaceuticals | 2 | $112B |
|
||
| Media / Entertainment | 2 | $69B |
|
||
Price history
-15.3% since first listed8 events — show timeline
- 2026-06-16 Price Changed $99,999 Global MLS
- 2026-06-12 Price Changed $109,999 Global MLS
- 2026-05-15 Listed $119,999 Global MLS
- 2019-02-28 Listing Removed — Global MLS
- 2004-12-30 Listing Removed — Global MLS
- 2004-11-24 Sold (Public Records) $60,420 Public Records
- 2004-04-04 Listed $59,900 Global MLS
- 2003-10-15 Listed $118,000 Global MLS
Property tax history
+7.1%/yrLatest (2025): $2,579 · +17.3% YoY. Source: county tax records.
Cash-flow waterfall
monthlySold comps — $/sqft
last 12 mo · ≤1 miLoading sold comps…