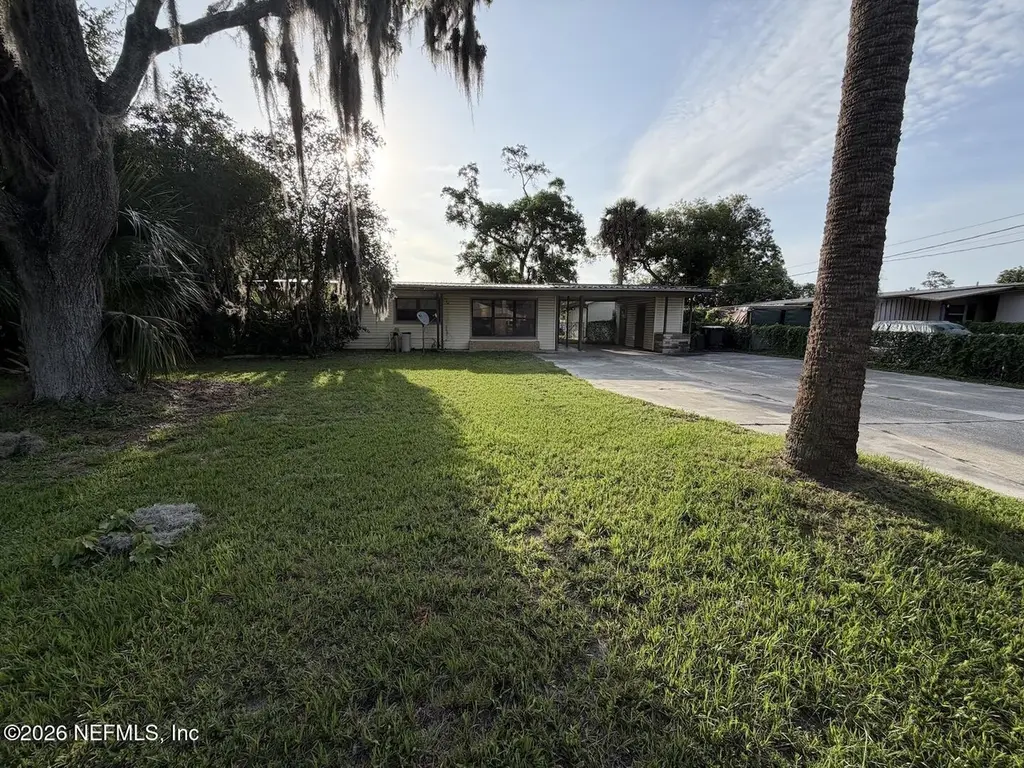
5235 Batley Rd · Jacksonville, FL
Flood risk 1/10 · Minimal
- FEMA flood zone
- X (unshaded)
- Chance of flooding over 30 yrs
- 0.0%
- Est. flood insurance / yr
- $507 – $1,088
Fire risk 2/10 · Minimal
- Est. fire insurance / yr
- $947 – $1,759
Heat risk 9/10 · Severe
- Hot days now (above 107°F)
- 7 days/yr
- Hot days in 30 yrs
- 21 days/yr
Wind risk 9/10 · Severe
- Chance of severe wind over 30 yrs
- 99.0%
Air-quality risk 3/10 · Minor
- Unhealthy air days now
- 3 days/yr
- Unhealthy air days in 30 yrs
- 4 days/yr
Risk factors via First Street. Map © Google.
Why this score? — see what drove the B- grade
The composite is a weighted blend of 9 inputs, each scored 0–100. Each bar is that input's sub-score; the figure is the points it added to the 100-point composite (weight × sub-score).
- Cash flow +24.4/30.0
- ARV discount +15.0/15.0
- DSCR +7.9/10.0
- 1% rule +7.7/10.0
- Livability +4.2/5.0
- Schools +3.9/10.0
- Rent growth +3.0/5.0
- Condition / age +2.5/5.0
- Appreciation +0.0/10.0
$115,000
🖨 Deal sheet (PDF) 📄 Offer letter ✓ Due diligence
Listing remarks MLS
This charming 3 bedroom, 1.5 bathroom, 1 car garage home is now on the market! Enjoy preparing meals in this impressive kitchen equipped with ample cabinets and generous counter space. Discover a bright interior with neutral tile floors and plush carpet in all the right places. The main bedroom boasts a private ensuite and walk-in closet. Other bedrooms offer ceiling fans, and sizable closets. Relax with your favorite drink in the fenced in backyard with a covered patio, lush grass, and great opportunity for adding personal touches. Don't miss this incredible opportunity.
Key facts
- Detached workshop
- Fenced in back yard
- Oversized driveway
Tags
Property features AI
Exterior
- Parking: Carport (1 space)
- Utilities: Public sewer; Electricity available; Sewer available; Water available
- Home design: Single family residence; Property used as a single-family home
- Exterior features: Covered rear porch; Screened porch; Back yard fencing; Workshop
Interior
- Kitchen: Electric oven
- Bedrooms: 3 bedrooms
- Bathrooms: 1 full bathroom; 1 half bathroom
- Heating & cooling: Electric heating; Central air conditioning
- Interior features: Electric oven
Neighborhood map
What this means for you Summary
Snapshot
- This is a 3-bed/2.0-bath single-family listed at $115k.
Deal economics
- At list price, monthly cash flow is $234 ($3k/yr) — positive.
- The deal already cash-flows at list — no discount required.
- Meets the 1% rule at list price ($1k rent vs $115k).
- Cap rate 8.7% vs local median 3.9% in Jacksonville — top-decile yield for the area; either an underpriced asset or a hidden risk that comps aren't pricing in. Stress-test before assuming the spread holds.
Location & tenants
- Location reads 83/100 on livability (#50 in FL, #911 nationally) — a professional / high-income tenant draw. Strengths: amenities A+, commute A+, housing A+.
- Duval (urban): math 46% / reading 45% proficiency, ranked #48 of 73 in FL (top 66%) — families likely to look elsewhere, expect single-tenant / working-renter base with shorter leases.
- Zoned schools: Cedar Hills Elementary School (math 30% / reading 25%, grade F, #1,962 of 2,144 statewide, top 92%, 450 students, 76% FRL); Charger Academy (math 33% / reading 26%, grade F, #469 of 571 statewide, top 84%, 961 students, 71% FRL); Westside High School (math 26% / reading 19%, grade F, #539 of 667 statewide, top 81%, 1,583 students, 63% FRL) — zoned schools average 70% FRL vs 49% district-wide (21 pts higher); higher-poverty schools than district average — tighter screening recommended.
- Zoned-school proficiency averages 26% at this address vs 46% district-wide (-19 pts) — the specific schools serving this property underperform the Duval average; the district grade overstates school quality for this exact location.
- Market conditions: Rents rising (+2.1%/yr); 441 active listings in the ZIP; 40 comparable units currently listed for rent nearby; rentals at typical pace (median 18d on market — plan ~3-4 weeks tenant-placement turnaround); 6,503 units permitted in Duval County in 2024 (1,131 in 5+ unit buildings).
Forward outlook
- Local home prices are declining (-3.0%/yr); year-one equity from $795 of loan paydown is wiped out by about $3k of value loss. Plan a longer hold.
- Duval County population projected at +19% by 2050 — long-run rental-demand tailwind backs the buy-and-hold thesis.
Negotiation context
- Only 14 days on market — expect competitive offers; lowballing is unlikely to land.
- 5 sale attempts since 24y ago with the ask held roughly flat each time — persistent listings suggest the price (not the market) is what's stuck; bring a comps-based counter.
Risks & watch-outs
- Watch-outs: property tax is 2.8% of price; built in 1957 — expect roof / HVAC / electrical / plumbing capex.
- Climate carrying-cost: severe wind risk, 99% chance of damaging wind over 30y; extreme-heat days projected 7→21/yr by 2055 (HVAC capex compounding) — expect insurance premiums to compound above CPI over the hold.
Questions for the listing agent
- Built in 1957 — when were the roof, HVAC, electrical panel, plumbing, and water heater last replaced?
- Property tax is high relative to price — has the assessment been appealed recently, and will the sale trigger a re-assessment?
- Is there a deadline driving the sale (1031 exchange, divorce, estate, relocation)? That informs how much negotiation room exists.
- Schools are B-rated — typically a magnet for longer-tenancy family renters. What's the average tenant stay here, and is there a school-zone premium baked into asking?
- What's the average days-on-market for RENTAL listings here right now (not sales)? A rising rental-DOM trend means longer vacancies and softer asking-rent achievability than the comps imply.
- What's the recent tenant-quality profile in this submarket — average credit score on applications, eviction rate, late-payment / NSF rate, and stable-employment percentage? A property-management company in the area should have these aggregated.
- How much new for-sale + rental construction is in the pipeline within 1–3 miles? Heavy new supply typically softens prices + rents 12–24 months out; constrained supply supports both.
Investment metrics
- 1% rule
- 1.27% ✓
- Cap rate
- 8.73%
- Cash-on-cash
- 8.71%
- DSCR
- 1.39
- GRM
- 6.6
CMA / ARV
- ARV (on-the-fly)
- $199,000
- Comps found
- 12
Show comp detail 12 sales within ~0.75 mi
| Address | Dist | Beds/Ba | Sqft | Sold | Price | $/sf | Match |
|---|---|---|---|---|---|---|---|
| 6722 London Bridge Ln | 0.27mi | 3/1.5 | 1,008 (+1%) | 11mo | $205,000 | $203 | 75 |
| 5234 Witby Ave | 0.07mi | 3/2.0 | 1,096 (+10%) | 14mo | $223,150 | $204 | 69 |
| 5822 Tampico Rd | 0.57mi | 3/1.0 | 1,000 (0%) | 2mo | $125,000 | $125 | 68 |
| 4417 Anvers Blvd | 0.58mi | 3/2.0 | 1,030 (+3%) | 9mo | $145,000 | $141 | 60 |
| 5726 Norde Dr E | 0.38mi | 3/1.5 | 1,040 (+4%) | 16mo | $194,000 | $187 | 60 |
| 6769 Daughtry Blvd S | 0.31mi | 3/2.0 | 1,120 (+12%) | 9mo | $249,500 | $223 | 58 |
| 6358 Claret Dr | 0.38mi | 3/1.0 | 884 (-12%) | 4mo | $165,000 | $187 | 55 |
| 6239 Claret Dr | 0.51mi | 3/1.0 | 1,051 (+5%) | 11mo | $120,000 | $114 | 54 |
| 4317 Rainer Rd | 0.71mi | 3/2.0 | 1,008 (+1%) | 17mo | $180,000 | $179 | 51 |
| 6048 Transylvania Ave | 0.64mi | 3/2.0 | 943 (-6%) | 16mo | $201,000 | $213 | 47 |
| 5936 Jammes Rd | 0.64mi | 3/1.0 | 1,066 (+7%) | 14mo | $213,000 | $200 | 43 |
| 6301 Sauterne Dr | 0.45mi | 4/2.0 (+1) | 1,131 (+13%) | 15mo | $225,000 | $199 | 40 |
Match score weights: distance 35% · size 25% · config 20% · recency 20%. Top-matched comps best support the ARV.
Projected returns pro-forma
-3.0% appreciation · 2.11% rent growth · sell at horizon
- IRR
- -4.1%
- Equity multiple
- 0.85×
- Total profit
- $-4,947
- Equity at exit
- $17,147
- IRR
- 4.4%
- Equity multiple
- 1.31×
- Total profit
- $10,035
- Equity at exit
- $9,943
Cash invested: $32,200 (down + closing). Projections, not guarantees.
Landlord ↔ Tenant lean methodology
- Overall (STATE)
- 87 Strongly Landlord-Friendly
- State Florida
- 87 Strongly Landlord-Friendly · R+3
- County
- — inherits STATE
- City
- — inherits STATE
ZIP-level market 32210
- Rents YoY
- 2.1%
- Active inventory
- 441
- Price-to-rent
- 6.6×
Monthly cashflow live
- Estimated rent
- $1,462 high interval (Pro) →
- Mortgage (P&I)
- −$603
- Tax from tax record
- −$270 /mo · $3,239/yr
- Insurance
- −$48
- HOA
- −$0
- Vacancy / Maint / Mgmt
- −$307
- Net cashflow
- $234
Break-even live
Sensitivity live
| Price | -10% $299 | -5% $266 | +0% $234 | +5% $201 | +10% $169 |
|---|---|---|---|---|---|
| Rent | -10% $118 | -5% $176 | +0% $234 | +5% $291 | +10% $349 |
| Rate | -1.0pp $292 | -0.5pp $263 | base $234 | +0.5pp $204 | +1.0pp $174 |
UW: 25.0% down · 7.5% · 30yr · 1.5% tax · 5.0% vac · 8.0% maint · 8.0% mgmt
Financing live
Cash to close
- Down payment
- $28,750
- Closing costs
- $3,450
- Reserves months
- —
- Total cash needed
- —
Loan-product check · same deal, 3 products live
Conventional
25% down · 7.5% · 30yr
- Down + closing
- —
- Monthly P&I
- —
- Monthly cashflow
- —
- DSCR
- —
- Eligible?
- —
Personal DTI + credit; lowest rate.
DSCR
20% down · 8.5% · 30yr
- Down + closing
- —
- Monthly P&I
- —
- Monthly cashflow
- —
- DSCR
- —
- Eligible?
- —
No personal income docs; deal must DSCR.
Hard money
10% down · 12.0% · 12mo
- Down + closing
- —
- Monthly P&I
- —
- Monthly cashflow
- —
- DSCR
- —
- Eligible?
- —
Short-term bridge; refi at stabilization.
Rent comps 40 comps
| Address | Beds | Baths | Sqft | Rent | $/sqft | DOM | Units | Dist |
|---|---|---|---|---|---|---|---|---|
| 6766 Londonbridge Ln Jacksonville, FL | 3.0 | 2.0 | 1300 | $1,775 | $1.37 | 21d | 1 | 0.30mi |
| 4710 Herta Rd Jacksonville, FL | 4.0 | 2.0 | 1272 | $1,670 | $1.31 | 25d | 1 | 0.33mi |
| 6511 Burgundy Rd S Jacksonville, FL | 3.0 | 2.0 | 1361 | $1,685 | $1.24 | 5d | 1 | 0.34mi |
| 6479 Sweetbay Ln Jacksonville, FL | 2.0 | 2.0 | 1040 | $1,365 | $1.31 | 25d | 1 | 0.36mi |
| 6468 Sweetbay Ln #101 Jacksonville, FL | 2.0 | 2.0 | 1025 | $1,199 | $1.17 | 4d | 1 | 0.37mi |
| 6468 Sweetbay Ln Unit 102 Jacksonville, FL | 2.0 | 2.0 | 1040 | $1,174 | $1.13 | 22d | 1 | 0.37mi |
| 6462 Sweetbay Ln Jacksonville, FL | 2.0 | 2.0 | 1040 | $1,365 | $1.31 | 17d | 1 | 0.38mi |
| 6522 Sweetbay Ln Jacksonville, FL | 2.0 | 2.0 | 951 | $1,195 | $1.26 | 25d | 1 | 0.39mi |
| 6461 Sweetbay Ln Jacksonville, FL | 2.0 | 2.0 | 995 | $1,295 | $1.30 | 17d | 4 | 0.39mi |
| 6528 Sweetbay Ln Jacksonville, FL | 2.0 | 2.0 | 1040 | $1,150 | $1.11 | 25d | 1 | 0.40mi |
| 6379 Delacy Rd Jacksonville, FL | 3.0 | 1.0 | 1296 | $1,495 | $1.15 | 25d | 1 | 0.41mi |
| 6534 Sweetbay Ln Jacksonville, FL | 2.0 | 2.0 | 951 | $1,225 | $1.29 | 25d | 1 | 0.41mi |
| 6547 Sweetbay Ln Unit 102 Jacksonville, FL | 2.0 | 2.0 | 1040 | $1,195 | $1.15 | 6d | 1 | 0.41mi |
| 6870 103rd St Jacksonville, FL | 1.0–2.0 | 1.0–1.5 | 825 | $1,075 | $1.30 | 4d | 14 | 0.42mi |
| 6408 Sweetbay Ln Jacksonville, FL | 2.0 | 2.0 | 951 | $1,225 | $1.29 | 17d | 1 | 0.45mi |
| 6325 Delacy Rd Jacksonville, FL | 4.0 | 2.0 | 1286 | $1,680 | $1.31 | 6d | 1 | 0.45mi |
| 4503 Anvers Blvd Jacksonville, FL | 3.0 | 2.0 | 1084 | $1,595 | $1.47 | 25d | 1 | 0.50mi |
| 5745 Antoinette Ln Jacksonville, FL | 2.0 | 1.0 | 1200 | $1,150 | $0.96 | 4d | 1 | 0.57mi |
| 5747 Antoinette Ln Jacksonville, FL | 2.0 | 1.0 | 1200 | $1,195 | $1.00 | 25d | 1 | 0.57mi |
| 5913 Tampico Rd Jacksonville, FL | 3.0 | 1.0 | 1110 | $1,348 | $1.21 | 15d | 1 | 0.60mi |
| 4336 Harlow Blvd Jacksonville, FL | 3.0 | 2.0 | 1408 | $1,499 | $1.06 | 3d | 1 | 0.63mi |
| 4804 Ducheneau Dr Unit 26 Jacksonville, FL | 3.0 | 2.0 | 1182 | $1,635 | $1.38 | 25d | 1 | 0.63mi |
| 5931 Wilmar Rd Jacksonville, FL | 4.0 | 1.0 | 706 | $1,095 | $1.55 | 25d | 1 | 0.63mi |
| 5951 Wilmar Rd Jacksonville, FL | 2.0 | 1.0 | 706 | $1,095 | $1.55 | 25d | 1 | 0.66mi |
| 5933 Jammes Rd Jacksonville, FL | 3.0 | 3.0 | 1071 | $1,900 | $1.77 | 25d | 1 | 0.66mi |
| 7059 Melvin Rd Jacksonville, FL | 3.0 | 2.0 | 1330 | $1,600 | $1.20 | 3d | 1 | 0.67mi |
| 6560 Barmer Dr S Jacksonville, FL | 4.0 | 2.0 | 1370 | $1,750 | $1.28 | 3d | 1 | 0.73mi |
| 5984 Windsor Forest Dr Jacksonville, FL | 2.0 | 1.5 | 900 | $1,174 | $1.30 | 22d | 2 | 0.78mi |
| 5985 Windsor Forest Dr Jacksonville, FL | 2.0 | 1.5 | 900 | $1,099 | $1.22 | 9d | 1 | 0.78mi |
| 5985 Windsor Forest Dr Unit 23 Jacksonville, FL | 2.0 | 1.5 | 900 | $999 | $1.11 | 22d | 1 | 0.78mi |
| 5985 Windsor Forest Dr Unit 15 Jacksonville, FL | 2.0 | 1.5 | 900 | $999 | $1.11 | 9d | 1 | 0.78mi |
| 5816 Sonora Dr W Jacksonville, FL | 3.0 | 1.0 | 975 | $1,580 | $1.62 | 18d | 1 | 0.79mi |
| 6019 Verdes Rd Jacksonville, FL | 3.0 | 1.0 | 1209 | $1,335 | $1.10 | 25d | 1 | 0.82mi |
| 5984 Creekside Crossing Dr Jacksonville, FL | 3.0 | 2.5 | 1404 | $1,695 | $1.21 | 16d | 1 | 0.88mi |
| 5988 Creekside Crossing Dr Jacksonville, FL | 3.0 | 2.5 | 1404 | $1,850 | $1.32 | 16d | 1 | 0.88mi |
| 5958 Creekside Crossing Dr Jacksonville, FL | 3.0 | 2.5 | 1404 | $1,895 | $1.35 | 12d | 1 | 0.89mi |
| 4442 Georgetown Dr Jacksonville, FL | 3.0 | 2.0 | 1259 | $1,386 | $1.10 | 4d | 1 | 0.92mi |
| 7318 Strato Rd Jacksonville, FL | 3.0 | 2.0 | 1204 | $1,550 | $1.29 | 4d | 1 | 0.95mi |
| 7262 Kivler Dr Jacksonville, FL | 3.0 | 1.0 | 759 | $1,499 | $1.97 | 25d | 1 | 0.98mi |
| 5928 Firestone Rd Jacksonville, FL | 1.0–3.0 | 1.0–2.0 | 944 | $1,600 | $1.69 | 4d | 13 | 1.00mi |
Listing history 12 events
-
2026-06-18status $115,000 Pending 14 DOM
-
2026-06-18days on market $115,000 Active 14 DOM
-
2026-06-17days on market $115,000 Active 13 DOM
-
2026-06-16days on market $115,000 Active 12 DOM
-
2026-06-15days on market $115,000 Active 11 DOM
-
2026-06-13days on market $115,000 Active 9 DOM
-
2026-06-13days on market $115,000 Active 8 DOM
-
2026-06-09days on market $115,000 Active 5 DOM
-
2026-06-08days on market $115,000 Active 4 DOM
-
2026-06-07days on market $115,000 Active 3 DOM
-
2026-06-05remarks 316-char remark
-
2026-06-05$115,000 Active 1 DOM
ⓘ Source: listings_history table (triggers on properties + properties_extension) + one-shot
backfill from property_details.listing_events for pre-trigger history.
Tax reassessment forecast FL · Resets to sale price
- Current annual tax
- $3,239 · $270/mo
- Projected year-2 tax
- $3,239 · $270/mo
- Expected delta
- $0/yr ($0/mo · 0.0%)
ⓘ Screening estimate from a state-policy table — verify with the county assessor before closing.
Climate risk First Street
- Flood 1/10 Low FEMA zone X (unshaded) · 0% chance over 30 yrs
- Wildfire 2/10 Low
- Heat 9/10 Extreme 7 d/yr ≥107°F today · 21 d/yr by 30 yrs out
- Wind 9/10 Extreme 99% chance of damaging wind over 30 yrs
- Air quality 3/10 Moderate 3 unhealthy d/yr today · 4 by 30 yrs out
Nearby sold comps map
Loading sold comps map…
Walkable amenities ~0.75 mi
Loading nearby amenities…
Taxation est. · year 1
- Rental income
- $17,538
- − Mortgage interest
- −$6,442
- − Property taxes
- −$3,239
- − Insurance
- −$575
- − Repairs & maintenance
- −$1,403
- − Management
- −$1,403
- − Depreciation
- −$3,345
- Taxable income
- $1,131
- Est. tax owed @ 24.0%
- −$271
- After-tax cash flow
- $2,533/yr
For passive investors: Depreciation is non-cash, so a rental often shows a tax loss while cash-flowing — sheltering income. Rental losses are passive: they offset passive income freely, and up to $25,000/yr can offset ordinary (W-2) income if you actively participate and your MAGI is under $100k (phasing out to $0 by $150k); unused losses carry forward. On sale, claimed depreciation is recaptured at up to 25%, and gains may owe capital-gains tax (a 1031 exchange can defer both). Figures are a year-1 estimate at your 24.0% rate — not tax advice; consult a CPA.
Schools (NCES district)
- District
- Duval
- NCES district ID
- 1200480
- Math proficiency
- 46% ▼ -11.00%
- Reading proficiency
- 45% ▼ -4.00%
- Median HH income
- $48,987
- Composite
- 38.97/100
- National rank
- #4076
- State rank
- #48 of 73 in FL
Livability — Jacksonville
- Score
- 83/100
- State rank
- #50
- US rank
- #911
Category grades
Schools grade is shown separately in the Schools card above.
Census & demographics
- Census place
- Jacksonville, FL
- County
- Duval County · 1,015,274 people
- City population
- 979,034
- Metro
- Jacksonville, FL
- Population (ZIP)
- 65,729
- Household income
- $61,050
- Rent vs Own
- Severe rent burden
- 3605.0
Population outlook (Duval County) Hauer SSP2
- Today (2025)
- 1,013,010 people
- By 2030
- 1,059,228 · +4.6%
- By 2040
- 1,141,439 · +12.7%
- By 2050
- 1,205,258 · +19.0%
- By 2075
- 1,324,282 · +30.7%
- By 2100
- 1,319,620 · +30.3%
Race, ethnicity, and origin ACS 2023
- Neighborhood character
- Diverse neighborhood (Simpson 0.65)
- Race & ethnicity
- White 43% Black 38% Hispanic / Latino 10% Two or more races 7% Asian 3%
- Hispanic origin (detail)
- Mexican 3% Puerto Rican 3%
- Common ancestry
- Slovak 2% Hispanic 2% Italian 1%
- Foreign-born
- 10% · Canada, Vietnam, China
- Languages at home
- 86% English-only · Spanish 7% French/Haitian/Cajun 2% Tagalog/Filipino 1%
Political lean MEDSL · Duval
- 2024 margin
- Toss-up / Even · D 48.7% · R 50.1% · Other 1.2%
- 2008→2024 swing
- +0.4pp no change · 2008: -1.9pp · 2024: -1.5pp
- All cycles
- 2024: R+1.5 2020: D+3.8 2016: R+1.5 2012: R+3.6 2008: R+1.9
Not yet ingested
- Civics
- —
Market trends
- HPI YoY
- ▼ -314.81%
- Current HPI
- 281.2688
- Rent YoY
- ▲ 2.11%
- Metro
- Jacksonville, FL
- State GDP YoY
- ▲ 3.28%
- F500 in state
- 36
Industry mix (Fortune 500 HQ in FL)
| Industry | F500 HQs | Revenue |
|---|---|---|
| Industrial Technology | 2 | $29B |
|
||
| Insurance | 2 | $17B |
|
||
| Retail | 1 | $60B |
|
||
| Technology Distribution | 1 | $58B |
|
||
| Homebuilding | 1 | $35B |
|
||
| Technology Manufacturing | 1 | $35B |
|
||
Price history
+140.6% since first listed18 events — show timeline
- 2026-06-03 Listed $115,000 realMLS
- 2022-09-12 Sold (Public Records) $205,000 Public Records
- 2022-09-02 Sold (MLS) $205,000 realMLS
- 2022-07-19 Pending — realMLS
- 2022-07-01 Price Changed $198,000 realMLS
- 2022-06-26 Sold (Public Records) $171,300 Public Records
- 2022-06-09 Listed $210,000 realMLS
- 2009-11-03 Sold (Public Records) $77,000 Public Records
- 2009-11-01 Listing Removed — realMLS
- 2009-10-30 Sold (MLS) $77,000 realMLS
- 2009-08-11 Listed $79,500 realMLS
- 2009-07-09 Sold (MLS) $20,000 realMLS
- 2009-05-18 Listed $32,900 realMLS
- 2002-10-26 Listing Removed — realMLS
- 2002-06-25 Listed $79,900 realMLS
- 2001-02-02 Sold (Public Records) $56,000 Public Records
- 1990-05-01 Sold (Public Records) $49,500 Public Records
- 1988-08-01 Sold (Public Records) $47,800 Public Records
Property tax history
+15.2%/yrLatest (2025): $3,239 · +7.8% YoY. Source: county tax records.
Cash-flow waterfall
monthlySold comps — $/sqft
last 12 mo · ≤1 miLoading sold comps…