86 Elm Ave · Monticello, KY
Flood risk No data
- FEMA flood zone
- —
- Chance of flooding over 30 yrs
- —
- Est. flood insurance / yr
- —
Fire risk No data
- Est. fire insurance / yr
- —
Heat risk No data
- Hot days now (above threshold)
- —
- Hot days in 30 yrs
- —
Wind risk No data
- Chance of severe wind over 30 yrs
- —
Air-quality risk No data
- Unhealthy air days now
- —
- Unhealthy air days in 30 yrs
- —
Risk factors via First Street. Map © Google.
Why this score? — see what drove the B+ grade
The composite is a weighted blend of 9 inputs, each scored 0–100. Each bar is that input's sub-score; the figure is the points it added to the 100-point composite (weight × sub-score).
- Cash flow +30.0/30.0
- ARV discount +15.0/15.0
- DSCR +10.0/10.0
- 1% rule +9.6/10.0
- Appreciation +5.0/10.0
- Livability +3.2/5.0
- Rent growth +2.5/5.0
- Condition / age +2.2/5.0
- Schools +2.1/10.0
$80,000
🖨 Deal sheet 📄 Offer letter ✓ Due diligence
Listing remarks
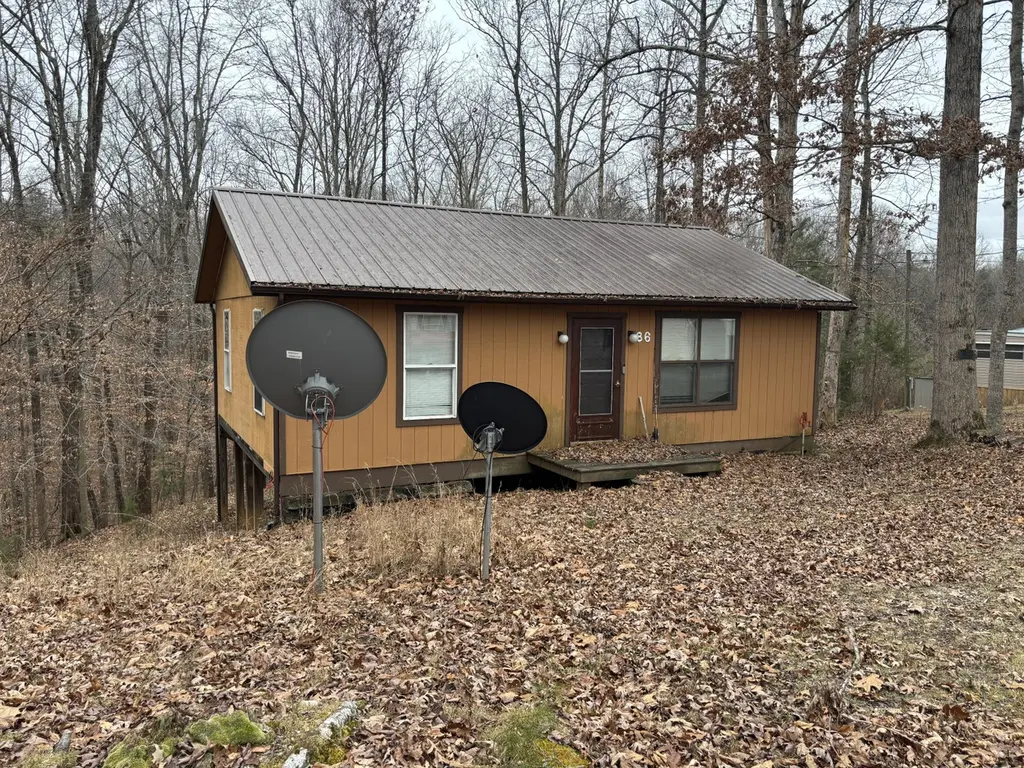
Charming 2-Bed, 1-Bath Cabin in Clearwater Subdivision - Includes 80A/B, 81A/B, 82A/B, 83A/B Tucked away in the tranquil Clearwater Subdivision, this cozy 2-bedroom, 1-bath cabin offers the perfect escape with timeless rustic charm. Built to last, this cabin promises generations of peaceful living and adventure. Whether you're searching for a weekend getaway, a hunting retreat, or a secluded woodland home, the options are endless. The property spans multiple parcels (80A/B, 81A/B, 82A/B, 83A/B), providing ample space for outdoor enjoyment or future development. Come experience the serenity and beauty of The Oakes at Clearwater today!
Key facts
- Multiple parcels
- 0.91 acre lot
- Listed 26 days
Tags
Neighborhood map
What this means for you Summary
Snapshot
- This is a 2-bed/1.0-bath single-family listed at $80k. Condition is rated fair.
Deal economics
- At list price, monthly cash flow is $371 ($4k/yr) — positive.
- The deal already cash-flows at list — no discount required.
- Meets the 1% rule at list price ($1k rent vs $80k).
- Recommended offer: $79k (1.5% below list) — sets the bar for market timing.
- Cap rate 11.9% vs local median 3.6% in Monticello — top-decile yield for the area; either an underpriced asset or a hidden risk that comps aren't pricing in. Stress-test before assuming the spread holds.
Location & tenants
- Location reads 65/100 on livability (#265 in KY) — a middle-class / working-renter tenant base. Strengths: crime A+, cost of living A+, housing A+; Watch: schools F, amenities F, commute F.
- Wayne County (town): math 20% / reading 33% proficiency, ranked #142 of 165 in KY (top 86%) — low school quality limits family demand, transient renter base, plan for 1-2y turnover.
- Market conditions: 172 active listings in the ZIP.
Forward outlook
- In year one you build about $510 of equity ($553 loan paydown + $-43 appreciation (-0.1% local appreciation)).
- Wayne County population projected at -20% by 2050 — secular population decline; favor cash flow + early exit over multi-decade hold.
- At projected returns (-0.1% appreciation + 3.0% rent growth), your $22k cash investment doubles in ~5 years — after that, you're playing with house money.
Negotiation context
- It's been on market 26 days — a 2% lower offer ($79k) is reasonable based on typical stale-listing flexibility.
Questions for the listing agent
- Have any recent inspections been done? Can we get a copy of the seller's disclosures and any deferred-maintenance estimates?
- Is there a deadline driving the sale (1031 exchange, divorce, estate, relocation)? That informs how much negotiation room exists.
- Schools are F-rated, which usually means shorter tenancies and higher turnover. Who's the typical renter profile here, and what's been the actual vacancy rate?
- What's the average days-on-market for RENTAL listings here right now (not sales)? A rising rental-DOM trend means longer vacancies and softer asking-rent achievability than the comps imply.
- What's the recent tenant-quality profile in this submarket — average credit score on applications, eviction rate, late-payment / NSF rate, and stable-employment percentage? A property-management company in the area should have these aggregated.
- How much new for-sale + rental construction is in the pipeline within 1–3 miles? Heavy new supply typically softens prices + rents 12–24 months out; constrained supply supports both.
Investment metrics
- 1% rule
- 1.46% ✓
- Cap rate
- 11.85%
- Cash-on-cash
- 19.86%
- DSCR
- 1.88
- GRM
- 5.7
CMA / ARV
- ARV (median comp)
- $103,546
- List price
- $80,000
- Delta
- -22.74%
- Verdict
- UNDERPRICED
- Comps
- 6 within 1.0 mi
Projected returns pro-forma
-0.05% appreciation · 3.0% rent growth · sell at horizon
- IRR
- 19.5%
- Equity multiple
- 1.94×
- Total profit
- $21,084
- Equity at exit
- $23,013
- IRR
- 23.9%
- Equity multiple
- 3.64×
- Total profit
- $59,099
- Equity at exit
- $27,490
Cash invested: $22,400 (down + closing). Projections, not guarantees.
Landlord ↔ Tenant lean methodology
- Overall (STATE)
- 83 Strongly Landlord-Friendly
- State Kentucky
- 83 Strongly Landlord-Friendly · R+16
- County
- — inherits STATE
- City
- — inherits STATE
ZIP-level market 42544
- Home prices YoY
- -0.0%
- Active inventory
- 172
- Price-to-rent
- 5.7×
Monthly cashflow live
- Estimated rent
- $1,169 medium interval (Pro) →
- Mortgage (P&I)
- −$420
- Tax est. 1.5%
- −$100 /mo · $1,200/yr
- Insurance
- −$33
- HOA
- −$0
- Vacancy / Maint / Mgmt
- −$246
- Net cashflow
- $371
Break-even live
UW: 25.0% down · 7.5% · 30yr · 1.5% tax · 5.0% vac · 8.0% maint · 8.0% mgmt
Financing live
Cash to close
- Down payment
- $20,000
- Closing costs
- $2,400
- Reserves months
- —
- Total cash needed
- —
Loan-product check · same deal, 3 products live
Conventional
25% down · 7.5% · 30yr
- Down + closing
- —
- Monthly P&I
- —
- Monthly cashflow
- —
- DSCR
- —
- Eligible?
- —
Personal DTI + credit; lowest rate.
DSCR
20% down · 8.5% · 30yr
- Down + closing
- —
- Monthly P&I
- —
- Monthly cashflow
- —
- DSCR
- —
- Eligible?
- —
No personal income docs; deal must DSCR.
Hard money
10% down · 12.0% · 12mo
- Down + closing
- —
- Monthly P&I
- —
- Monthly cashflow
- —
- DSCR
- —
- Eligible?
- —
Short-term bridge; refi at stabilization.
Listing history 19 events
-
2026-06-18days on market $80,000 Active 26 DOM
-
2026-06-17days on market $80,000 Active 25 DOM
-
2026-06-16days on market $80,000 Active 24 DOM
-
2026-06-15days on market $80,000 Active 23 DOM
-
2026-06-13days on market $80,000 Active 21 DOM
-
2026-06-12days on market $80,000 Active 20 DOM
-
2026-06-09days on market $80,000 Active 17 DOM
-
2026-06-08days on market $80,000 Active 16 DOM
-
2026-06-07days on market $80,000 Active 15 DOM
-
2026-06-05days on market $80,000 Active 13 DOM
-
2026-06-04days on market $80,000 Active 11 DOM
-
2026-06-02days on market $80,000 Active 10 DOM
-
2026-06-01days on market $80,000 Active 9 DOM
-
2026-05-31days on market $80,000 Active 8 DOM
-
2026-05-31days on market $80,000 Active 7 DOM
-
2026-05-18historical
-
2026-05-04price $80,000
-
2026-02-07price $99,900
-
2025-12-16$120,000 Active
ⓘ Source: listings_history table (triggers on properties + properties_extension) + one-shot
backfill from property_details.listing_events for pre-trigger history.
Nearby sold comps map
Loading sold comps map…
Walkable amenities ~0.75 mi
Loading nearby amenities…
Taxation est. · year 1
- Rental income
- $14,029
- − Mortgage interest
- −$4,481
- − Property taxes
- −$1,200
- − Insurance
- −$400
- − Repairs & maintenance
- −$1,122
- − Management
- −$1,122
- − Depreciation
- −$2,327
- Taxable income
- $3,376
- Est. tax owed @ 24.0%
- −$810
- After-tax cash flow
- $3,638/yr
For passive investors: Depreciation is non-cash, so a rental often shows a tax loss while cash-flowing — sheltering income. Rental losses are passive: they offset passive income freely, and up to $25,000/yr can offset ordinary (W-2) income if you actively participate and your MAGI is under $100k (phasing out to $0 by $150k); unused losses carry forward. On sale, claimed depreciation is recaptured at up to 25%, and gains may owe capital-gains tax (a 1031 exchange can defer both). Figures are a year-1 estimate at your 24.0% rate — not tax advice; consult a CPA.
Condition & rehab AI · 12 photos
This cabin requires significant repairs and maintenance to improve its condition and increase its value.
Repairs flagged
- Major siding — Significant wear and tear
- Major roof — Signs of wear
- Major flooring — Exposed subflooring
- Major exterior landscaping — Overgrown vegetation
Value-add opportunities
- Both repair and paint exterior — Improves curb appeal and value
- Both repair and paint interior walls — Enhances interior appearance and value
- Both repair and replace flooring — Improves living space and value
- Both repair and replace roof — Ensures structural integrity and value
Renovation cost estimate screening
| Repair item | Severity | Est. cost |
|---|---|---|
| siding · Significant wear and tear | Major | $15,000–50,000 |
| roof · Signs of wear | Major | $15,000–50,000 |
| flooring · Exposed subflooring | Major | $15,000–50,000 |
| exterior landscaping · Overgrown vegetation | Major | $15,000–50,000 |
| Total estimated repair cost · 4 items | $60,000–200,000 |
Value-add ROI direction
- Both repair and paint exterior — Improves curb appeal and value ↑
- Both repair and paint interior walls — Enhances interior appearance and value ↑
- Both repair and replace flooring — Improves living space and value ↑
- Both repair and replace roof — Ensures structural integrity and value ↑
ⓘ Cost ranges are severity-bucket heuristics (US national rule-of-thumb). Get contractor quotes + a written scope before underwriting a rehab budget.
Schools (NCES district)
- District
- Wayne County
- NCES district ID
- 2105790
- Math proficiency
- 20% ▼ -21.00%
- Reading proficiency
- 33% ▼ -21.00%
- Median HH income
- $30,391
- Composite
- 21.38/100
- National rank
- #8358
- State rank
- #142 of 165 in KY
Livability — Monticello
- Score
- 65/100
- State rank
- #265
- US rank
- #12963
Category grades
Schools grade is shown separately in the Schools card above.
Census & demographics
- Population (ZIP)
- 5,731
Population outlook (Wayne County) Hauer SSP2
- Today (2025)
- 19,477 people
- By 2030
- 18,776 · -3.6%
- By 2040
- 17,199 · -11.7%
- By 2050
- 15,602 · -19.9%
- By 2075
- 11,883 · -39.0%
- By 2100
- 8,300 · -57.4%
Race, ethnicity, and origin ACS 2023
- Neighborhood character
- Predominantly White (96%)
- Race & ethnicity
- White 96% Asian 2% Two or more races 1%
- Common ancestry
- Serbian 4% Romanian 2% Italian 2%
- Foreign-born
- 1% · Vietnam
- Languages at home
- 98% English-only · Other Indo-European 1% Chinese 1% Vietnamese 1%
Political lean MEDSL · Wayne
- 2024 margin
- Solid R (+66.0) · D 16.5% · R 82.5%
- 2008→2024 swing
- -28.9pp toward R · 2008: -37.1pp · 2024: -66.0pp
- All cycles
- 2024: R+66.0 2020: R+62.0 2016: R+61.8 2012: R+47.6 2008: R+37.1
Not yet ingested
- Civics
- —
Market trends
- HPI YoY
- ▼ -0.05%
- Current HPI
- 273.9998
- Rent YoY
- —
- Metro
- —
- State GDP YoY
- ▲ 1.81%
- F500 in state
- 4
Industry mix (Fortune 500 HQ in KY)
| Industry | F500 HQs | Revenue |
|---|---|---|
| Healthcare | 1 | $118B |
|
||
| Food / Beverage | 1 | $7B |
|
||
Price history
-33.3% since first listed4 events — show timeline
- 2026-05-18 Listing Removed — ImagineMLS
- 2026-05-04 Price Changed $80,000 ImagineMLS
- 2026-02-07 Price Changed $99,900 ImagineMLS
- 2025-12-16 Listed $120,000 ImagineMLS
Cash-flow waterfall
monthlySold comps — $/sqft
last 12 mo · ≤1 miLoading sold comps…