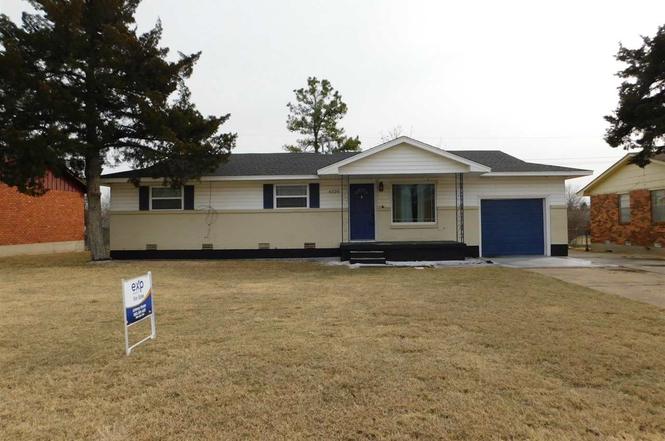
4320 NW Lincoln Ave · Lawton, OK
Flood risk 1/10 · Minimal
- FEMA flood zone
- X (unshaded)
- Chance of flooding over 30 yrs
- 0.0%
- Est. flood insurance / yr
- $507 – $1,088
Fire risk 6/10 · Moderate
- Est. fire insurance / yr
- $2,463 – $4,575
Heat risk 6/10 · Moderate
- Hot days now (above 109°F)
- 7 days/yr
- Hot days in 30 yrs
- 19 days/yr
Wind risk 2/10 · Minimal
- Chance of severe wind over 30 yrs
- 5.0%
Air-quality risk 1/10 · Minimal
- Unhealthy air days now
- 0 days/yr
- Unhealthy air days in 30 yrs
- 0 days/yr
Risk factors via First Street. Map © Google.
Why this score? — see what drove the C grade
The composite is a weighted blend of 9 inputs, each scored 0–100. Each bar is that input's sub-score; the figure is the points it added to the 100-point composite (weight × sub-score).
- Cash flow +18.9/30.0
- ARV discount +15.0/15.0
- DSCR +6.0/10.0
- 1% rule +4.7/10.0
- Rent growth +3.8/5.0
- Livability +3.2/5.0
- Condition / age +2.5/5.0
- Schools +2.0/10.0
- Appreciation +0.0/10.0
$129,900
🖨 Deal sheet 📄 Offer letter ✓ Due diligence
Listing remarks MLS
You will be impressed with the size of the master bedroom! This remarkable updated 4 bedroom 1.75 bath home also features an enclosed Florida room with hot tub off the master bedroom. Additional features include an updated kitchen with granite counters and the backsplash with nice appliances, new carpet, large one car garage with AGDO, and more. Over 1600 sq ft of nicely arranged living space.
Key facts
- Stylish backsplash
- Split floor plan
- Large walk-in closet
Tags
Property features AI
Finance
- Other: Directions: On 39th St. Turn N on Lincoln Ave; Listing status active; previously had a price decrease; Living area reported as 1,610 (assessor)
- Financial info: Loan qualification allowed; Not assumable
- HOA & community: No mandatory association dues
Exterior
- Parking: 1-car garage
- Home design: Single family residence; Residential property; One-story; Existing property; Located in Rolling Meadows addition; Homestead eligible
- Construction: Built with other/unspecified construction materials; Composition roof
- Exterior features: No notable exterior features listed; Lot described as 'Other'
Interior
- Bedrooms: 4 bedrooms (all on one level)
- Bathrooms: 2 full bathrooms
- Interior features: One living area; No fireplace; Combination foundation
Neighborhood map
What this means for you Summary
Snapshot
- This is a 3-bed/2.0-bath single-family listed at $130k.
Deal economics
- At list price, monthly cash flow is $133 ($2k/yr) — positive.
- The deal already cash-flows at list — no discount required.
- To meet the 1% rule (rent ≥ 1% of price), the offer needs to be $126k (3.1% below list).
- Recommended offer: $114k (12.0% below list) — sets the bar for market timing.
- Cap rate 7.5% vs local median 6.1% in Lawton — meaningfully above typical; check what's discounted (condition, days-on-market, listing class) to confirm the premium yield is real.
Location & tenants
- Location reads 63/100 on livability (#206 in OK) — a middle-class / working-renter tenant base. Strengths: cost of living A+, housing A+; Watch: employment D, crime F, commute F.
- Lawton (urban): math 20% / reading 26% proficiency, ranked #137 of 270 in OK (top 51%) — low school quality limits family demand, transient renter base, plan for 1-2y turnover.
- Zoned schools: Eisenhower Es (math 32% / reading 27%, grade F, #255 of 845 statewide, top 35%, 380 students, 0% FRL); Eisenhower Hs (math 19% / reading 29%, grade F, #215 of 447 statewide, top 48%, 1,350 students, 0% FRL) — zoned schools average 0% FRL vs 54% district-wide (54 pts lower); this property's tenant base skews higher-income than the district average.
- Market conditions: Rents rising fast (+5.1%/yr); 398 active listings in the ZIP; 133 units permitted in Comanche County in 2024 (0 in 5+ unit buildings).
Forward outlook
- Local home prices are declining (-3.0%/yr); year-one equity from $898 of loan paydown is wiped out by about $4k of value loss. Plan a longer hold.
- Comanche County population projected to shrink 3% by 2050 — rents likely to lag national; underwrite the cash flow, not the appreciation.
Negotiation context
- It's been on market 173 days — a 12% lower offer ($114k) is reasonable based on typical stale-listing flexibility.
- 3 sale attempts since 17y ago; this cycle's ask has dropped $35k (21%) from the opening price — seller is motivated, your offer sets the floor, not the list.
Risks & watch-outs
- Watch-outs: built in 1958 — expect roof / HVAC / electrical / plumbing capex.
- Climate carrying-cost: major wildfire risk; extreme-heat days projected 7→19/yr by 2055 (HVAC capex compounding) — expect insurance premiums to compound above CPI over the hold.
Questions for the listing agent
- It's been on market 173 days. Have you received any prior offers? Is the seller open to a 12% concession, seller financing, or rate buy-down credit?
- Built in 1958 — when were the roof, HVAC, electrical panel, plumbing, and water heater last replaced?
- Why hasn't it sold? Are there any deal-killer items the seller is aware of (foundation, flood, title, zoning, code violations)?
- Is there a deadline driving the sale (1031 exchange, divorce, estate, relocation)? That informs how much negotiation room exists.
- Schools are D-rated, which usually means shorter tenancies and higher turnover. Who's the typical renter profile here, and what's been the actual vacancy rate?
- Crime grade is F in this area — have there been break-ins, vandalism, or insurance claims at this property in the last 3 years? What carrier currently insures it and at what premium?
- What's the average days-on-market for RENTAL listings here right now (not sales)? A rising rental-DOM trend means longer vacancies and softer asking-rent achievability than the comps imply.
- What's the recent tenant-quality profile in this submarket — average credit score on applications, eviction rate, late-payment / NSF rate, and stable-employment percentage? A property-management company in the area should have these aggregated.
- How much new for-sale + rental construction is in the pipeline within 1–3 miles? Heavy new supply typically softens prices + rents 12–24 months out; constrained supply supports both.
Investment metrics
- 1% rule
- 0.97% ✗
- Cap rate
- 7.52%
- Cash-on-cash
- 4.39%
- DSCR
- 1.20
- GRM
- 8.6
CMA / ARV
- ARV (on-the-fly)
- $170,660
- Comps found
- 12
Show comp detail 12 sales within ~0.75 mi
| Address | Dist | Beds/Ba | Sqft | Sold | Price | $/sf | Match |
|---|---|---|---|---|---|---|---|
| 2306 NW 41st St | 0.18mi | 3/2.0 | 1,700 (+6%) | 2mo | $139,900 | $82 | 81 |
| 3909 NW Denver Ave | 0.32mi | 4/1.5 (+1) | 1,600 (-1%) | 1mo | $165,000 | $103 | 76 |
| 1620 NW 38th St | 0.42mi | 4/2.0 (+1) | 1,600 (-1%) | 3mo | $100,000 | $63 | 72 |
| 4825 NW Hoover Ave | 0.52mi | 3/2.0 | 1,700 (+6%) | 2mo | $180,000 | $106 | 65 |
| 4601 NW Ridgecrest Dr | 0.29mi | 3/2.0 | 1,800 (+12%) | 3mo | $195,000 | $108 | 64 |
| 4508 NW Denver Ave | 0.18mi | 4/2.0 (+1) | 1,400 (-13%) | 3mo | $155,000 | $111 | 63 |
| 4636 NW Lincoln Ave | 0.40mi | 3/2.0 | 1,800 (+12%) | 3mo | $140,500 | $78 | 59 |
| 3319 NW Atlanta Ave | 0.73mi | 3/2.0 | 1,680 (+4%) | 1mo | $180,000 | $107 | 58 |
| 2429 NW 28th St | 0.73mi | 4/2.0 (+1) | 1,600 (-1%) | 3mo | $165,000 | $103 | 58 |
| 4423 NW Wolf Creek Blvd | 0.73mi | 3/2.0 | 1,500 (-7%) | 2mo | $216,500 | $144 | 53 |
| 4313 NW Pollard Ave | 0.35mi | 4/1.0 (+1) | 1,400 (-13%) | 1mo | $76,000 | $54 | 52 |
| 1709 NW 50th St | 0.47mi | 3/1.5 | 1,400 (-13%) | 5mo | $174,900 | $125 | 50 |
Match score weights: distance 35% · size 25% · config 20% · recency 20%. Top-matched comps best support the ARV.
Projected returns pro-forma
-3.0% appreciation · 5.14% rent growth · sell at horizon
- IRR
- -7.1%
- Equity multiple
- 0.73×
- Total profit
- $-9,809
- Equity at exit
- $19,369
- IRR
- 4.9%
- Equity multiple
- 1.39×
- Total profit
- $14,230
- Equity at exit
- $11,231
Cash invested: $36,372 (down + closing). Projections, not guarantees.
Landlord ↔ Tenant lean methodology
- Overall (STATE)
- 83 Strongly Landlord-Friendly
- State Oklahoma
- 83 Strongly Landlord-Friendly · R+20
- County
- — inherits STATE
- City
- — inherits STATE
ZIP-level market 73505
- Rents YoY
- 5.1%
- Active inventory
- 398
- Price-to-rent
- 8.6×
Monthly cashflow live
- Estimated rent
- $1,259 medium interval (Pro) →
- Mortgage (P&I)
- −$681
- Tax from tax record
- −$126 /mo · $1,516/yr
- Insurance
- −$54
- HOA
- −$0
- Vacancy / Maint / Mgmt
- −$264
- Net cashflow
- $133
Break-even live
UW: 25.0% down · 7.5% · 30yr · 1.5% tax · 5.0% vac · 8.0% maint · 8.0% mgmt
Financing live
Cash to close
- Down payment
- $32,475
- Closing costs
- $3,897
- Reserves months
- —
- Total cash needed
- —
Loan-product check · same deal, 3 products live
Conventional
25% down · 7.5% · 30yr
- Down + closing
- —
- Monthly P&I
- —
- Monthly cashflow
- —
- DSCR
- —
- Eligible?
- —
Personal DTI + credit; lowest rate.
DSCR
20% down · 8.5% · 30yr
- Down + closing
- —
- Monthly P&I
- —
- Monthly cashflow
- —
- DSCR
- —
- Eligible?
- —
No personal income docs; deal must DSCR.
Hard money
10% down · 12.0% · 12mo
- Down + closing
- —
- Monthly P&I
- —
- Monthly cashflow
- —
- DSCR
- —
- Eligible?
- —
Short-term bridge; refi at stabilization.
Listing history 12 events
-
2026-05-31days on market $129,900 Active 173 DOM
-
2026-05-30days on market $129,900 Active 172 DOM
-
2026-04-09price $129,900
-
2026-03-26price $159,000
-
2025-12-07$165,000 Active
-
2022-04-29soldstatus $122,000
-
2022-04-27soldstatus $122,000 396-char remark
Show marketing remark (396 chars)
You will be impressed with the size of the master bedroom! This remarkable updated 4 bedroom 1.75 bath home also features an enclosed Florida room with hot tub off the master bedroom. Additional features include an updated kitchen with granite counters and the backsplash with nice appliances, new carpet, large one car garage with AGDO, and more. Over 1600 sq ft of nicely arranged living space.
-
2022-03-01$119,900 396-char remark
Show marketing remark (396 chars)
You will be impressed with the size of the master bedroom! This remarkable updated 4 bedroom 1.75 bath home also features an enclosed Florida room with hot tub off the master bedroom. Additional features include an updated kitchen with granite counters and the backsplash with nice appliances, new carpet, large one car garage with AGDO, and more. Over 1600 sq ft of nicely arranged living space.
-
2009-11-20soldstatus $119,000
-
2009-11-20soldstatus $119,000
-
2009-07-25$119,000
-
1998-09-08soldstatus $66,000
ⓘ Source: listings_history table (triggers on properties + properties_extension) + one-shot
backfill from property_details.listing_events for pre-trigger history.
Tax reassessment forecast OK · Resets to sale price
- Current annual tax
- $1,516 · $126/mo
- Projected year-2 tax
- $1,516 · $126/mo
- Expected delta
- $0/yr ($0/mo · 0.0%)
ⓘ Screening estimate from a state-policy table — verify with the county assessor before closing.
Climate risk First Street
- Flood 1/10 Low FEMA zone X (unshaded) · 0% chance over 30 yrs
- Wildfire 6/10 Major
- Heat 6/10 Major 7 d/yr ≥109°F today · 19 d/yr by 30 yrs out
- Wind 2/10 Low 5% chance of damaging wind over 30 yrs
- Air quality 1/10 Low 0 unhealthy d/yr today · 0 by 30 yrs out
Nearby sold comps map
Loading sold comps map…
Walkable amenities ~0.75 mi
Loading nearby amenities…
Taxation est. · year 1
- Rental income
- $15,110
- − Mortgage interest
- −$7,276
- − Property taxes
- −$1,516
- − Insurance
- −$650
- − Repairs & maintenance
- −$1,209
- − Management
- −$1,209
- − Depreciation
- −$3,779
- Taxable loss
- −$529
- Est. tax savings @ 24.0%
- +$127
- After-tax cash flow
- $1,724/yr
For passive investors: Depreciation is non-cash, so a rental often shows a tax loss while cash-flowing — sheltering income. Rental losses are passive: they offset passive income freely, and up to $25,000/yr can offset ordinary (W-2) income if you actively participate and your MAGI is under $100k (phasing out to $0 by $150k); unused losses carry forward. On sale, claimed depreciation is recaptured at up to 25%, and gains may owe capital-gains tax (a 1031 exchange can defer both). Figures are a year-1 estimate at your 24.0% rate — not tax advice; consult a CPA.
Schools (NCES district)
- District
- Lawton
- NCES district ID
- 4017250
- Math proficiency
- 20% ▼ -12.00%
- Reading proficiency
- 26% ▼ -9.00%
- Median HH income
- $42,618
- Composite
- 19.68/100
- National rank
- #8732
- State rank
- #137 of 270 in OK
Livability — Lawton
- Score
- 63/100
- State rank
- #206
- US rank
- #15131
Category grades
Schools grade is shown separately in the Schools card above.
Census & demographics
- Census place
- Lawton, OK
- County
- Comanche County · 96,361 people
- City population
- 89,233
- Metro
- Lawton, OK
- Population (ZIP)
- 47,790
- Household income
- $58,272
- Rent vs Own
- Severe rent burden
- 1986.0
Population outlook (Comanche County) Hauer SSP2
- Today (2025)
- 124,518 people
- By 2030
- 124,231 · -0.2%
- By 2040
- 122,193 · -1.9%
- By 2050
- 120,368 · -3.3%
- By 2075
- 120,492 · -3.2%
- By 2100
- 123,113 · -1.1%
Race, ethnicity, and origin ACS 2023
- Neighborhood character
- Diverse neighborhood (Simpson 0.70)
- Race & ethnicity
- White 50% Black 17% Two or more races 16% Hispanic / Latino 16% Native American 4% Asian 3%
- Hispanic origin (detail)
- Mexican 11% Puerto Rican 2%
- Common ancestry
- Lithuanian 2% Slovak 2% Romanian 1%
- Foreign-born
- 6% · Canada, South Korea
- Languages at home
- 88% English-only · Spanish 6% German/W. Germanic 2% Korean 1%
Political lean MEDSL · Comanche
- 2024 margin
- Strong R (+23.3) · D 37.4% · R 60.7% · Other 1.9%
- 2008→2024 swing
- -5.8pp toward R · 2008: -17.5pp · 2024: -23.3pp
- All cycles
- 2024: R+23.3 2020: R+20.1 2016: R+23.7 2012: R+17.0 2008: R+17.5
Not yet ingested
- Civics
- —
Market trends
- HPI YoY
- ▼ -134.88%
- Current HPI
- 169.4524
- Rent YoY
- ▲ 5.14%
- Metro
- Lawton, OK
- State GDP YoY
- ▲ 1.55%
- F500 in state
- 6
Industry mix (Fortune 500 HQ in OK)
| Industry | F500 HQs | Revenue |
|---|---|---|
| Energy | 3 | $48B |
|
||
Price history
+96.8% since first listed10 events — show timeline
- 2026-04-09 Price Changed $129,900 MLSOK
- 2026-03-26 Price Changed $159,000 MLSOK
- 2025-12-07 Listed $165,000 MLSOK
- 2022-04-29 Sold (Public Records) $122,000 Public Records
- 2022-04-27 Sold (MLS) $122,000 LBRMLS
- 2022-03-01 Listed $119,900 LBRMLS
- 2009-11-20 Sold (Public Records) $119,000 Public Records
- 2009-11-20 Sold (MLS) $119,000 LBRMLS
- 2009-07-25 Listed $119,000 LBRMLS
- 1998-09-08 Sold (Public Records) $66,000 Public Records
Property tax history
+3.6%/yrLatest (2025): $1,516 · +2.5% YoY. Source: county tax records.
Cash-flow waterfall
monthlySold comps — $/sqft
last 12 mo · ≤1 miLoading sold comps…