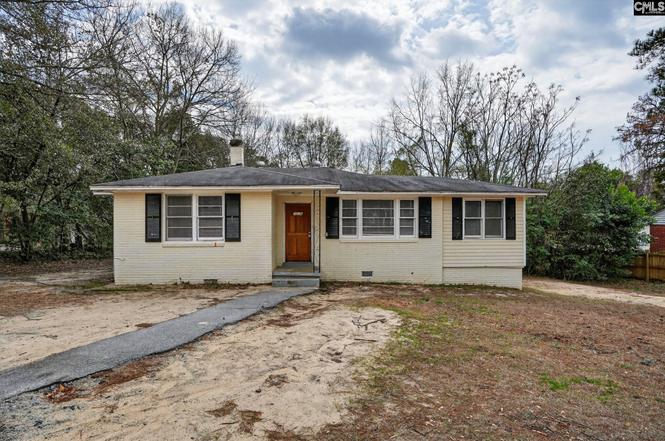
7216 Clifford Dr · Dentsville, SC
Flood risk 4/10 · Minor
- FEMA flood zone
- X (unshaded)
- Chance of flooding over 30 yrs
- 0.22%
- Est. flood insurance / yr
- $507 – $1,088
Fire risk 1/10 · Minimal
- Est. fire insurance / yr
- $783 – $1,453
Heat risk 6/10 · Moderate
- Hot days now (above 108°F)
- 7 days/yr
- Hot days in 30 yrs
- 15 days/yr
Wind risk 6/10 · Moderate
- Chance of severe wind over 30 yrs
- 68.0%
Air-quality risk 3/10 · Minor
- Unhealthy air days now
- 2 days/yr
- Unhealthy air days in 30 yrs
- 2 days/yr
Risk factors via First Street. Map © Google.
Why this score? — see what drove the C- grade
The composite is a weighted blend of 9 inputs, each scored 0–100. Each bar is that input's sub-score; the figure is the points it added to the 100-point composite (weight × sub-score).
- Cash flow +21.3/30.0
- ARV discount +7.5/15.0
- DSCR +6.8/10.0
- 1% rule +5.9/10.0
- Schools +3.6/10.0
- Livability +3.6/5.0
- Rent growth +2.6/5.0
- Condition / age +2.5/5.0
- Appreciation +0.0/10.0
$134,900
🖨 Deal sheet 📄 Offer letter ✓ Due diligence
Listing remarks
Discover this charming 1201 sq. ft. ranch-style residence situated on an impressive 0.57-acre level lot in the established Northeast Columbia area. Built in 1960, this well-maintained 3-bedroom, 1.5-bathroom home features a classic floorplan highlighted by beautiful hardwood flooring throughout the main living areas and corridors. All three bedrooms give the comfort of plush carpeting, providing a cozy retreat for residents. The primary bedroom suite has a convenient half bath. The interior layout includes an inviting living space that flows into a functional kitchen and dining area, perfectly suited for modern living. Outside, the expansive backyard provides ample space for gardening, recr
Key facts
- Hardwood flooring
- Level lot
- Expansive backyard
Tags
Property features AI
Exterior
- Utilities: Public sewer; Public water
- Home design: Single-story home
- Construction: Slab foundation; Exterior finish: Other
- Exterior features: Covered front porch; Paved road access; Public water
Interior
- Kitchen: Hardwood floor; Formica countertops; Self-cleaning range
- Bedrooms: Master bedroom on main level with carpeted floors; Two additional carpeted bedrooms on main level
- Flooring: Carpet in bedrooms; Hardwood in living room and kitchen
- Bathrooms: One full bathroom; One half bathroom
- Heating & cooling: Central cooling; Central heating with gas on first level
- Interior features: Self-cleaning range; Hardwood floors in living room; Hardwood floor and Formica countertops in kitchen
Neighborhood map
What this means for you Summary
Snapshot
- This is a 2-bed/1.0-bath single-family listed at $135k.
Deal economics
- At list price, monthly cash flow is $198 ($2k/yr) — positive.
- The deal already cash-flows at list — no discount required.
- Meets the 1% rule at list price ($1k rent vs $135k).
- Recommended offer: $123k (9.0% below list) — sets the bar for market timing.
Location & tenants
- Location reads 71/100 on livability (#50 in SC) — a middle-class / working-renter tenant base. Strengths: cost of living A+, health & safety A+, housing A; Watch: amenities D+, crime F, commute F.
- Richland 02 (suburban): math 35% / reading 47% proficiency, ranked #29 of 80 in SC (top 36%) — families likely to look elsewhere, expect single-tenant / working-renter base with shorter leases.
- Zoned schools: Joseph Keels Elementary (math 27% / reading 26%, grade F, #435 of 597 statewide, top 73%, 438 students, 100% FRL) — zoned schools average 100% FRL vs 38% district-wide (62 pts higher); higher-poverty schools than district average — tighter screening recommended.
- Zoned-school proficiency averages 26% at this address vs 41% district-wide (-14 pts) — the specific schools serving this property underperform the Richland 02 average; the district grade overstates school quality for this exact location.
- Market conditions: Rents flat; 341 active listings in the ZIP; 7 comparable units currently listed for rent nearby; rentals at typical pace (median 24d on market — plan ~3-4 weeks tenant-placement turnaround); 3,472 units permitted in Richland County in 2024 (1,096 in 5+ unit buildings).
Forward outlook
- Local home prices are declining (-3.0%/yr); year-one equity from $933 of loan paydown is wiped out by about $4k of value loss. Plan a longer hold.
- Richland County population projected at +30% by 2050 — long-run rental-demand tailwind backs the buy-and-hold thesis.
Negotiation context
- It's been on market 94 days — a 9% lower offer ($123k) is reasonable based on typical stale-listing flexibility.
- Current owner paid $74k; list at $135k implies a 82% gain — meaningful room to come down on a strong offer.
Risks & watch-outs
- Climate carrying-cost: major wind risk, 68% chance of damaging wind over 30y; extreme-heat days projected 7→15/yr by 2055 (HVAC capex compounding) — expect insurance premiums to compound above CPI over the hold.
Questions for the listing agent
- It's been on market 94 days. Have you received any prior offers? Is the seller open to a 9% concession, seller financing, or rate buy-down credit?
- Built in 1960 — when were the roof, HVAC, electrical panel, plumbing, and water heater last replaced?
- Why hasn't it sold? Are there any deal-killer items the seller is aware of (foundation, flood, title, zoning, code violations)?
- Is there a deadline driving the sale (1031 exchange, divorce, estate, relocation)? That informs how much negotiation room exists.
- Schools are D-rated, which usually means shorter tenancies and higher turnover. Who's the typical renter profile here, and what's been the actual vacancy rate?
- Crime grade is F in this area — have there been break-ins, vandalism, or insurance claims at this property in the last 3 years? What carrier currently insures it and at what premium?
- What's the average days-on-market for RENTAL listings here right now (not sales)? A rising rental-DOM trend means longer vacancies and softer asking-rent achievability than the comps imply.
- What's the recent tenant-quality profile in this submarket — average credit score on applications, eviction rate, late-payment / NSF rate, and stable-employment percentage? A property-management company in the area should have these aggregated.
- How much new for-sale + rental construction is in the pipeline within 1–3 miles? Heavy new supply typically softens prices + rents 12–24 months out; constrained supply supports both.
Investment metrics
- 1% rule
- 1.09% ✓
- Cap rate
- 8.05%
- Cash-on-cash
- 6.29%
- DSCR
- 1.28
- GRM
- 7.6
CMA / ARV
No comps found within radius.
Projected returns pro-forma
-3.0% appreciation · 0.21% rent growth · sell at horizon
- IRR
- -9.9%
- Equity multiple
- 0.65×
- Total profit
- $-13,240
- Equity at exit
- $20,114
- IRR
- -5.0%
- Equity multiple
- 0.71×
- Total profit
- $-10,766
- Equity at exit
- $11,664
Cash invested: $37,772 (down + closing). Projections, not guarantees.
Landlord ↔ Tenant lean methodology
- Overall (STATE)
- 90 Strongly Landlord-Friendly
- State South Carolina
- 90 Strongly Landlord-Friendly · R+6
- County
- — inherits STATE
- City
- — inherits STATE
ZIP-level market 29223
- Rents YoY
- 0.2%
- Active inventory
- 341
- Price-to-rent
- 7.6×
Monthly cashflow live
- Estimated rent
- $1,477 high interval (Pro) →
- Mortgage (P&I)
- −$707
- Tax from tax record
- −$205 /mo · $2,464/yr
- Insurance
- −$56
- HOA
- −$0
- Vacancy / Maint / Mgmt
- −$310
- Net cashflow
- $198
Break-even live
UW: 25.0% down · 7.5% · 30yr · 1.5% tax · 5.0% vac · 8.0% maint · 8.0% mgmt
Financing live
Cash to close
- Down payment
- $33,725
- Closing costs
- $4,047
- Reserves months
- —
- Total cash needed
- —
Loan-product check · same deal, 3 products live
Conventional
25% down · 7.5% · 30yr
- Down + closing
- —
- Monthly P&I
- —
- Monthly cashflow
- —
- DSCR
- —
- Eligible?
- —
Personal DTI + credit; lowest rate.
DSCR
20% down · 8.5% · 30yr
- Down + closing
- —
- Monthly P&I
- —
- Monthly cashflow
- —
- DSCR
- —
- Eligible?
- —
No personal income docs; deal must DSCR.
Hard money
10% down · 12.0% · 12mo
- Down + closing
- —
- Monthly P&I
- —
- Monthly cashflow
- —
- DSCR
- —
- Eligible?
- —
Short-term bridge; refi at stabilization.
Rent comps 7 comps
| Address | Beds | Baths | Sqft | Rent | $/sqft | DOM | Units | Dist |
|---|---|---|---|---|---|---|---|---|
| 6837 N Trenholm Rd Columbia, SC | 1.0–3.0 | 1.0–2.0 | 1105 | $1,662 | $1.50 | 3d | 30 | 0.62mi |
| 201 Redwood Ct Columbia, SC | 3.0 | 1.5 | 1050 | $1,300 | $1.24 | 14d | 1 | 0.77mi |
| 250 Springtree Dr Columbia, SC | 1.0–2.0 | 1.0 | 839 | $1,090 | $1.30 | 3d | 8 | 0.83mi |
| 320 Charwood Dr Columbia, SC | 3.0 | 2.0 | 1325 | $1,750 | $1.32 | 23d | 1 | 0.88mi |
| 6905 Cleaton Rd Columbia, SC | 3.0 | 2.5–3.0 | 1546 | $1,925 | $1.25 | 23d | 3 | 0.98mi |
| 7400 Hunt Club Rd Columbia, SC | 1.0–3.0 | 1.0–2.0 | 1087 | $1,040 | $0.96 | 23d | 1 | 1.31mi |
| 5437 Ransom Dr Columbia, SC | 3.0 | 1.0 | 1056 | $1,531 | $1.45 | 23d | 1 | 1.32mi |
Listing history 15 events
-
2026-06-07statusdays on market $134,900 Pending 94 DOM
-
2026-06-05days on market $134,900 Active - Contingent 93 DOM
-
2026-06-03days on market $134,900 Active - Contingent 92 DOM
-
2026-06-03days on market $134,900 Active - Contingent 91 DOM
-
2026-06-01days on market $134,900 Active - Contingent 90 DOM
-
2026-05-31days on market $134,900 Active - Contingent 89 DOM
-
2026-05-22historical Active - Contingent
-
2026-05-13price $134,900
-
2026-04-19price $139,900
-
2026-04-12price $144,900
-
2026-03-03$149,900 Active
-
2021-11-30soldstatus $74,000
-
1998-04-14soldstatus $65,000
-
1998-01-21soldstatus $32,750
-
1980-05-01soldstatus $28,000
ⓘ Source: listings_history table (triggers on properties + properties_extension) + one-shot
backfill from property_details.listing_events for pre-trigger history.
Tax reassessment forecast SC · Resets to sale price
- Current annual tax
- $2,464 · $205/mo
- Projected year-2 tax
- $2,464 · $205/mo
- Expected delta
- $0/yr ($0/mo · 0.0%)
ⓘ Screening estimate from a state-policy table — verify with the county assessor before closing.
Climate risk First Street
- Flood 4/10 Moderate FEMA zone X (unshaded) · 22% chance over 30 yrs
- Wildfire 1/10 Low
- Heat 6/10 Major 7 d/yr ≥108°F today · 15 d/yr by 30 yrs out
- Wind 6/10 Major 68% chance of damaging wind over 30 yrs
- Air quality 3/10 Moderate 2 unhealthy d/yr today · 2 by 30 yrs out
Nearby sold comps map
Loading sold comps map…
Walkable amenities ~0.75 mi
Loading nearby amenities…
Taxation est. · year 1
- Rental income
- $17,726
- − Mortgage interest
- −$7,556
- − Property taxes
- −$2,464
- − Insurance
- −$674
- − Repairs & maintenance
- −$1,418
- − Management
- −$1,418
- − Depreciation
- −$3,924
- Taxable income
- $270
- Est. tax owed @ 24.0%
- −$65
- After-tax cash flow
- $2,311/yr
For passive investors: Depreciation is non-cash, so a rental often shows a tax loss while cash-flowing — sheltering income. Rental losses are passive: they offset passive income freely, and up to $25,000/yr can offset ordinary (W-2) income if you actively participate and your MAGI is under $100k (phasing out to $0 by $150k); unused losses carry forward. On sale, claimed depreciation is recaptured at up to 25%, and gains may owe capital-gains tax (a 1031 exchange can defer both). Figures are a year-1 estimate at your 24.0% rate — not tax advice; consult a CPA.
Schools (NCES district)
- District
- Richland 02
- NCES district ID
- 4503390
- Math proficiency
- 35% ▼ -15.00%
- Reading proficiency
- 47% ▼ -5.00%
- Median HH income
- $59,684
- Composite
- 36.2/100
- National rank
- #4730
- State rank
- #29 of 80 in SC
Livability — Dentsville
- Score
- 71/100
- State rank
- #50
- US rank
- #6940
Category grades
Schools grade is shown separately in the Schools card above.
Census & demographics
- Census place
- Dentsville, SC
- County
- Richland County · 389,530 people
- City population
- 335,994
- Metro
- Columbia, SC
- Population (ZIP)
- 53,074
- Household income
- $62,408
- Rent vs Own
- Severe rent burden
- 2857.0
Population outlook (Richland County) Hauer SSP2
- Today (2025)
- 459,667 people
- By 2030
- 487,524 · +6.1%
- By 2040
- 542,035 · +17.9%
- By 2050
- 595,371 · +29.5%
- By 2075
- 732,998 · +59.5%
- By 2100
- 820,415 · +78.5%
Race, ethnicity, and origin ACS 2023
- Neighborhood character
- Diverse neighborhood (Simpson 0.60)
- Race & ethnicity
- Black 57% White 23% Hispanic / Latino 11% Two or more races 6% Asian 4%
- Hispanic origin (detail)
- Mexican 5% Puerto Rican 2%
- Common ancestry
- Slovak 1% Serbian 1% Italian 1%
- Foreign-born
- 10% · Canada, South Korea
- Languages at home
- 86% English-only · Spanish 8% Other Indo-European 2% Korean 1%
Political lean MEDSL · Richland
- 2024 margin
- Solid D (+34.6) · D 66.4% · R 31.8% · Other 1.8%
- 2008→2024 swing
- +5.7pp toward D · 2008: 28.9pp · 2024: 34.6pp
- All cycles
- 2024: D+34.6 2020: D+38.3 2016: D+32.9 2012: D+33.3 2008: D+28.9
Not yet ingested
- Civics
- —
Market trends
- HPI YoY
- ▼ -135.96%
- Current HPI
- 195.3158
- Rent YoY
- ▲ 0.21%
- Metro
- Columbia, SC
- State GDP YoY
- ▲ 4.51%
- F500 in state
- 2
Industry mix (Fortune 500 HQ in SC)
| Industry | F500 HQs | Revenue |
|---|---|---|
| Packaging | 1 | $7B |
|
||
Price history
+381.8% since first listed9 events — show timeline
- 2026-05-22 Contingent — Consolidated MLS
- 2026-05-13 Price Changed $134,900 Consolidated MLS
- 2026-04-19 Price Changed $139,900 Consolidated MLS
- 2026-04-12 Price Changed $144,900 Consolidated MLS
- 2026-03-03 Listed $149,900 Consolidated MLS
- 2021-11-30 Sold (Public Records) $74,000 Public Records
- 1998-04-14 Sold (Public Records) $65,000 Public Records
- 1998-01-21 Sold (Public Records) $32,750 Public Records
- 1980-05-01 Sold (Public Records) $28,000 Public Records
Property tax history
+2.8%/yrLatest (2025): $2,464 · +2.4% YoY. Source: county tax records.
Cash-flow waterfall
monthlySold comps — $/sqft
last 12 mo · ≤1 miLoading sold comps…