 🏗️ New Construction
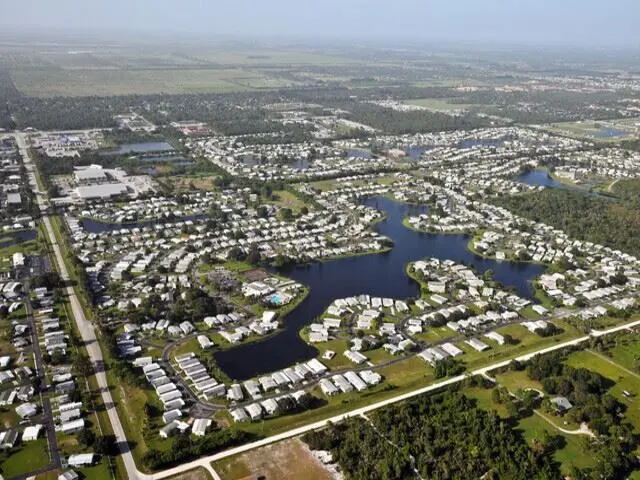
Raleigh - Limited Series Plan · West Vero Corridor, FL
Flood risk No data
- FEMA flood zone
- —
- Chance of flooding over 30 yrs
- —
- Est. flood insurance / yr
- —
Fire risk No data
- Est. fire insurance / yr
- —
Heat risk No data
- Hot days now (above threshold)
- —
- Hot days in 30 yrs
- —
Wind risk No data
- Chance of severe wind over 30 yrs
- —
Air-quality risk No data
- Unhealthy air days now
- —
- Unhealthy air days in 30 yrs
- —
Risk factors via First Street. Map © Google.
Why this score? — see what drove the D grade
The composite is a weighted blend of 9 inputs, each scored 0–100. Each bar is that input's sub-score; the figure is the points it added to the 100-point composite (weight × sub-score).
- Cash flow +15.0/30.0
- ARV discount +7.5/15.0
- 1% rule +5.0/10.0
- DSCR +5.0/10.0
- Schools +4.2/10.0
- Livability +3.7/5.0
- Rent growth +2.7/5.0
- Condition / age +1.0/5.0
- Appreciation +0.0/10.0
$164,900
🖨 Deal sheet (PDF) 📄 Offer letter ✓ Due diligence
Listing remarks
55+ age qualified community. COMING SOON! Currently under construction. Welcome to Heron Cay, a 55+ age-qualified active and vibrant community, where your dream home is becoming a reality. We are excited to offer an incredible brand new, beautiful, 2026 3 bed, 2 bath home for sale, featuring approximately 1356.16 sq ft of carefully designed living space. Located in lovely Vero Beach, this soon-to-be-completed property will offer the perfect blend of modern design and timeless comfort. Construction is underway, and soon you'll be able to step inside and experience bright an open-concept floor plan with high ceilings, emphasizing your new energy efficient tilt windows that provide so much nat
Key facts
- Large kitchen island
- Brand new home
- Listed 26 days
Tags
Property features AI
Finance
- Other: Living area approximately 1,356
- Financial info: List price $164,900
Exterior
- Home design: Single-story plan home
- Construction: Built in 2026
Interior
- Bedrooms: 3 bedrooms
- Bathrooms: 2 full bathrooms
- Interior features: Plan home from the Raleigh - Limited Series
Neighborhood map
What this means for you Summary
Snapshot
- This is a 3-bed/2.0-bath manufactured listed at $165k. Condition is rated poor.
Deal economics
- At list price, monthly cash flow is $1k ($15k/yr) — positive.
- The deal already cash-flows at list — no discount required.
- Meets the 1% rule at list price ($2k rent vs $165k).
- Recommended offer: $162k (1.5% below list) — sets the bar for market timing.
- Cap rate 38.9% vs local median 4.0% in West Vero Corridor — top-decile yield for the area; either an underpriced asset or a hidden risk that comps aren't pricing in. Stress-test before assuming the spread holds.
Location & tenants
- Location reads 74/100 on livability (#273 in FL, #4,421 nationally) — a middle-class / working-renter tenant base. Strengths: cost of living A+, housing A+, commute A; Watch: amenities F, health & safety D-.
- Indian River (other): math 48% / reading 52% proficiency, ranked #35 of 73 in FL (top 48%) — acceptable for families but not a draw, mixed tenant base, ~2y average lease.
- Zoned schools: Dodgertown Elementary School (math 27% / reading 32%, grade F, #1,896 of 2,144 statewide, top 90%, 485 students, 78% FRL); Storm Grove Middle School (math 54% / reading 55%, grade B-, #183 of 571 statewide, top 34%, 1,020 students, 50% FRL); Vero Beach High School (math 28% / reading 43%, grade F, #367 of 667 statewide, top 57%, 2,847 students, 50% FRL).
- Market conditions: Rents flat; 388 active listings in the ZIP; 11 comparable units currently listed for rent nearby; rentals at typical pace (median 23d on market — plan ~3-4 weeks tenant-placement turnaround); 564 units permitted in Indian River County in 2024 (281 in 5+ unit buildings).
- This rent runs 35% of the median local income ($67k/yr) — at the standard rent-burdened threshold; future hikes will face affordability resistance.
Forward outlook
- Local home prices are declining (-3.0%/yr); year-one equity from $317 of loan paydown is wiped out by about $1k of value loss. Plan a longer hold.
- Indian River County population projected at +18% by 2050 — long-run rental-demand tailwind backs the buy-and-hold thesis.
- At projected returns (-3.0% appreciation + 0.6% rent growth), your $13k cash investment doubles in ~1 year — after that, you're playing with house money.
Negotiation context
- It's been on market 26 days — a 2% lower offer ($162k) is reasonable based on typical stale-listing flexibility.
Questions for the listing agent
- Have any recent inspections been done? Can we get a copy of the seller's disclosures and any deferred-maintenance estimates?
- Is there a deadline driving the sale (1031 exchange, divorce, estate, relocation)? That informs how much negotiation room exists.
- Schools are F-rated, which usually means shorter tenancies and higher turnover. Who's the typical renter profile here, and what's been the actual vacancy rate?
- The area grade is low — what's the realistic commute time and amenity access for the typical tenant pool here? Any planned neighborhood developments (good or bad) we should know about?
- This sits on a lake — are riparian / water-frontage rights deeded with the parcel? Any dock permits, shoreline easements, or HOA water-use restrictions?
- What's the documented flood / surge / shoreline-erosion history here (FEMA AND non-FEMA — e.g., storm surge, creek backup, septic-field saturation)?
- Any water-quality or seasonal algae-bloom issues that affect tenant satisfaction or short-term-rental demand?
- What's the average days-on-market for RENTAL listings here right now (not sales)? A rising rental-DOM trend means longer vacancies and softer asking-rent achievability than the comps imply.
- What's the recent tenant-quality profile in this submarket — average credit score on applications, eviction rate, late-payment / NSF rate, and stable-employment percentage? A property-management company in the area should have these aggregated.
- How much new for-sale + rental construction is in the pipeline within 1–3 miles? Heavy new supply typically softens prices + rents 12–24 months out; constrained supply supports both.
Investment metrics
- 1% rule
- 4.31% ✓
- Cap rate
- 38.86%
- Cash-on-cash
- 116.29%
- DSCR
- 6.17
- GRM
- 1.9
CMA / ARV
- ARV (on-the-fly)
- $45,765
- Comps found
- 2
Show comp detail 2 sales within ~0.75 mi
| Address | Dist | Beds/Ba | Sqft | Sold | Price | $/sf | Match |
|---|---|---|---|---|---|---|---|
| 911 Courier St | 0.45mi | 2/2.0 (-1) | 1,300 (-4%) | 22mo | $33,000 | $25 | 49 |
| 337 Heritage Blvd | 0.58mi | 2/2.0 (-1) | 1,300 (-4%) | 21mo | $14,000 | $11 | 44 |
Match score weights: distance 35% · size 25% · config 20% · recency 20%. Top-matched comps best support the ARV.
Projected returns pro-forma
-3.0% appreciation · 0.6% rent growth · sell at horizon
- IRR
- —
- Equity multiple
- 6.23×
- Total profit
- $67,056
- Equity at exit
- $6,824
- IRR
- —
- Equity multiple
- 12.09×
- Total profit
- $142,168
- Equity at exit
- $3,957
Cash invested: $12,814 (down + closing). Projections, not guarantees.
Landlord ↔ Tenant lean methodology
- Overall (STATE)
- 87 Strongly Landlord-Friendly
- State Florida
- 87 Strongly Landlord-Friendly · R+3
- County
- — inherits STATE
- City
- — inherits STATE
ZIP-level market 32966
- Home prices YoY
- -26.7%
- Rents YoY
- 0.6%
- Active inventory
- 388
- Price-to-rent
- 7.0×
Monthly cashflow live
- Estimated rent
- $1,972 high interval (Pro) →
- Mortgage (P&I)
- −$240
- Tax est. 1.5%
- −$57 /mo · $686/yr
- Insurance
- −$19
- HOA
- −$0
- Vacancy / Maint / Mgmt
- −$414
- Net cashflow
- $1,242
Break-even live
Sensitivity live
| Price | -10% $1,273 | -5% $1,258 | +0% $1,242 | +5% $1,226 | +10% $1,210 |
|---|---|---|---|---|---|
| Rent | -10% $1,086 | -5% $1,164 | +0% $1,242 | +5% $1,320 | +10% $1,398 |
| Rate | -1.0pp $1,265 | -0.5pp $1,253 | base $1,242 | +0.5pp $1,230 | +1.0pp $1,218 |
UW: 25.0% down · 7.5% · 30yr · 1.5% tax · 5.0% vac · 8.0% maint · 8.0% mgmt
Financing live
Cash to close
- Down payment
- $11,441
- Closing costs
- $1,373
- Reserves months
- —
- Total cash needed
- —
Loan-product check · same deal, 3 products live
Conventional
25% down · 7.5% · 30yr
- Down + closing
- —
- Monthly P&I
- —
- Monthly cashflow
- —
- DSCR
- —
- Eligible?
- —
Personal DTI + credit; lowest rate.
DSCR
20% down · 8.5% · 30yr
- Down + closing
- —
- Monthly P&I
- —
- Monthly cashflow
- —
- DSCR
- —
- Eligible?
- —
No personal income docs; deal must DSCR.
Hard money
10% down · 12.0% · 12mo
- Down + closing
- —
- Monthly P&I
- —
- Monthly cashflow
- —
- DSCR
- —
- Eligible?
- —
Short-term bridge; refi at stabilization.
Rent comps 11 comps
| Address | Beds | Baths | Sqft | Rent | $/sqft | DOM | Units | Dist |
|---|---|---|---|---|---|---|---|---|
| 589 Johnathans Cay Vero Beach, FL | 3.0 | 2.0 | 1409 | $1,799 | $1.28 | 15d | 1 | 0.21mi |
| 8775 20th St #925 Vero Beach, FL | 3.0 | 2.0 | 1356 | $1,799 | $1.33 | 23d | 1 | 0.55mi |
| 8775 20th St #909 Vero Beach, FL | 2.0 | 2.0 | 1000 | $1,799 | $1.80 | 23d | 1 | 0.55mi |
| 8775 20th St #59 Vero Beach, FL | 2.0 | 2.0 | 1147 | $1,699 | $1.48 | 23d | 1 | 0.55mi |
| 344 Heritage Blvd Vero Beach, FL | 2.0 | 2.0 | 1000 | $1,499 | $1.50 | 23d | 1 | 0.57mi |
| 174 Congress St Vero Beach, FL | 2.0 | 2.0 | 1200 | $1,700 | $1.42 | 23d | 1 | 0.59mi |
| 2240 86th Dr Vero Beach, FL | 2.0 | 2.0 | 951 | $1,875 | $1.97 | 23d | 1 | 1.10mi |
| 8415 22nd St Vero Beach, FL | 2.0 | 2.0 | 1100 | $2,000 | $1.82 | 15d | 1 | 1.13mi |
| 1930 Westhampton Ct Vero Beach, FL | 2.0 | 2.0 | 1531 | $1,950 | $1.27 | 23d | 1 | 1.15mi |
| 2365 89th Dr Vero Beach, FL | 2.0 | 2.0 | 1182 | $1,700 | $1.44 | 23d | 1 | 1.16mi |
| 1625 Pointe West Way Vero Beach, FL | 3.0 | 2.5 | 1600 | $2,000 | $1.25 | 23d | 1 | 1.22mi |
Listing history 17 events
-
2026-06-22days on market $164,900 Active 26 DOM
-
2026-06-19days on market $164,900 Active 24 DOM
-
2026-06-18days on market $164,900 Active 23 DOM
-
2026-06-17days on market $164,900 Active 22 DOM
-
2026-06-16days on market $164,900 Active 21 DOM
-
2026-06-15days on market $164,900 Active 20 DOM
-
2026-06-14days on market $164,900 Active 18 DOM
-
2026-06-13days on market $164,900 Active 17 DOM
-
2026-06-10days on market $164,900 Active 15 DOM
-
2026-06-09days on market $164,900 Active 14 DOM
-
2026-06-08days on market $164,900 Active 13 DOM
-
2026-06-07days on market $164,900 Active 12 DOM
-
2026-06-05days on market $164,900 Active 9 DOM
-
2026-06-02days on market $164,900 Active 7 DOM
-
2026-06-01days on market $164,900 Active 6 DOM
-
2026-05-31days on market $164,900 Active 5 DOM
-
2026-05-30days on market $164,900 Active 4 DOM
ⓘ Source: listings_history table (triggers on properties + properties_extension) + one-shot
backfill from property_details.listing_events for pre-trigger history.
Nearby sold comps map
Loading sold comps map…
Walkable amenities ~0.75 mi
Loading nearby amenities…
Taxation est. · year 1
- Rental income
- $23,668
- − Mortgage interest
- −$2,564
- − Property taxes
- −$686
- − Insurance
- −$229
- − Repairs & maintenance
- −$1,893
- − Management
- −$1,893
- − Depreciation
- −$1,331
- Taxable income
- $15,071
- Est. tax owed @ 24.0%
- −$3,617
- After-tax cash flow
- $11,285/yr
For passive investors: Depreciation is non-cash, so a rental often shows a tax loss while cash-flowing — sheltering income. Rental losses are passive: they offset passive income freely, and up to $25,000/yr can offset ordinary (W-2) income if you actively participate and your MAGI is under $100k (phasing out to $0 by $150k); unused losses carry forward. On sale, claimed depreciation is recaptured at up to 25%, and gains may owe capital-gains tax (a 1031 exchange can defer both). Figures are a year-1 estimate at your 24.0% rate — not tax advice; consult a CPA.
Condition & rehab AI · 6 photos
This property is under construction and requires extensive repairs and updates to be move-in ready. Significant improvements in landscaping, HVAC, interior, and windows are needed to increase its value.
Repairs flagged
- Major Foundation — No foundation photo
- Major Roof — No roof photo
- Major Exterior — No exterior photo
- Major Interior walls/paint — No interior walls/paint photo
- Major Windows — No windows photo
- Major HVAC/mechanicals — No HVAC/mechanicals photo
- Major Landscaping — No landscaping/curb appeal photo
Value-add opportunities
- Both Landscaping and curb appeal — Improving the curb appeal can increase both resale and rental value
- Both HVAC and mechanicals — Upgrading HVAC and mechanicals can improve comfort and energy efficiency, enhancing both resale and rental value
- Both Interior walls and paint — Fresh paint and updated interior can make the home more appealing to buyers and renters
- Both Windows — New windows can improve energy efficiency and curb appeal, increasing both resale and rental value
Renovation cost estimate screening
| Repair item | Severity | Est. cost |
|---|---|---|
| Foundation · No foundation photo | Major | $15,000–50,000 |
| Roof · No roof photo | Major | $15,000–50,000 |
| Exterior · No exterior photo | Major | $15,000–50,000 |
| Interior walls/paint · No interior walls/paint photo | Major | $15,000–50,000 |
| Windows · No windows photo | Major | $15,000–50,000 |
| HVAC/mechanicals · No HVAC/mechanicals photo | Major | $15,000–50,000 |
| Landscaping · No landscaping/curb appeal photo | Major | $15,000–50,000 |
| Total estimated repair cost · 7 items | $105,000–350,000 |
Value-add ROI direction
- Both Landscaping and curb appeal — Improving the curb appeal can increase both resale and rental value ↑
- Both HVAC and mechanicals — Upgrading HVAC and mechanicals can improve comfort and energy efficiency, enhancing both resale and rental value ↑
- Both Interior walls and paint — Fresh paint and updated interior can make the home more appealing to buyers and renters ↑
- Both Windows — New windows can improve energy efficiency and curb appeal, increasing both resale and rental value ↑
ⓘ Cost ranges are severity-bucket heuristics (US national rule-of-thumb). Get contractor quotes + a written scope before underwriting a rehab budget.
Schools (NCES district)
- District
- Indian River
- NCES district ID
- 1200930
- Math proficiency
- 48% ▼ -9.00%
- Reading proficiency
- 52% ▼ -3.00%
- Median HH income
- $46,597
- Composite
- 42.45/100
- National rank
- #3218
- State rank
- #35 of 73 in FL
Livability — West Vero Corridor
- Score
- 74/100
- State rank
- #273
- US rank
- #4421
Category grades
Schools grade is shown separately in the Schools card above.
Census & demographics
- Census place
- West Vero Corridor, FL
- County
- Indian River County · 143,738 people
- Metro
- Sebastian-Vero Beach, FL
- Population (ZIP)
- 20,686
- Household income
- $66,771
- Rent vs Own
- Severe rent burden
- 766.0
Population outlook (Indian River County) Hauer SSP2
- Today (2025)
- 165,104 people
- By 2030
- 172,869 · +4.7%
- By 2040
- 185,640 · +12.4%
- By 2050
- 194,465 · +17.8%
- By 2075
- 211,115 · +27.9%
- By 2100
- 211,781 · +28.3%
Race, ethnicity, and origin ACS 2023
- Neighborhood character
- Predominantly White (83%)
- Race & ethnicity
- White 83% Hispanic / Latino 9% Two or more races 7% Black 5%
- Hispanic origin (detail)
- Puerto Rican 4% Cuban 1%
- Common ancestry
- Romanian 5% Lithuanian 3% Slovak 2%
- Foreign-born
- 8% · Canada, Jamaica
- Languages at home
- 90% English-only · Spanish 7% Russian/Polish/Slavic 1% French/Haitian/Cajun 1%
Political lean MEDSL · Indian River
- 2024 margin
- Strong R (+27.4) · D 36.0% · R 63.4%
- 2008→2024 swing
- -12.5pp toward R · 2008: -14.8pp · 2024: -27.4pp
- All cycles
- 2024: R+27.4 2020: R+21.6 2016: R+24.5 2012: R+22.3 2008: R+14.8
Not yet ingested
- Civics
- —
Market trends
- HPI YoY
- ▼ -102.01%
- Current HPI
- 280.669
- Rent YoY
- ▲ 0.60%
- Metro
- Sebastian-Vero Beach, FL
- State GDP YoY
- ▲ 3.28%
- F500 in state
- 36
Industry mix (Fortune 500 HQ in FL)
| Industry | F500 HQs | Revenue |
|---|---|---|
| Industrial Technology | 2 | $29B |
|
||
| Insurance | 2 | $17B |
|
||
| Retail | 1 | $60B |
|
||
| Technology Distribution | 1 | $58B |
|
||
| Homebuilding | 1 | $35B |
|
||
| Technology Manufacturing | 1 | $35B |
|
||
Cash-flow waterfall
monthlySold comps — $/sqft
last 12 mo · ≤1 miLoading sold comps…