 Duplex
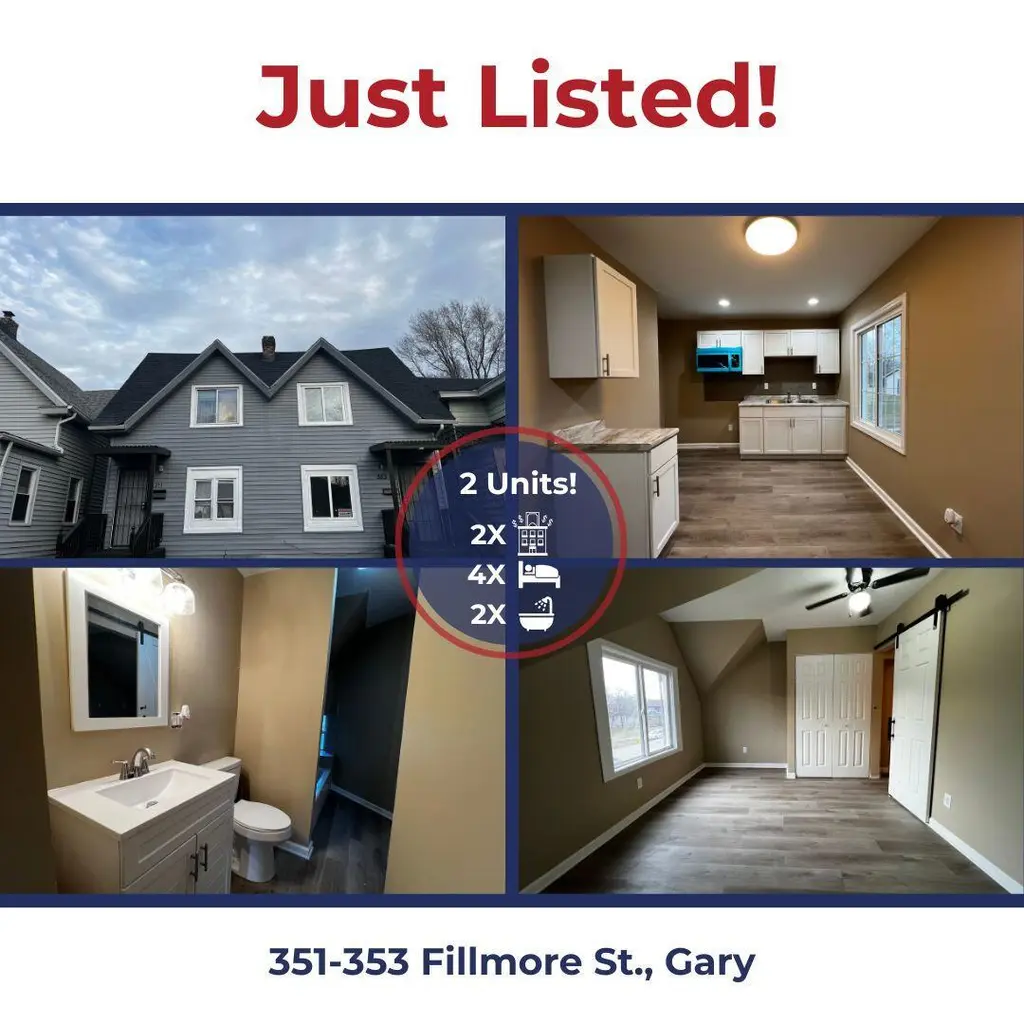
351-353 Fillmore St · Gary, IN
Flood risk 1/10 · Minimal
- FEMA flood zone
- X (unshaded)
- Chance of flooding over 30 yrs
- 0.0%
- Est. flood insurance / yr
- $507 – $1,088
Fire risk 2/10 · Minimal
- Est. fire insurance / yr
- $717 – $1,331
Heat risk 3/10 · Minor
- Hot days now (above 102°F)
- 7 days/yr
- Hot days in 30 yrs
- 15 days/yr
Wind risk 2/10 · Minimal
- Chance of severe wind over 30 yrs
- 1.0%
Air-quality risk 4/10 · Minor
- Unhealthy air days now
- 5 days/yr
- Unhealthy air days in 30 yrs
- 6 days/yr
Risk factors via First Street. Map © Google.
Why this score? — see what drove the B- grade
The composite is a weighted blend of 9 inputs, each scored 0–100. Each bar is that input's sub-score; the figure is the points it added to the 100-point composite (weight × sub-score).
- Cash flow +30.0/30.0
- 1% rule +10.0/10.0
- DSCR +10.0/10.0
- ARV discount +7.5/15.0
- Livability +3.7/5.0
- Rent growth +2.5/5.0
- Condition / age +2.5/5.0
- Appreciation +1.4/10.0
- Schools +0.5/10.0
$159,900
🖨 Deal sheet (PDF) 📄 Offer letter ✓ Due diligence
Multi-family units
County records classify this as Multi-Family (2-4 Unit). Listing-text estimate: 2 units. confirmed
Listing remarks
Gary - * * 2 UNIT REMODELED INCOME PRODUCING PROPERTY NOW AVAILABLE FOR SALE * * Both units are now available to buy! Income-generating assets are what the wealthy focus on acquiring. OR maybe this is your 2nd, 3rd, 10th property and your looking to add more 'Doors' to your portfolio, THESE ARE 2 DOORS YOU WANT!! 2 updated similar units each with 2 bdrms, 1 full bath, Kitchen, Living Rm, Basement. Shared Garage and Fenced Yard.
Key facts
- Fenced yard
- Shared garage
- 4,356 sq ft lot
Tags
Property features AI
Finance
- Other: Living area reported from other source
- Financial info: Multi-unit property with 2 total units (both are two-bedroom units; occupant type: tenant); Insurance expense noted: $973 (reported)
- HOA & community: No HOA information provided
Exterior
- Parking: Alley access; Garage faces the rear; 2-car garage
- Security: No accessibility features indicated
- Utilities: Electricity connected (100 amp service); Natural gas connected; Public water; Public sewer
- Home design: Two-story building; Built in 1916
- Construction: Shingle roof; Has basement (unfinished)
- Exterior features: No notable view; No pool; Garage(s) on the property; Shingle roof
Interior
- Kitchen: Microwave
- Bedrooms: Two 2-bedroom units (multi-unit property)
- Flooring: Vinyl
- Bathrooms: Two full bathrooms (total)
- Heating & cooling: Forced air heating (natural gas); Ceiling fan(s); no central air
- Interior features: Ceiling fans; Recessed lighting; Pets allowed; Unfinished basement
- Laundry & utility: Was not specified
Neighborhood map
What this means for you Summary
Snapshot
- This is a 2 × 2-bed/1.0-bath units multifamily listed at $160k.
Deal economics
- At list price, monthly cash flow is $912 ($11k/yr) — positive. Per door: $456/mo.
- The deal already cash-flows at list — no discount required.
- Meets the 1% rule at list price ($2k rent vs $160k).
- Cap rate 13.1% vs local median 9.1% in Gary — top-decile yield for the area; either an underpriced asset or a hidden risk that comps aren't pricing in. Stress-test before assuming the spread holds.
Location & tenants
- Location reads 73/100 on livability (#105 in IN) — a middle-class / working-renter tenant base. Strengths: commute A+, cost of living A+, housing A+; Watch: schools F, crime F, employment F.
- Gary Community School Corporation (urban): math 3% / reading 11% proficiency, ranked #299 of 301 in IN (top 99%) — low school quality limits family demand, transient renter base, plan for 1-2y turnover; 80% free/reduced lunch — lower-income household profile, screen leases tightly.
- Market conditions: 46 active listings in the ZIP; 10 comparable units currently listed for rent nearby; rentals leasing fast (median 2d on market — plan ~1-2 weeks tenant-placement turnaround); lower-income renter base — watch delinquency; 1,642 units permitted in Lake County in 2024 (14 in 5+ unit buildings).
- At $2,449/mo this rent would consume 88% of the median local household income ($34k/yr) (locally 336% of renters already pay >50% of income on rent) — very limited rent-growth headroom before tenants either downsize or default.
Forward outlook
- Local home prices are declining (-3.0%/yr); year-one equity from $1k of loan paydown is wiped out by about $5k of value loss. Plan a longer hold.
- Lake County population projected to shrink 7% by 2050 — rents likely to lag national; underwrite the cash flow, not the appreciation.
- At projected returns (-3.0% appreciation + 3.0% rent growth), your $45k cash investment doubles in ~5 years — after that, you're playing with house money.
Negotiation context
- Only 1 days on market — expect competitive offers; lowballing is unlikely to land.
- 5 sale attempts since 4y ago with the ask held roughly flat each time — persistent listings suggest the price (not the market) is what's stuck; bring a comps-based counter.
Risks & watch-outs
- Watch-outs: built in 1916 — expect roof / HVAC / electrical / plumbing capex.
Questions for the listing agent
- Can we see the unit-by-unit rent roll, current vacancy, and any below-market leases? What's the average tenancy length?
- What capital expenditures (roof, boiler, parking lot, exteriors) have been made in the last 5 years, and what's planned in the next 2?
- Built in 1916 — when were the roof, HVAC, electrical panel, plumbing, and water heater last replaced?
- Is there a deadline driving the sale (1031 exchange, divorce, estate, relocation)? That informs how much negotiation room exists.
- Schools are F-rated, which usually means shorter tenancies and higher turnover. Who's the typical renter profile here, and what's been the actual vacancy rate?
- Crime grade is F in this area — have there been break-ins, vandalism, or insurance claims at this property in the last 3 years? What carrier currently insures it and at what premium?
- What's the average days-on-market for RENTAL listings here right now (not sales)? A rising rental-DOM trend means longer vacancies and softer asking-rent achievability than the comps imply.
- What's the recent tenant-quality profile in this submarket — average credit score on applications, eviction rate, late-payment / NSF rate, and stable-employment percentage? A property-management company in the area should have these aggregated.
- How much new apartment / multifamily construction is in the pipeline within 1–3 miles? Heavy new supply (>2% of stock underway) typically softens rents 12–24 months out; light construction supports rent growth.
Investment metrics
- 1% rule
- 1.53% ✓
- Cap rate
- 13.14%
- Cash-on-cash
- 24.45%
- DSCR
- 2.09
- GRM
- 5.4
CMA / ARV
No comps found within radius.
Projected returns pro-forma
-3.0% appreciation · 3.0% rent growth · sell at horizon
- IRR
- 17.8%
- Equity multiple
- 1.72×
- Total profit
- $32,180
- Equity at exit
- $23,842
- IRR
- 26.2%
- Equity multiple
- 3.30×
- Total profit
- $102,784
- Equity at exit
- $13,825
Cash invested: $44,772 (down + closing). Projections, not guarantees.
Landlord ↔ Tenant lean methodology
- Overall (STATE)
- 90 Strongly Landlord-Friendly
- State Indiana
- 90 Strongly Landlord-Friendly · R+11
- County
- — inherits STATE
- City
- — inherits STATE
ZIP-level market 46402
- Home prices YoY
- -2.8%
- Active inventory
- 46
- Price-to-rent
- 10.9×
Monthly cashflow live
- Estimated rent
- $2,449 high interval (Pro) →
- Mortgage (P&I)
- −$839
- Tax from tax record
- −$117 /mo · $1,407/yr
- Insurance
- −$67
- HOA
- −$0
- Vacancy / Maint / Mgmt
- −$514
- Net cashflow
- $912
Break-even live
Sensitivity live
| Price | -10% $1,003 | -5% $958 | +0% $912 | +5% $867 | +10% $822 |
|---|---|---|---|---|---|
| Rent | -10% $719 | -5% $816 | +0% $912 | +5% $1,009 | +10% $1,106 |
| Rate | -1.0pp $993 | -0.5pp $953 | base $912 | +0.5pp $871 | +1.0pp $829 |
2-unit breakdown (identical units grouped — click to expand)
| Units | Beds | Baths | Est. rent |
|---|---|---|---|
| 2× units | 2 | 1 | $2,448 |
| #1 | 2 | 1 | $1,224 |
| #2 | 2 | 1 | $1,224 |
| Total (2 units) | $2,449 | ||
UW: 25.0% down · 7.5% · 30yr · 1.5% tax · 5.0% vac · 8.0% maint · 8.0% mgmt
Financing live
Cash to close
- Down payment
- $39,975
- Closing costs
- $4,797
- Reserves months
- —
- Total cash needed
- —
Loan-product check · same deal, 3 products live
Conventional
25% down · 7.5% · 30yr
- Down + closing
- —
- Monthly P&I
- —
- Monthly cashflow
- —
- DSCR
- —
- Eligible?
- —
Personal DTI + credit; lowest rate.
DSCR
20% down · 8.5% · 30yr
- Down + closing
- —
- Monthly P&I
- —
- Monthly cashflow
- —
- DSCR
- —
- Eligible?
- —
No personal income docs; deal must DSCR.
Hard money
10% down · 12.0% · 12mo
- Down + closing
- —
- Monthly P&I
- —
- Monthly cashflow
- —
- DSCR
- —
- Eligible?
- —
Short-term bridge; refi at stabilization.
Rent comps 10 comps
| Address | Beds | Baths | Sqft | Rent | $/sqft | DOM | Units | Dist |
|---|---|---|---|---|---|---|---|---|
| 501 Madison St Gary, IN | 1.0–4.0 | 1.0 | 883 | $1,580 | $1.79 | 1d | 11 | 0.50mi |
| 803 Pierce St Gary, IN | 4.0 | 2.0 | 1600 | $1,400 | $0.88 | 1d | 1 | 0.53mi |
| 765 Garfield St Gary, IN | 3.0 | 1.0 | 1688 | $1,500 | $0.89 | 14d | 1 | 0.64mi |
| 373 Taft Pl Gary, IN | 4.0 | 2.0 | 1984 | $1,800 | $0.91 | 44d | 1 | 0.79mi |
| 672 Connecticut St Apt 1S Gary, IN | 3.0 | 1.0 | 1247 | $875 | $0.70 | 15d | 1 | 0.91mi |
| 1572 Polk St Gary, IN | 3.0 | 1.0 | 1500 | $1,250 | $0.83 | 1d | 1 | 1.22mi |
| 1744 Tyler St Unit 2 Gary, IN | 4.0 | 2.0 | 1600 | $1,700 | $1.06 | 45d | 1 | 1.32mi |
| 1109 Maryland St Unit 1 Gary, IN | 3.0 | 1.5 | 1982 | $1,000 | $0.50 | 1d | 1 | 1.38mi |
| 1109 Maryland St Gary, IN | 3.0 | 1.0 | 1982 | $1,000 | $0.50 | 1d | 1 | 1.38mi |
| 1030 E 6th Ave Gary, IN | 3.0 | 1.5 | 1400 | $1,600 | $1.14 | 1d | 1 | 1.44mi |
Listing history 2 events
-
2026-06-18remarks 438-char remark
-
2026-06-18$159,900 Active 1 DOM
ⓘ Source: listings_history table (triggers on properties + properties_extension) + one-shot
backfill from property_details.listing_events for pre-trigger history.
Tax reassessment forecast IN · Partial reset (capped growth)
- Current annual tax
- $1,407 · $117/mo
- Projected year-2 tax
- $1,407 · $117/mo
- Expected delta
- $0/yr ($0/mo · 0.0%)
ⓘ Screening estimate from a state-policy table — verify with the county assessor before closing.
Climate risk First Street
- Flood 1/10 Low FEMA zone X (unshaded) · 0% chance over 30 yrs
- Wildfire 2/10 Low
- Heat 3/10 Moderate 7 d/yr ≥102°F today · 15 d/yr by 30 yrs out
- Wind 2/10 Low 100% chance of damaging wind over 30 yrs
- Air quality 4/10 Moderate 5 unhealthy d/yr today · 6 by 30 yrs out
Nearby sold comps map
Loading sold comps map…
Walkable amenities ~0.75 mi
Loading nearby amenities…
Taxation est. · year 1
- Rental income
- $29,388
- − Mortgage interest
- −$8,957
- − Property taxes
- −$1,407
- − Insurance
- −$800
- − Repairs & maintenance
- −$2,351
- − Management
- −$2,351
- − Depreciation
- −$4,652
- Taxable income
- $8,871
- Est. tax owed @ 24.0%
- −$2,129
- After-tax cash flow
- $8,818/yr
For passive investors: Depreciation is non-cash, so a rental often shows a tax loss while cash-flowing — sheltering income. Rental losses are passive: they offset passive income freely, and up to $25,000/yr can offset ordinary (W-2) income if you actively participate and your MAGI is under $100k (phasing out to $0 by $150k); unused losses carry forward. On sale, claimed depreciation is recaptured at up to 25%, and gains may owe capital-gains tax (a 1031 exchange can defer both). Figures are a year-1 estimate at your 24.0% rate — not tax advice; consult a CPA.
Schools (NCES district)
- District
- Gary Community School Corporation
- NCES district ID
- 1803870
- Math proficiency
- 3% ▼ -10.00%
- Reading proficiency
- 11% ▼ -6.00%
- Median HH income
- $27,739
- Composite
- 4.98/100
- National rank
- #10039
- State rank
- #299 of 301 in IN
Livability — Gary
- Score
- 73/100
- State rank
- #105
- US rank
- #5592
Category grades
Schools grade is shown separately in the Schools card above.
Census & demographics
- Census place
- Gary, IN
- County
- Lake County · 422,878 people
- City population
- 63,701
- Metro
- Chicago-Naperville-Elgin, IL-IN-WI
- Population (ZIP)
- 5,836
- Household income
- $33,529
- Rent vs Own
- Severe rent burden
- 336.0
Population outlook (Lake County) Hauer SSP2
- Today (2025)
- 484,026 people
- By 2030
- 478,091 · -1.2%
- By 2040
- 462,974 · -4.3%
- By 2050
- 449,894 · -7.1%
- By 2075
- 436,169 · -9.9%
- By 2100
- 426,607 · -11.9%
Race, ethnicity, and origin ACS 2023
- Neighborhood character
- Predominantly Black (87%)
- Race & ethnicity
- Black 87% Two or more races 5% White 5% Hispanic / Latino 4%
- Common ancestry
- Romanian 1% Ukrainian 1%
- Foreign-born
- 1% · Canada
- Languages at home
- 98% English-only · Spanish 1% Arabic 1%
Political lean MEDSL · Lake
- 2024 margin
- Lean D (+5.6) · D 52.1% · R 46.5% · Other 1.5%
- 2008→2024 swing
- -28.6pp toward R · 2008: 34.3pp · 2024: 5.6pp
- All cycles
- 2024: D+5.6 2020: D+15.1 2016: D+20.6 2012: D+31.0 2008: D+34.3
Not yet ingested
- Civics
- —
Market trends
- HPI YoY
- ▼ -7.21%
- Current HPI
- 250.2464
- Rent YoY
- —
- Metro
- Chicago-Naperville-Elgin, IL-IN-WI
- State GDP YoY
- ▲ 2.90%
- F500 in state
- 18
Industry mix (Fortune 500 HQ in IN)
| Industry | F500 HQs | Revenue |
|---|---|---|
| Industrial Machinery | 2 | $37B |
|
||
| Healthcare | 1 | $177B |
|
||
| Pharmaceuticals | 1 | $45B |
|
||
| Metals / Steel | 1 | $18B |
|
||
| Agriculture | 1 | $17B |
|
||
| Packaging | 1 | $12B |
|
||
Price history
+107.7% since first listed11 events — show timeline
- 2026-06-17 Listed $159,900 NIRA MLS as Distributed by MLS Grid
- 2026-05-14 Listing Removed — NIRA MLS as Distributed by MLS Grid
- 2026-05-13 Listed $180,000 NIRA MLS as Distributed by MLS Grid
- 2025-10-01 Listing Removed — NIRA MLS as Distributed by MLS Grid
- 2025-06-01 Listed $175,000 NIRA MLS as Distributed by MLS Grid
- 2022-06-30 Listing Removed — NIRA MLS as Distributed by MLS Grid
- 2022-06-29 Relisted — NIRA MLS as Distributed by MLS Grid
- 2022-05-21 Pending — NIRA MLS as Distributed by MLS Grid
- 2022-05-18 Contingent — NIRA MLS as Distributed by MLS Grid
- 2022-05-16 Price Changed $76,999 NIRA MLS as Distributed by MLS Grid
- 2022-04-21 Listed $77,000 NIRA MLS as Distributed by MLS Grid
Property tax history
-6.7%/yrLatest (2024): $1,407 · -14.0% YoY. Source: county tax records.
Cash-flow waterfall
monthlySold comps — $/sqft
last 12 mo · ≤1 miLoading sold comps…