 Multi-family
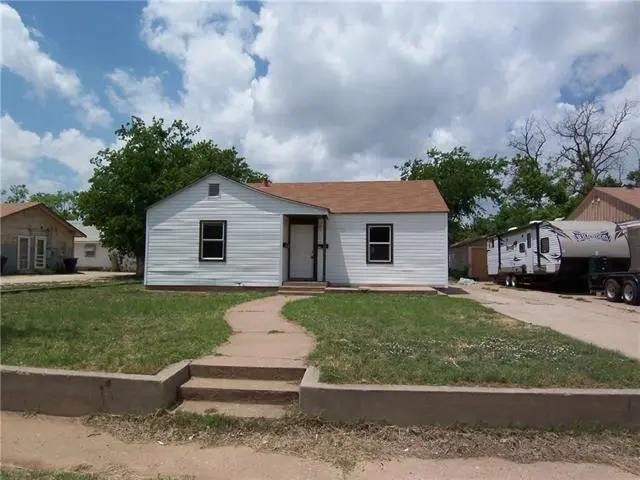
1018 Merchant St · Abilene, TX
Flood risk 1/10 · Minimal
- FEMA flood zone
- X (unshaded)
- Chance of flooding over 30 yrs
- 0.0%
- Est. flood insurance / yr
- $507 – $1,088
Fire risk 1/10 · Minimal
- Est. fire insurance / yr
- $1,222 – $2,270
Heat risk 7/10 · Major
- Hot days now (above 104°F)
- 7 days/yr
- Hot days in 30 yrs
- 23 days/yr
Wind risk 4/10 · Minor
- Chance of severe wind over 30 yrs
- 11.0%
Air-quality risk 1/10 · Minimal
- Unhealthy air days now
- 0 days/yr
- Unhealthy air days in 30 yrs
- 0 days/yr
Risk factors via First Street. Map © Google.
Why this score? — see what drove the B grade
The composite is a weighted blend of 9 inputs, each scored 0–100. Each bar is that input's sub-score; the figure is the points it added to the 100-point composite (weight × sub-score).
- Cash flow +30.0/30.0
- 1% rule +10.0/10.0
- DSCR +10.0/10.0
- ARV discount +7.5/15.0
- Rent growth +5.0/5.0
- Livability +3.8/5.0
- Schools +2.8/10.0
- Condition / age +2.5/5.0
- Appreciation +0.0/10.0
$250,000
🖨 Deal sheet 📄 Offer letter ✓ Due diligence
Multi-family units
County records classify this as Multi-Family (2-4 Unit). Listing-text estimate: 1 unit. estimate disagrees with records
Listing remarks MLS
Ready for a great investment? Look no further! This triplex has new siding, windows, roof, flooring & paint. If you want you can live in the 3 bedroom that could easily be a 4 bedroom. front house and enjoy the monthly income of the 2 back properties. The properties include central heat & AC. The front has it's own driveway while the back 2 has its own drive in the back. Front and back properties have their own privacy wood fenced yard.
Key facts
- 9,583 sq ft lot
- 4 parking spots
- Built 1946
Property features AI
Finance
- Other: Property type: Residential Income (Triplex); Two buildings with three total units; Lot size about 0.22 acres; Subdivision: Lakeside Add; Possession subject to lease and at closing/funding
- Financial info: Gross annual income: $21,600; Gross annual expenses: $10,800; Insurance expense: $2,780; Net operating income: $10,800; Capitalization rate: 4.32%
- HOA & community: No association
Exterior
- Parking: Driveway parking; 4 parking spaces
- Utilities: City water; City sewer; Electricity connected; Not in a municipal utility district
- Home design: Residential income property (triplex); One level; No accessibility features noted
- Construction: Built in 1946; Frame and siding construction; Composition roof; Pillar/Post/Pier and slab foundation
- Exterior features: Wood fencing; Interior lot; Alley access
Interior
- Kitchen: Other appliances
- Bedrooms: 7 bedrooms
- Flooring: Other flooring
- Bathrooms: 3 full bathrooms
- Heating & cooling: Central heating (electric); Central air conditioning (electric)
- Interior features: Cable TV available; Other interior features
- Laundry & utility: Other (laundry/utility)
Neighborhood map
What this means for you Summary
Snapshot
- This is a 7-bed/1.0-bath multifamily listed at $250k.
Deal economics
- At list price, monthly cash flow is $1k ($16k/yr) — positive.
- The deal already cash-flows at list — no discount required.
- Meets the 1% rule at list price ($4k rent vs $250k).
- Recommended offer: $246k (1.5% below list) — sets the bar for market timing.
- Cap rate 12.5% vs local median 6.7% in Abilene — top-decile yield for the area; either an underpriced asset or a hidden risk that comps aren't pricing in. Stress-test before assuming the spread holds.
Location & tenants
- Location reads 75/100 on livability (#142 in TX, #4,037 nationally) — a middle-class / working-renter tenant base. Strengths: cost of living A+, housing A+, health & safety A+; Watch: crime D, commute F.
- Abilene ISD (urban): math 32% / reading 34% proficiency, ranked #575 of 826 in TX (top 70%) — families likely to look elsewhere, expect single-tenant / working-renter base with shorter leases.
- Zoned schools: Martinez El (math 30% / reading 23%, grade F, #2,927 of 4,322 statewide, top 68%, 412 students, 94% FRL) — zoned schools average 94% FRL vs 57% district-wide (37 pts higher); higher-poverty schools than district average — tighter screening recommended.
- Market conditions: Rents rising fast (+40.2%/yr); 86 active listings in the ZIP; 508 units permitted in Taylor County in 2024 (0 in 5+ unit buildings).
- At $3,860/mo this rent would consume 87% of the median local household income ($54k/yr) (locally 662% of renters already pay >50% of income on rent) — very limited rent-growth headroom before tenants either downsize or default.
Forward outlook
- Local home prices are declining (-3.0%/yr); year-one equity from $2k of loan paydown is wiped out by about $8k of value loss. Plan a longer hold.
- Taylor County population projected at +16% by 2050 — long-run rental-demand tailwind backs the buy-and-hold thesis.
- At projected returns (-3.0% appreciation + 8.0% rent growth), your $70k cash investment doubles in ~5 years — after that, you're playing with house money.
Negotiation context
- It's been on market 20 days — a 2% lower offer ($246k) is reasonable based on typical stale-listing flexibility.
- 4 sale attempts since 18y ago with the ask held roughly flat each time — persistent listings suggest the price (not the market) is what's stuck; bring a comps-based counter.
Risks & watch-outs
- Watch-outs: built in 1946 — expect roof / HVAC / electrical / plumbing capex.
- Climate carrying-cost: extreme-heat days projected 7→23/yr by 2055 (HVAC capex compounding) — expect insurance premiums to compound above CPI over the hold.
Questions for the listing agent
- Built in 1946 — when were the roof, HVAC, electrical panel, plumbing, and water heater last replaced?
- Is there a deadline driving the sale (1031 exchange, divorce, estate, relocation)? That informs how much negotiation room exists.
- Schools are D-rated, which usually means shorter tenancies and higher turnover. Who's the typical renter profile here, and what's been the actual vacancy rate?
- Crime grade is D in this area — have there been break-ins, vandalism, or insurance claims at this property in the last 3 years? What carrier currently insures it and at what premium?
- What's the average days-on-market for RENTAL listings here right now (not sales)? A rising rental-DOM trend means longer vacancies and softer asking-rent achievability than the comps imply.
- What's the recent tenant-quality profile in this submarket — average credit score on applications, eviction rate, late-payment / NSF rate, and stable-employment percentage? A property-management company in the area should have these aggregated.
- How much new apartment / multifamily construction is in the pipeline within 1–3 miles? Heavy new supply (>2% of stock underway) typically softens rents 12–24 months out; light construction supports rent growth.
Investment metrics
- 1% rule
- 1.54% ✓
- Cap rate
- 12.55%
- Cash-on-cash
- 22.34%
- DSCR
- 1.99
- GRM
- 5.4
CMA / ARV
No comps found within radius.
Projected returns pro-forma
-3.0% appreciation · 8.0% rent growth · sell at horizon
- IRR
- 20.7%
- Equity multiple
- 1.90×
- Total profit
- $62,943
- Equity at exit
- $37,276
- IRR
- 32.1%
- Equity multiple
- 4.64×
- Total profit
- $254,795
- Equity at exit
- $21,615
Cash invested: $70,000 (down + closing). Projections, not guarantees.
Landlord ↔ Tenant lean methodology
- Overall (STATE)
- 87 Strongly Landlord-Friendly
- State Texas
- 87 Strongly Landlord-Friendly · R+5
- County
- — inherits STATE
- City
- — inherits STATE
ZIP-level market 79603
- Home prices YoY
- -32.5%
- Rents YoY
- 40.2%
- Active inventory
- 86
- Price-to-rent
- 14.7×
Monthly cashflow live
- Estimated rent
- $3,860 medium interval (Pro) →
- Mortgage (P&I)
- −$1,311
- Tax from tax record
- −$331 /mo · $3,975/yr
- Insurance
- −$104
- HOA
- −$0
- Vacancy / Maint / Mgmt
- −$811
- Net cashflow
- $1,303
Break-even live
3-unit breakdown (identical units grouped — click to expand)
| Units | Beds | Baths | Est. rent |
|---|---|---|---|
| 1× unit | 3 | 1 | $1,413 |
| 2× units | 2 | 1 | $2,448 |
| #2 | 2 | 1 | $1,224 |
| #3 | 2 | 1 | $1,224 |
| Total (3 units) | $3,860 | ||
UW: 25.0% down · 7.5% · 30yr · 1.5% tax · 5.0% vac · 8.0% maint · 8.0% mgmt
Financing live
Cash to close
- Down payment
- $62,500
- Closing costs
- $7,500
- Reserves months
- —
- Total cash needed
- —
Loan-product check · same deal, 3 products live
Conventional
25% down · 7.5% · 30yr
- Down + closing
- —
- Monthly P&I
- —
- Monthly cashflow
- —
- DSCR
- —
- Eligible?
- —
Personal DTI + credit; lowest rate.
DSCR
20% down · 8.5% · 30yr
- Down + closing
- —
- Monthly P&I
- —
- Monthly cashflow
- —
- DSCR
- —
- Eligible?
- —
No personal income docs; deal must DSCR.
Hard money
10% down · 12.0% · 12mo
- Down + closing
- —
- Monthly P&I
- —
- Monthly cashflow
- —
- DSCR
- —
- Eligible?
- —
Short-term bridge; refi at stabilization.
Listing history 16 events
-
2026-06-19days on market $250,000 Active 20 DOM
-
2026-06-18days on market $250,000 Active 19 DOM
-
2026-06-17days on market $250,000 Active 18 DOM
-
2026-06-16days on market $250,000 Active 17 DOM
-
2026-06-15days on market $250,000 Active 16 DOM
-
2026-06-14days on market $250,000 Active 14 DOM
-
2026-06-13days on market $250,000 Active 13 DOM
-
2026-06-10days on market $250,000 Active 11 DOM
-
2026-06-09days on market $250,000 Active 10 DOM
-
2026-06-08days on market $250,000 Active 9 DOM
-
2026-06-07days on market $250,000 Active 8 DOM
-
2026-06-03days on market $250,000 Active 4 DOM
-
2026-06-02days on market $250,000 Active 3 DOM
-
2026-06-01days on market $250,000 Active 2 DOM
-
2026-05-31remarks 184-char remark
-
2026-05-31$250,000 Active 1 DOM
ⓘ Source: listings_history table (triggers on properties + properties_extension) + one-shot
backfill from property_details.listing_events for pre-trigger history.
Tax reassessment forecast TX · Resets to sale price
- Current annual tax
- $3,975 · $331/mo
- Projected year-2 tax
- $4,575 · $381/mo
- Expected delta
- +$600/yr (+$50/mo · 15.1%)
ⓘ Screening estimate from a state-policy table — verify with the county assessor before closing.
Climate risk First Street
- Flood 1/10 Low FEMA zone X (unshaded) · 0% chance over 30 yrs
- Wildfire 1/10 Low
- Heat 7/10 Severe 7 d/yr ≥104°F today · 23 d/yr by 30 yrs out
- Wind 4/10 Moderate 11% chance of damaging wind over 30 yrs
- Air quality 1/10 Low 0 unhealthy d/yr today · 0 by 30 yrs out
Nearby sold comps map
Loading sold comps map…
Walkable amenities ~0.75 mi
Loading nearby amenities…
Taxation est. · year 1
- Rental income
- $46,320
- − Mortgage interest
- −$14,004
- − Property taxes
- −$3,975
- − Insurance
- −$1,250
- − Repairs & maintenance
- −$3,706
- − Management
- −$3,706
- − Depreciation
- −$7,273
- Taxable income
- $12,407
- Est. tax owed @ 24.0%
- −$2,978
- After-tax cash flow
- $12,658/yr
For passive investors: Depreciation is non-cash, so a rental often shows a tax loss while cash-flowing — sheltering income. Rental losses are passive: they offset passive income freely, and up to $25,000/yr can offset ordinary (W-2) income if you actively participate and your MAGI is under $100k (phasing out to $0 by $150k); unused losses carry forward. On sale, claimed depreciation is recaptured at up to 25%, and gains may owe capital-gains tax (a 1031 exchange can defer both). Figures are a year-1 estimate at your 24.0% rate — not tax advice; consult a CPA.
Schools (NCES district)
- District
- Abilene ISD
- NCES district ID
- 4807440
- Math proficiency
- 32% ▼ -11.00%
- Reading proficiency
- 34% ▼ -5.00%
- Median HH income
- $39,782
- Composite
- 27.71/100
- National rank
- #6909
- State rank
- #575 of 826 in TX
Livability — Abilene
- Score
- 75/100
- State rank
- #142
- US rank
- #4037
Category grades
Schools grade is shown separately in the Schools card above.
Census & demographics
- Census place
- Abilene, TX
- County
- Taylor County · 136,672 people
- City population
- 136,672
- Metro
- Abilene, TX
- Population (ZIP)
- 23,548
- Household income
- $53,513
- Rent vs Own
- Severe rent burden
- 662.0
Population outlook (Taylor County) Hauer SSP2
- Today (2025)
- 145,270 people
- By 2030
- 150,050 · +3.3%
- By 2040
- 159,417 · +9.7%
- By 2050
- 168,883 · +16.3%
- By 2075
- 194,436 · +33.8%
- By 2100
- 203,163 · +39.9%
Race, ethnicity, and origin ACS 2023
- Neighborhood character
- Diverse neighborhood (Simpson 0.60)
- Race & ethnicity
- Hispanic / Latino 48% White 40% Two or more races 24% Black 8%
- Hispanic origin (detail)
- Mexican 44%
- Common ancestry
- Italian 2% Slovak 2% Portuguese 1%
- Foreign-born
- 9% · Canada
- Languages at home
- 73% English-only · Spanish 25%
Political lean MEDSL · Taylor
- 2024 margin
- Solid R (+49.8) · D 24.6% · R 74.4% · Other 1.0%
- 2008→2024 swing
- -4.2pp toward R · 2008: -45.6pp · 2024: -49.8pp
- All cycles
- 2024: R+49.8 2020: R+45.3 2016: R+51.1 2012: R+53.6 2008: R+45.6
Not yet ingested
- Civics
- —
Market trends
- HPI YoY
- ▼ -88.84%
- Current HPI
- 184.8875
- Rent YoY
- ▲ 40.19%
- Metro
- Abilene, TX
- State GDP YoY
- ▲ 3.95%
- F500 in state
- 110
Industry mix (Fortune 500 HQ in TX)
| Industry | F500 HQs | Revenue |
|---|---|---|
| Energy | 16 | $1,198B |
|
||
| Technology | 5 | $198B |
|
||
| Engineering / Construction | 4 | $72B |
|
||
| Energy Services | 3 | $60B |
|
||
| Utilities | 3 | $41B |
|
||
| Healthcare | 2 | $330B |
|
||
Price history
+234.0% since first listed14 events — show timeline
- 2026-05-30 Listed $250,000 NTREIS
- 2015-07-15 Sold (Public Records) — Public Records
- 2015-07-13 Sold (MLS) — NTREIS
- 2015-07-08 Pending — NTREIS
- 2015-06-29 Contingent — NTREIS
- 2015-05-12 Listed $115,000 NTREIS
- 2011-05-17 Listing Removed — NTREIS
- 2011-02-08 Listed $125,000 NTREIS
- 2008-08-20 Sold (Public Records) — Public Records
- 2008-08-19 Sold (MLS) — NTREIS
- 2008-07-19 Listing Removed — NTREIS
- 2008-01-23 Listed $74,840 NTREIS
- 2005-03-01 Sold (Public Records) — Public Records
- 2003-01-15 Sold (Public Records) — Public Records
Property tax history
+3.8%/yrLatest (2025): $3,975 · +1.5% YoY. Source: county tax records.
Cash-flow waterfall
monthlySold comps — $/sqft
last 12 mo · ≤1 miLoading sold comps…