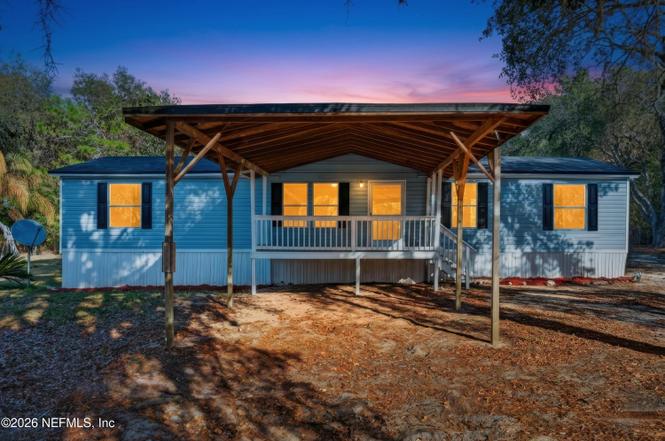
7595 Oak Forest Rd · Keystone Heights, FL
Flood risk 1/10 · Minimal
- FEMA flood zone
- X (unshaded)
- Chance of flooding over 30 yrs
- 0.0%
- Est. flood insurance / yr
- $507 – $1,088
Fire risk 7/10 · Major
- Est. fire insurance / yr
- $947 – $1,759
Heat risk 8/10 · Major
- Hot days now (above 108°F)
- 7 days/yr
- Hot days in 30 yrs
- 20 days/yr
Wind risk 9/10 · Severe
- Chance of severe wind over 30 yrs
- 99.0%
Air-quality risk 3/10 · Minor
- Unhealthy air days now
- 3 days/yr
- Unhealthy air days in 30 yrs
- 3 days/yr
Risk factors via First Street. Map © Google.
Why this score? — see what drove the F grade
The composite is a weighted blend of 9 inputs, each scored 0–100. Each bar is that input's sub-score; the figure is the points it added to the 100-point composite (weight × sub-score).
- Cash flow +6.6/30.0
- ARV discount +5.3/15.0
- Schools +5.1/10.0
- Livability +4.0/5.0
- Rent growth +2.5/5.0
- Condition / age +2.5/5.0
- 1% rule +1.4/10.0
- DSCR +0.8/10.0
- Appreciation +0.0/10.0
$199,999
🖨 Deal sheet (PDF) 📄 Offer letter ✓ Due diligence
Listing remarks MLS
Very affordable, very nice mobile home with a new roof!!!!! Along with a new roof, this home has a new A/C system, new vinyl plank flooring throughout, new stainless appliances, Enjoy a nice covered front porch and large open rear deck, perfect for grilling and chilling!!!!! New paint inside and out makes this one move in ready!!!!!
Key facts
- Covered front porch
- Separate shower
- Open rear deck
Tags
Property features AI
Finance
- Financial info: Annual tax information available
Exterior
- Parking: Other parking
- Utilities: Septic tank; Cable available; Electricity connected; Sewer connected; Water connected
- Home design: Double wide manufactured home; Single-story
- Construction: Vinyl siding; Shingle roof
- Exterior features: Fenced (other); Lot approximately 0.37 acres
Interior
- Kitchen: Dishwasher; Electric range; Microwave; Refrigerator
- Bedrooms: 3 bedrooms
- Bathrooms: 2 full bathrooms
- Heating & cooling: Central heating (electric); Central air conditioning
- Interior features: Deck; Front porch
- Laundry & utility: Washer hookup; Electric dryer hookup
Neighborhood map
What this means for you Summary
Snapshot
- This is a 3-bed/2.0-bath manufactured listed at $200k.
Deal economics
- At list price, monthly cash flow is $-331 ($-4k/yr) — negative.
- To cash-flow at today's rent, offer at most $142k (29.2% below list).
- To meet the 1% rule (rent ≥ 1% of price), the offer needs to be $129k (35.5% below list).
- Recommended offer: $129k (35.5% below list) — sets the bar for 1% rule.
Location & tenants
- Location reads 80/100 on livability (#109 in FL, #1,684 nationally) — a professional / high-income tenant draw. Strengths: crime A+, cost of living A+, housing A+; Watch: amenities F, commute F.
- Clay (suburban): math 58% / reading 59% proficiency, ranked #14 of 73 in FL (top 19%) — acceptable for families but not a draw, mixed tenant base, ~2y average lease.
- Zoned schools: Mcrae Elementary School (math 66% / reading 58%, grade B, #608 of 2,144 statewide, top 29%, 536 students, 100% FRL); Keystone Heights Junior/Senior High (math 48% / reading 47%, grade D, #204 of 667 statewide, top 31%, 1,205 students, 100% FRL) — zoned schools average 100% FRL vs 35% district-wide (65 pts higher); higher-poverty schools than district average — tighter screening recommended.
- Market conditions: 327 active listings in the ZIP; 1 comparable units currently listed for rent nearby; 1,876 units permitted in Clay County in 2024 (14 in 5+ unit buildings).
Forward outlook
- Local home prices are declining (-3.0%/yr); year-one equity from $1k of loan paydown is wiped out by about $6k of value loss. Plan a longer hold.
- Clay County population projected at +19% by 2050 — long-run rental-demand tailwind backs the buy-and-hold thesis.
Negotiation context
- It's been on market 108 days — a 9% lower offer ($182k) is reasonable based on typical stale-listing flexibility.
- 2 sale attempts since 6y ago with the ask held roughly flat each time — persistent listings suggest the price (not the market) is what's stuck; bring a comps-based counter.
- Current owner paid $120k; list at $200k implies a 67% gain — meaningful room to come down on a strong offer.
Risks & watch-outs
- Climate carrying-cost: severe wind risk, 99% chance of damaging wind over 30y; major wildfire risk; extreme-heat days projected 7→20/yr by 2055 (HVAC capex compounding) — expect insurance premiums to compound above CPI over the hold.
Questions for the listing agent
- What do current leases actually rent for vs. the listed asking? Can we see a recent rent roll and the last 12 months of T-12 income?
- It's been on market 108 days. Have you received any prior offers? Is the seller open to a 36% concession, seller financing, or rate buy-down credit?
- Why hasn't it sold? Are there any deal-killer items the seller is aware of (foundation, flood, title, zoning, code violations)?
- Is there a deadline driving the sale (1031 exchange, divorce, estate, relocation)? That informs how much negotiation room exists.
- Schools are A-rated — typically a magnet for longer-tenancy family renters. What's the average tenant stay here, and is there a school-zone premium baked into asking?
- The area grade is low — what's the realistic commute time and amenity access for the typical tenant pool here? Any planned neighborhood developments (good or bad) we should know about?
- What's the average days-on-market for RENTAL listings here right now (not sales)? A rising rental-DOM trend means longer vacancies and softer asking-rent achievability than the comps imply.
- What's the recent tenant-quality profile in this submarket — average credit score on applications, eviction rate, late-payment / NSF rate, and stable-employment percentage? A property-management company in the area should have these aggregated.
- How much new for-sale + rental construction is in the pipeline within 1–3 miles? Heavy new supply typically softens prices + rents 12–24 months out; constrained supply supports both.
Investment metrics
- 1% rule
- 0.64% ✗
- Cap rate
- 4.31%
- Cash-on-cash
- -7.08%
- DSCR
- 0.68
- GRM
- 12.9
CMA / ARV
- ARV (on-the-fly)
- $190,624
- Comps found
- 3
Show comp detail 3 sales within ~0.75 mi
| Address | Dist | Beds/Ba | Sqft | Sold | Price | $/sf | Match |
|---|---|---|---|---|---|---|---|
| 7556 Monongahela Ave | 0.31mi | 3/2.0 | 1,344 (+4%) | 6mo | $206,000 | $153 | 73 |
| 5827 Hillridge Rd | 0.47mi | 3/2.0 | 1,352 (+5%) | 6mo | $200,000 | $148 | 65 |
| 5742 Overlook Dr W | 0.29mi | 4/2.0 (+1) | 1,404 (+9%) | 14mo | $193,000 | $137 | 55 |
Match score weights: distance 35% · size 25% · config 20% · recency 20%. Top-matched comps best support the ARV.
Projected returns pro-forma
-3.0% appreciation · 3.0% rent growth · sell at horizon
- IRR
- -28.6%
- Equity multiple
- 0.05×
- Total profit
- $-53,465
- Equity at exit
- $29,821
- IRR
- -28.2%
- Equity multiple
- -0.32×
- Total profit
- $-73,672
- Equity at exit
- $17,292
Cash invested: $56,000 (down + closing). Projections, not guarantees.
Landlord ↔ Tenant lean methodology
- Overall (STATE)
- 87 Strongly Landlord-Friendly
- State Florida
- 87 Strongly Landlord-Friendly · R+3
- County
- — inherits STATE
- City
- — inherits STATE
ZIP-level market 32656
- Home prices YoY
- -7.4%
- Active inventory
- 327
- Price-to-rent
- 12.9×
Monthly cashflow live
- Estimated rent
- $1,290 medium interval (Pro) →
- Mortgage (P&I)
- −$1,049
- Tax from tax record
- −$217 /mo · $2,608/yr
- Insurance
- −$83
- HOA
- −$0
- Lot rent leased land?
- −$0
- Vacancy / Maint / Mgmt
- −$271
- Net cashflow
- $-331
Break-even live
Sensitivity live
| Price | -10% $-217 | -5% $-274 | +0% $-331 | +5% $-387 | +10% $-444 |
|---|---|---|---|---|---|
| Rent | -10% $-432 | -5% $-382 | +0% $-331 | +5% $-280 | +10% $-229 |
| Rate | -1.0pp $-230 | -0.5pp $-280 | base $-331 | +0.5pp $-382 | +1.0pp $-435 |
UW: 25.0% down · 7.5% · 30yr · 1.5% tax · 5.0% vac · 8.0% maint · 8.0% mgmt
Financing live
Cash to close
- Down payment
- $50,000
- Closing costs
- $6,000
- Reserves months
- —
- Total cash needed
- —
Loan-product check · same deal, 3 products live
Conventional
25% down · 7.5% · 30yr
- Down + closing
- —
- Monthly P&I
- —
- Monthly cashflow
- —
- DSCR
- —
- Eligible?
- —
Personal DTI + credit; lowest rate.
DSCR
20% down · 8.5% · 30yr
- Down + closing
- —
- Monthly P&I
- —
- Monthly cashflow
- —
- DSCR
- —
- Eligible?
- —
No personal income docs; deal must DSCR.
Hard money
10% down · 12.0% · 12mo
- Down + closing
- —
- Monthly P&I
- —
- Monthly cashflow
- —
- DSCR
- —
- Eligible?
- —
Short-term bridge; refi at stabilization.
Rent comps 1 comps
| Address | Beds | Baths | Sqft | Rent | $/sqft | DOM | Units | Dist |
|---|---|---|---|---|---|---|---|---|
| 7559 Monongahela Ave Keystone Heights, FL | 3.0 | 2.0 | 1152 | $1,675 | $1.45 | 10d | 1 | 0.38mi |
Listing history 16 events
-
2026-06-15days on market $199,999 Active 108 DOM
-
2026-06-13days on market $199,999 Active 106 DOM
-
2026-06-13days on market $199,999 Active 105 DOM
-
2026-06-09days on market $199,999 Active 102 DOM
-
2026-06-08days on market $199,999 Active 101 DOM
-
2026-06-07days on market $199,999 Active 100 DOM
-
2026-06-03days on market $199,999 Active 96 DOM
-
2026-06-02days on market $199,999 Active 95 DOM
-
2026-06-01days on market $199,999 Active 94 DOM
-
2026-05-31days on market $199,999 Active 93 DOM
-
2026-02-27$199,999 Active
-
2020-08-28soldstatus $119,900 Sold 334-char remark
Show marketing remark (334 chars)
Very affordable, very nice mobile home with a new roof!!!!! Along with a new roof, this home has a new A/C system, new vinyl plank flooring throughout, new stainless appliances, Enjoy a nice covered front porch and large open rear deck, perfect for grilling and chilling!!!!! New paint inside and out makes this one move in ready!!!!!
-
2020-07-06status Pending 334-char remark
Show marketing remark (334 chars)
Very affordable, very nice mobile home with a new roof!!!!! Along with a new roof, this home has a new A/C system, new vinyl plank flooring throughout, new stainless appliances, Enjoy a nice covered front porch and large open rear deck, perfect for grilling and chilling!!!!! New paint inside and out makes this one move in ready!!!!!
-
2020-06-30$119,900 Active 334-char remark
Show marketing remark (334 chars)
Very affordable, very nice mobile home with a new roof!!!!! Along with a new roof, this home has a new A/C system, new vinyl plank flooring throughout, new stainless appliances, Enjoy a nice covered front porch and large open rear deck, perfect for grilling and chilling!!!!! New paint inside and out makes this one move in ready!!!!!
-
2005-03-17soldstatus $66,500
-
1999-03-02soldstatus $22,250
ⓘ Source: listings_history table (triggers on properties + properties_extension) + one-shot
backfill from property_details.listing_events for pre-trigger history.
Tax reassessment forecast FL · Resets to sale price
- Current annual tax
- $2,608 · $217/mo
- Projected year-2 tax
- $2,608 · $217/mo
- Expected delta
- $0/yr ($0/mo · 0.0%)
ⓘ Screening estimate from a state-policy table — verify with the county assessor before closing.
Climate risk First Street
- Flood 1/10 Low FEMA zone X (unshaded) · 0% chance over 30 yrs
- Wildfire 7/10 Severe
- Heat 8/10 Severe 7 d/yr ≥108°F today · 20 d/yr by 30 yrs out
- Wind 9/10 Extreme 99% chance of damaging wind over 30 yrs
- Air quality 3/10 Moderate 3 unhealthy d/yr today · 3 by 30 yrs out
Nearby sold comps map
Loading sold comps map…
Walkable amenities ~0.75 mi
Loading nearby amenities…
Taxation est. · year 1
- Rental income
- $15,477
- − Mortgage interest
- −$11,203
- − Property taxes
- −$2,608
- − Insurance
- −$1,000
- − Repairs & maintenance
- −$1,238
- − Management
- −$1,238
- − Depreciation
- −$5,818
- Taxable loss
- −$7,629
- Est. tax savings @ 24.0%
- +$1,831
- After-tax cash flow
- $-2,136/yr
For passive investors: Depreciation is non-cash, so a rental often shows a tax loss while cash-flowing — sheltering income. Rental losses are passive: they offset passive income freely, and up to $25,000/yr can offset ordinary (W-2) income if you actively participate and your MAGI is under $100k (phasing out to $0 by $150k); unused losses carry forward. On sale, claimed depreciation is recaptured at up to 25%, and gains may owe capital-gains tax (a 1031 exchange can defer both). Figures are a year-1 estimate at your 24.0% rate — not tax advice; consult a CPA.
Schools (NCES district)
- District
- Clay
- NCES district ID
- 1200300
- Math proficiency
- 58% ▼ -8.00%
- Reading proficiency
- 59% ▼ -3.00%
- Median HH income
- $59,379
- Composite
- 50.73/100
- National rank
- #1815
- State rank
- #14 of 73 in FL
Livability — Keystone Heights
- Score
- 80/100
- State rank
- #109
- US rank
- #1684
Category grades
Schools grade is shown separately in the Schools card above.
Census & demographics
- Population (ZIP)
- 15,630
Population outlook (Clay County) Hauer SSP2
- Today (2025)
- 230,495 people
- By 2030
- 242,427 · +5.2%
- By 2040
- 262,244 · +13.8%
- By 2050
- 275,148 · +19.4%
- By 2075
- 295,397 · +28.2%
- By 2100
- 287,592 · +24.8%
Race, ethnicity, and origin ACS 2023
- Neighborhood character
- Predominantly White (82%)
- Race & ethnicity
- White 82% Two or more races 10% Hispanic / Latino 5% Black 4%
- Hispanic origin (detail)
- Mexican 2%
- Common ancestry
- Lithuanian 3% Slovak 2% Portuguese 2%
- Foreign-born
- 2% · Canada
- Languages at home
- 98% English-only · Spanish 1%
Political lean MEDSL · Clay
- 2024 margin
- Solid R (+39.3) · D 29.9% · R 69.2%
- 2008→2024 swing
- +3.6pp toward D · 2008: -42.8pp · 2024: -39.3pp
- All cycles
- 2024: R+39.3 2020: R+37.1 2016: R+44.3 2012: R+45.8 2008: R+42.8
Not yet ingested
- Civics
- —
Market trends
- HPI YoY
- ▼ -27.65%
- Current HPI
- 344.7744
- Rent YoY
- —
- Metro
- —
- State GDP YoY
- ▲ 3.28%
- F500 in state
- 36
Industry mix (Fortune 500 HQ in FL)
| Industry | F500 HQs | Revenue |
|---|---|---|
| Industrial Technology | 2 | $29B |
|
||
| Insurance | 2 | $17B |
|
||
| Retail | 1 | $60B |
|
||
| Technology Distribution | 1 | $58B |
|
||
| Homebuilding | 1 | $35B |
|
||
| Technology Manufacturing | 1 | $35B |
|
||
Price history
+798.9% since first listed6 events — show timeline
- 2026-02-27 Listed $199,999 realMLS
- 2020-08-28 Sold (MLS) $119,900 realMLS
- 2020-07-06 Pending — realMLS
- 2020-06-30 Listed $119,900 realMLS
- 2005-03-17 Sold (Public Records) $66,500 Public Records
- 1999-03-02 Sold (Public Records) $22,250 Public Records
Property tax history
+16.8%/yrLatest (2025): $2,608 · +9.0% YoY. Source: county tax records.
Cash-flow waterfall
monthlySold comps — $/sqft
last 12 mo · ≤1 miLoading sold comps…