523 Lenora Dr Unit A&B · Taylor, TX
Flood risk 1/10 · Minimal
- FEMA flood zone
- X (unshaded)
- Chance of flooding over 30 yrs
- 0.0%
- Est. flood insurance / yr
- $507 – $1,088
Fire risk 2/10 · Minimal
- Est. fire insurance / yr
- $1,222 – $2,270
Heat risk 8/10 · Major
- Hot days now (above 108°F)
- 7 days/yr
- Hot days in 30 yrs
- 23 days/yr
Wind risk 8/10 · Major
- Chance of severe wind over 30 yrs
- 80.0%
Air-quality risk 2/10 · Minimal
- Unhealthy air days now
- 0 days/yr
- Unhealthy air days in 30 yrs
- 1 days/yr
Risk factors via First Street. Map © Google.
Why this score? — see what drove the D+ grade
The composite is a weighted blend of 9 inputs, each scored 0–100. Each bar is that input's sub-score; the figure is the points it added to the 100-point composite (weight × sub-score).
- Cash flow +18.3/30.0
- ARV discount +7.5/15.0
- DSCR +5.8/10.0
- 1% rule +4.9/10.0
- Livability +3.6/5.0
- Rent growth +2.6/5.0
- Condition / age +2.2/5.0
- Schools +2.0/10.0
- Appreciation +0.0/10.0
$240,000
🖨 Deal sheet 📄 Offer letter ✓ Due diligence
Listing remarks MLS
DO NOT DISTURB TENANTS. All showings must be scheduled and approved through the listing agent. Property is being sold as-is. Amazing investment opportunity! This duplex is close to the new Samsung site.
Key facts
- Duplex
- 0.25 acre lot
- Built 1996
Tags
Neighborhood map
What this means for you Summary
Snapshot
- This is a 4-bed/2.0-bath condo listed at $240k. Condition is rated fair.
Deal economics
- At list price, monthly cash flow is $222 ($3k/yr) — positive.
- The deal already cash-flows at list — no discount required.
- To meet the 1% rule (rent ≥ 1% of price), the offer needs to be $238k (0.8% below list).
- Recommended offer: $218k (9.0% below list) — sets the bar for market timing.
- Cap rate 7.4% vs local median 4.3% in Taylor — top-decile yield for the area; either an underpriced asset or a hidden risk that comps aren't pricing in. Stress-test before assuming the spread holds.
Location & tenants
- Location reads 71/100 on livability (#312 in TX) — a middle-class / working-renter tenant base. Strengths: cost of living A+, housing A+; Watch: employment C-, schools D-, amenities F.
- Taylor ISD (town): math 20% / reading 27% proficiency, ranked #726 of 826 in TX (top 88%) — low school quality limits family demand, transient renter base, plan for 1-2y turnover; 61% free/reduced lunch — lower-income household profile, screen leases tightly.
- Market conditions: Rents flat; 314 active listings in the ZIP; 8 comparable units currently listed for rent nearby; rentals at typical pace (median 24d on market — plan ~3-4 weeks tenant-placement turnaround); solid renter incomes; 7,543 units permitted in Williamson County in 2024 (1,425 in 5+ unit buildings).
- This rent runs 36% of the median local income ($79k/yr) — at the standard rent-burdened threshold; future hikes will face affordability resistance.
Forward outlook
- Local home prices are declining (-3.0%/yr); year-one equity from $2k of loan paydown is wiped out by about $7k of value loss. Plan a longer hold.
- Williamson County population projected at +69% by 2050 — long-run rental-demand tailwind backs the buy-and-hold thesis.
Negotiation context
- It's been on market 92 days — a 9% lower offer ($218k) is reasonable based on typical stale-listing flexibility.
Risks & watch-outs
- Climate carrying-cost: severe wind risk, 80% chance of damaging wind over 30y; extreme-heat days projected 7→23/yr by 2055 (HVAC capex compounding) — expect insurance premiums to compound above CPI over the hold.
Questions for the listing agent
- It's been on market 92 days. Have you received any prior offers? Is the seller open to a 9% concession, seller financing, or rate buy-down credit?
- Have any recent inspections been done? Can we get a copy of the seller's disclosures and any deferred-maintenance estimates?
- Any open or pending special assessments — roof, HVAC, plumbing, elevator, façade? What's the per-unit balance and payoff schedule, and is the seller paying it off at close or rolling it to the buyer?
- Why hasn't it sold? Are there any deal-killer items the seller is aware of (foundation, flood, title, zoning, code violations)?
- Is there a deadline driving the sale (1031 exchange, divorce, estate, relocation)? That informs how much negotiation room exists.
- Schools are D-rated, which usually means shorter tenancies and higher turnover. Who's the typical renter profile here, and what's been the actual vacancy rate?
- The area grade is low — what's the realistic commute time and amenity access for the typical tenant pool here? Any planned neighborhood developments (good or bad) we should know about?
- What's the average days-on-market for RENTAL listings here right now (not sales)? A rising rental-DOM trend means longer vacancies and softer asking-rent achievability than the comps imply.
- What's the recent tenant-quality profile in this submarket — average credit score on applications, eviction rate, late-payment / NSF rate, and stable-employment percentage? A property-management company in the area should have these aggregated.
- How much new apartment / multifamily construction is in the pipeline within 1–3 miles? Heavy new supply (>2% of stock underway) typically softens rents 12–24 months out; light construction supports rent growth.
Investment metrics
- 1% rule
- 0.99% ✗
- Cap rate
- 7.40%
- Cash-on-cash
- 3.96%
- DSCR
- 1.18
- GRM
- 8.4
CMA / ARV
No comps found within radius.
Projected returns pro-forma
-3.0% appreciation · 0.43% rent growth · sell at horizon
- IRR
- -13.0%
- Equity multiple
- 0.54×
- Total profit
- $-30,738
- Equity at exit
- $35,785
- IRR
- -8.6%
- Equity multiple
- 0.53×
- Total profit
- $-31,830
- Equity at exit
- $20,751
Cash invested: $67,200 (down + closing). Projections, not guarantees.
Landlord ↔ Tenant lean methodology
- Overall (STATE)
- 87 Strongly Landlord-Friendly
- State Texas
- 87 Strongly Landlord-Friendly · R+5
- County
- — inherits STATE
- City
- — inherits STATE
ZIP-level market 76574
- Home prices YoY
- -32.3%
- Rents YoY
- 0.4%
- Active inventory
- 314
- Price-to-rent
- 8.4×
Monthly cashflow live
- Estimated rent
- $2,380 high interval (Pro) →
- Mortgage (P&I)
- −$1,259
- Tax est. 1.5%
- −$300 /mo · $3,600/yr
- Insurance
- −$100
- HOA
- −$0
- Vacancy / Maint / Mgmt
- −$500
- Net cashflow
- $222
Break-even live
UW: 25.0% down · 7.5% · 30yr · 1.5% tax · 5.0% vac · 8.0% maint · 8.0% mgmt
Financing live
Cash to close
- Down payment
- $60,000
- Closing costs
- $7,200
- Reserves months
- —
- Total cash needed
- —
Loan-product check · same deal, 3 products live
Conventional
25% down · 7.5% · 30yr
- Down + closing
- —
- Monthly P&I
- —
- Monthly cashflow
- —
- DSCR
- —
- Eligible?
- —
Personal DTI + credit; lowest rate.
DSCR
20% down · 8.5% · 30yr
- Down + closing
- —
- Monthly P&I
- —
- Monthly cashflow
- —
- DSCR
- —
- Eligible?
- —
No personal income docs; deal must DSCR.
Hard money
10% down · 12.0% · 12mo
- Down + closing
- —
- Monthly P&I
- —
- Monthly cashflow
- —
- DSCR
- —
- Eligible?
- —
Short-term bridge; refi at stabilization.
Rent comps 8 comps
| Address | Beds | Baths | Sqft | Rent | $/sqft | DOM | Units | Dist |
|---|---|---|---|---|---|---|---|---|
| 206 Oscar St Taylor, TX | 4.0 | 1.5 | 1960 | $2,100 | $1.07 | 1d | 1 | 0.29mi |
| 1215 Davis St Taylor, TX | 4.0 | 2.5 | 2220 | $3,200 | $1.44 | 23d | 1 | 0.81mi |
| 600 Kimbro St Taylor, TX | 3.0 | 2.5 | 1480 | $2,250 | $1.52 | 23d | 1 | 0.95mi |
| 1707 Lexington St Taylor, TX | 3.0 | 2.0 | 2140 | $2,500 | $1.17 | 23d | 1 | 1.00mi |
| 1117 W 4th St Taylor, TX | 3.0 | 2.0 | 1334 | $1,400 | $1.05 | 17d | 1 | 1.27mi |
| 1800 Grace St Taylor, TX | 4.0 | 3.5 | 2503 | $2,050 | $0.82 | 11d | 1 | 1.43mi |
| 1800 Grace St Taylor, TX | 3.0 | 2.0 | 2503 | $2,050 | $0.82 | 12d | 1 | 1.43mi |
| 1006 Cottonbowl Dr Taylor, TX | 4.0 | 2.0 | 1615 | $2,300 | $1.42 | 43d | 1 | 1.48mi |
HOA detail condo
- Monthly dues
- $0 · $0/yr
- Assessments
- None detected in remarks — confirm with the listing agent.
Listing history 15 events
-
2026-06-18days on market $240,000 Active 92 DOM
-
2026-06-17days on market $240,000 Active 91 DOM
-
2026-06-16days on market $240,000 Active 90 DOM
-
2026-06-15days on market $240,000 Active 89 DOM
-
2026-06-13days on market $240,000 Active 87 DOM
-
2026-06-09days on market $240,000 Active 83 DOM
-
2026-06-08days on market $240,000 Active 82 DOM
-
2026-06-07days on market $240,000 Active 81 DOM
-
2026-06-05days on market $240,000 Active 78 DOM
-
2026-06-03days on market $240,000 Active 77 DOM
-
2026-06-02days on market $240,000 Active 76 DOM
-
2026-06-01days on market $240,000 Active 75 DOM
-
2026-05-31days on market $240,000 Active 74 DOM
-
2026-05-19price $240,000 202-char remark
Show marketing remark (202 chars)
DO NOT DISTURB TENANTS. All showings must be scheduled and approved through the listing agent. Property is being sold as-is. Amazing investment opportunity! This duplex is close to the new Samsung site.
-
2026-03-18$274,900 Active 202-char remark
Show marketing remark (202 chars)
DO NOT DISTURB TENANTS. All showings must be scheduled and approved through the listing agent. Property is being sold as-is. Amazing investment opportunity! This duplex is close to the new Samsung site.
ⓘ Source: listings_history table (triggers on properties + properties_extension) + one-shot
backfill from property_details.listing_events for pre-trigger history.
Climate risk First Street
- Flood 1/10 Low FEMA zone X (unshaded) · 0% chance over 30 yrs
- Wildfire 2/10 Low
- Heat 8/10 Severe 7 d/yr ≥108°F today · 23 d/yr by 30 yrs out
- Wind 8/10 Severe 80% chance of damaging wind over 30 yrs
- Air quality 2/10 Low 0 unhealthy d/yr today · 1 by 30 yrs out
Nearby sold comps map
Loading sold comps map…
Walkable amenities ~0.75 mi
Loading nearby amenities…
Taxation est. · year 1
- Rental income
- $28,561
- − Mortgage interest
- −$13,444
- − Property taxes
- −$3,600
- − Insurance
- −$1,200
- − Repairs & maintenance
- −$2,285
- − Management
- −$2,285
- − Depreciation
- −$6,982
- Taxable loss
- −$1,235
- Est. tax savings @ 24.0%
- +$296
- After-tax cash flow
- $2,956/yr
For passive investors: Depreciation is non-cash, so a rental often shows a tax loss while cash-flowing — sheltering income. Rental losses are passive: they offset passive income freely, and up to $25,000/yr can offset ordinary (W-2) income if you actively participate and your MAGI is under $100k (phasing out to $0 by $150k); unused losses carry forward. On sale, claimed depreciation is recaptured at up to 25%, and gains may owe capital-gains tax (a 1031 exchange can defer both). Figures are a year-1 estimate at your 24.0% rate — not tax advice; consult a CPA.
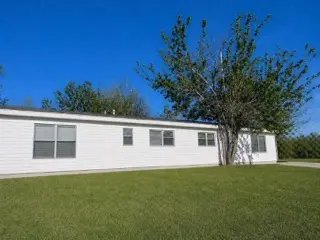
Condition & rehab AI · 5 photos
This multi-family property requires significant exterior repairs and maintenance, including painting, roof repair, and landscaping. While it presents an investment opportunity, substantial work is needed to improve its condition and value.
Repairs flagged
- Major siding — Severe weathering
- Major roof — Visible damage
- Major landscaping — Overgrown lawn
Value-add opportunities
- Both paint exterior — Enhances curb appeal and value
- Both repair roof — Fixes major structural issue
- Both landscaping — Improves curb appeal and value
Renovation cost estimate screening
| Repair item | Severity | Est. cost |
|---|---|---|
| siding · Severe weathering | Major | $15,000–50,000 |
| roof · Visible damage | Major | $15,000–50,000 |
| landscaping · Overgrown lawn | Major | $15,000–50,000 |
| Total estimated repair cost · 3 items | $45,000–150,000 |
Value-add ROI direction
- Both paint exterior — Enhances curb appeal and value ↑
- Both repair roof — Fixes major structural issue ↑
- Both landscaping — Improves curb appeal and value ↑
ⓘ Cost ranges are severity-bucket heuristics (US national rule-of-thumb). Get contractor quotes + a written scope before underwriting a rehab budget.
Schools (NCES district)
- District
- Taylor ISD
- NCES district ID
- 4842280
- Math proficiency
- 20% ▼ -15.00%
- Reading proficiency
- 27% ▼ -11.00%
- Median HH income
- $45,330
- Composite
- 20.35/100
- National rank
- #8606
- State rank
- #726 of 826 in TX
Livability — Taylor
- Score
- 71/100
- State rank
- #312
- US rank
- #7013
Category grades
Schools grade is shown separately in the Schools card above.
Census & demographics
- Census place
- Taylor, TX
- County
- Williamson County · 680,029 people
- City population
- 20,242
- Metro
- Austin-Round Rock-Georgetown, TX
- Population (ZIP)
- 20,242
- Household income
- $78,568
- Rent vs Own
- Severe rent burden
- 371.0
Population outlook (Williamson County) Hauer SSP2
- Today (2025)
- 699,027 people
- By 2030
- 795,537 · +13.8%
- By 2040
- 990,683 · +41.7%
- By 2050
- 1,184,292 · +69.4%
- By 2075
- 1,623,825 · +132.3%
- By 2100
- 1,924,153 · +175.3%
Race, ethnicity, and origin ACS 2023
- Neighborhood character
- Diverse neighborhood (Simpson 0.57)
- Race & ethnicity
- White 50% Hispanic / Latino 42% Two or more races 22% Black 5%
- Hispanic origin (detail)
- Mexican 37%
- Common ancestry
- Romanian 2% Italian 1% Lithuanian 1%
- Foreign-born
- 8% · Canada
- Languages at home
- 74% English-only · Spanish 23% Russian/Polish/Slavic 1%
Political lean MEDSL · Williamson
- 2024 margin
- Toss-up / Even · D 48.0% · R 50.4% · Other 1.6%
- 2008→2024 swing
- +10.6pp toward D · 2008: -13.0pp · 2024: -2.5pp
- All cycles
- 2024: R+2.5 2020: D+1.4 2016: R+9.9 2012: R+21.5 2008: R+13.0
Not yet ingested
- Civics
- —
Market trends
- HPI YoY
- ▼ -108.71%
- Current HPI
- 227.58
- Rent YoY
- ▲ 0.43%
- Metro
- Austin-Round Rock-Georgetown, TX
- State GDP YoY
- ▲ 3.95%
- F500 in state
- 110
Industry mix (Fortune 500 HQ in TX)
| Industry | F500 HQs | Revenue |
|---|---|---|
| Energy | 16 | $1,198B |
|
||
| Technology | 5 | $198B |
|
||
| Engineering / Construction | 4 | $72B |
|
||
| Energy Services | 3 | $60B |
|
||
| Utilities | 3 | $41B |
|
||
| Healthcare | 2 | $330B |
|
||
Price history
-12.7% since first listed2 events — show timeline
- 2026-05-19 Price Changed $240,000 Unlock MLS
- 2026-03-18 Listed $274,900 Unlock MLS
Cash-flow waterfall
monthlySold comps — $/sqft
last 12 mo · ≤1 miLoading sold comps…