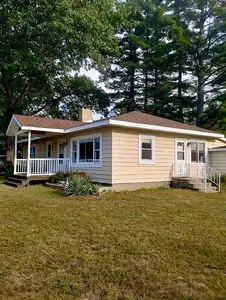
3872 S Hillcrest Rd · Bass Lake, IN
Flood risk 4/10 · Minor
- FEMA flood zone
- X (unshaded)
- Chance of flooding over 30 yrs
- 0.21%
- Est. flood insurance / yr
- $507 – $1,088
Fire risk 1/10 · Minimal
- Est. fire insurance / yr
- $717 – $1,331
Heat risk 2/10 · Minimal
- Hot days now (above 100°F)
- 7 days/yr
- Hot days in 30 yrs
- 16 days/yr
Wind risk 2/10 · Minimal
- Chance of severe wind over 30 yrs
- —
Air-quality risk 3/10 · Minor
- Unhealthy air days now
- 2 days/yr
- Unhealthy air days in 30 yrs
- 3 days/yr
Risk factors via First Street. Map © Google.
Why this score? — see what drove the C- grade
The composite is a weighted blend of 9 inputs, each scored 0–100. Each bar is that input's sub-score; the figure is the points it added to the 100-point composite (weight × sub-score).
- Cash flow +27.2/30.0
- DSCR +9.5/10.0
- 1% rule +6.4/10.0
- Livability +3.1/5.0
- Schools +2.6/10.0
- Rent growth +2.5/5.0
- Condition / age +2.5/5.0
- ARV discount +0.0/15.0
- Appreciation +0.0/10.0
$279,900
🖨 Deal sheet 📄 Offer letter ✓ Due diligence
Listing remarks MLS
Spacious like new home at Bass Lake- Move right into this beautifully finished home in Boa Shores, with access to Bass Lake beach and slips. Excellent room layout with tastefully upgraded finishes throughout. Large kitchen with eating area. Stainless steel appliances. Quartz countertops. Living room with a charming fireplace. Laundry, attached garage and gorgeous front deck for morning coffee. New roof 2024. Whether you are looking for a vacation home or full-time residence this property lacks nothing.
Key facts
- Quartz countertops
- New kitchen
- Boat launch
Tags
Property features AI
Exterior
- Parking: Attached garage (1 space); Additional gravel parking; Garage faces side; Garage door opener
- Utilities: Well water; Public sewer; 100 Amp electric service; Natural gas connected; Electricity connected; Water connected; Sewer connected; Cable available
- Home design: One-story home; Built in 1950
- Construction: Shingle roof; Crawl space foundation
- Exterior features: Private yard; Covered patio/porch; Neighborhood view
Interior
- Kitchen: Dishwasher; Stainless steel appliances; Refrigerator; Microwave; Gas range
- Bedrooms: Primary bedroom; Bedroom 2; Bedroom 3
- Flooring: Carpet; Tile; Laminate
- Bathrooms: 1 full bathroom
- Heating & cooling: Forced air heating; Central air conditioning
- Interior features: Eat-in kitchen; Recessed lighting; Living room fireplace
- Laundry & utility: Laundry on main level
Neighborhood map
What this means for you Summary
Snapshot
- This is a 3-bed/1.0-bath single-family listed at $280k.
Deal economics
- At list price, monthly cash flow is $801 ($10k/yr) — positive.
- The deal already cash-flows at list — no discount required.
- Meets the 1% rule at list price ($3k rent vs $280k).
- Cap rate 9.7% vs local median 4.5% in Bass Lake — top-decile yield for the area; either an underpriced asset or a hidden risk that comps aren't pricing in. Stress-test before assuming the spread holds.
Location & tenants
- Location reads 61/100 on livability (#494 in IN) — a middle-class / working-renter tenant base. Strengths: crime A+, cost of living A+, housing A; Watch: employment C-, schools F, amenities F.
- Culver Community Schools Corporation (rural): math 27% / reading 35% proficiency, ranked #236 of 301 in IN (top 78%) — families likely to look elsewhere, expect single-tenant / working-renter base with shorter leases.
- Market conditions: 146 active listings in the ZIP; 1 comparable units currently listed for rent nearby; 58 units permitted in Starke County in 2024 (0 in 5+ unit buildings).
Forward outlook
- Local home prices are declining (-3.0%/yr); year-one equity from $2k of loan paydown is wiped out by about $8k of value loss. Plan a longer hold.
- Starke County population projected at -23% by 2050 — secular population decline; favor cash flow + early exit over multi-decade hold.
- At projected returns (-3.0% appreciation + 3.0% rent growth), your $78k cash investment doubles in ~10 years — after that, you're playing with house money.
Negotiation context
- Only 9 days on market — expect competitive offers; lowballing is unlikely to land.
- 3 sale attempts with the ask held roughly flat each time — persistent listings suggest the price (not the market) is what's stuck; bring a comps-based counter.
Risks & watch-outs
- Watch-outs: built in 1950 — expect roof / HVAC / electrical / plumbing capex.
Questions for the listing agent
- Built in 1950 — when were the roof, HVAC, electrical panel, plumbing, and water heater last replaced?
- Is there a deadline driving the sale (1031 exchange, divorce, estate, relocation)? That informs how much negotiation room exists.
- Schools are F-rated, which usually means shorter tenancies and higher turnover. Who's the typical renter profile here, and what's been the actual vacancy rate?
- What's the average days-on-market for RENTAL listings here right now (not sales)? A rising rental-DOM trend means longer vacancies and softer asking-rent achievability than the comps imply.
- What's the recent tenant-quality profile in this submarket — average credit score on applications, eviction rate, late-payment / NSF rate, and stable-employment percentage? A property-management company in the area should have these aggregated.
- How much new for-sale + rental construction is in the pipeline within 1–3 miles? Heavy new supply typically softens prices + rents 12–24 months out; constrained supply supports both.
Investment metrics
- 1% rule
- 1.14% ✓
- Cap rate
- 9.73%
- Cash-on-cash
- 12.27%
- DSCR
- 1.55
- GRM
- 7.3
CMA / ARV
- ARV (median comp)
- $192,937
- List price
- $279,900
- Delta
- 45.07%
- Verdict
- OVERPRICED
- Comps
- 16 within 1.0 mi
Show comp detail 2 sales within ~0.75 mi
| Address | Dist | Beds/Ba | Sqft | Sold | Price | $/sf | Match |
|---|---|---|---|---|---|---|---|
| 3898 S 625 East | 0.08mi | 2/1.5 (-1) | 1,164 (+2%) | 22mo | $189,000 | $162 | 68 |
| 4218 S North Shore Dr | 0.42mi | 2/2.0 (-1) | 1,312 (+15%) | 14mo | $300,000 | $229 | 36 |
Match score weights: distance 35% · size 25% · config 20% · recency 20%. Top-matched comps best support the ARV.
Projected returns pro-forma
-3.0% appreciation · 3.0% rent growth · sell at horizon
- IRR
- 1.9%
- Equity multiple
- 1.07×
- Total profit
- $5,591
- Equity at exit
- $41,734
- IRR
- 11.4%
- Equity multiple
- 1.90×
- Total profit
- $70,251
- Equity at exit
- $24,201
Cash invested: $78,372 (down + closing). Projections, not guarantees.
Landlord ↔ Tenant lean methodology
- Overall (STATE)
- 90 Strongly Landlord-Friendly
- State Indiana
- 90 Strongly Landlord-Friendly · R+11
- County
- — inherits STATE
- City
- — inherits STATE
ZIP-level market 46534
- Home prices YoY
- -19.2%
- Active inventory
- 146
- Price-to-rent
- 7.3×
Monthly cashflow live
- Estimated rent
- $3,200 medium interval (Pro) →
- Mortgage (P&I)
- −$1,468
- Tax from tax record
- −$142 /mo · $1,709/yr
- Insurance
- −$117
- HOA
- −$0
- Vacancy / Maint / Mgmt
- −$672
- Net cashflow
- $801
Break-even live
UW: 25.0% down · 7.5% · 30yr · 1.5% tax · 5.0% vac · 8.0% maint · 8.0% mgmt
Financing live
Cash to close
- Down payment
- $69,975
- Closing costs
- $8,397
- Reserves months
- —
- Total cash needed
- —
Loan-product check · same deal, 3 products live
Conventional
25% down · 7.5% · 30yr
- Down + closing
- —
- Monthly P&I
- —
- Monthly cashflow
- —
- DSCR
- —
- Eligible?
- —
Personal DTI + credit; lowest rate.
DSCR
20% down · 8.5% · 30yr
- Down + closing
- —
- Monthly P&I
- —
- Monthly cashflow
- —
- DSCR
- —
- Eligible?
- —
No personal income docs; deal must DSCR.
Hard money
10% down · 12.0% · 12mo
- Down + closing
- —
- Monthly P&I
- —
- Monthly cashflow
- —
- DSCR
- —
- Eligible?
- —
Short-term bridge; refi at stabilization.
Rent comps 1 comps
| Address | Beds | Baths | Sqft | Rent | $/sqft | DOM | Units | Dist |
|---|---|---|---|---|---|---|---|---|
| 4850 S County Road 210 Knox, IN | 2.0 | 1.0 | 926 | $3,200 | $3.46 | 24d | 1 | 1.10mi |
Listing history 19 events
-
2026-06-19days on market $279,900 Active 9 DOM
-
2026-06-18days on market $279,900 Active 8 DOM
-
2026-06-17days on market $279,900 Active 7 DOM
-
2026-06-16days on market $279,900 Active 6 DOM
-
2026-06-15days on market $279,900 Active 5 DOM
-
2026-06-14days on market $279,900 Active 3 DOM
-
2026-06-12remarks 699-char remark
-
2026-06-12days on market $279,900 Active 2 DOM
-
2026-06-09days on market $279,900 Active 28 DOM
-
2026-06-08days on market $279,900 Active 27 DOM
-
2026-06-07days on market $279,900 Active 26 DOM
-
2026-06-07days on market $279,900 Active 25 DOM
-
2026-06-02days on market $279,900 Active 21 DOM
-
2026-06-01days on market $279,900 Active 20 DOM
-
2026-05-31days on market $279,900 Active 19 DOM
-
2026-05-30days on market $279,900 Active 18 DOM
-
2026-05-12$279,900 Active 507-char remark
Show marketing remark (507 chars)
Spacious like new home at Bass Lake- Move right into this beautifully finished home in Boa Shores, with access to Bass Lake beach and slips. Excellent room layout with tastefully upgraded finishes throughout. Large kitchen with eating area. Stainless steel appliances. Quartz countertops. Living room with a charming fireplace. Laundry, attached garage and gorgeous front deck for morning coffee. New roof 2024. Whether you are looking for a vacation home or full-time residence this property lacks nothing.
-
2026-04-09historical
-
2025-10-06$298,000 Active
ⓘ Source: listings_history table (triggers on properties + properties_extension) + one-shot
backfill from property_details.listing_events for pre-trigger history.
Tax reassessment forecast IN · Partial reset (capped growth)
- Current annual tax
- $1,709 · $142/mo
- Projected year-2 tax
- $2,044 · $170/mo
- Expected delta
- +$335/yr (+$28/mo · 19.6%)
ⓘ Screening estimate from a state-policy table — verify with the county assessor before closing.
Climate risk First Street
- Flood 4/10 Moderate FEMA zone X (unshaded) · 21% chance over 30 yrs
- Wildfire 1/10 Low
- Heat 2/10 Low 7 d/yr ≥100°F today · 16 d/yr by 30 yrs out
- Wind 2/10 Low
- Air quality 3/10 Moderate 2 unhealthy d/yr today · 3 by 30 yrs out
Nearby sold comps map
Loading sold comps map…
Walkable amenities ~0.75 mi
Loading nearby amenities…
Taxation est. · year 1
- Rental income
- $38,400
- − Mortgage interest
- −$15,679
- − Property taxes
- −$1,709
- − Insurance
- −$1,400
- − Repairs & maintenance
- −$3,072
- − Management
- −$3,072
- − Depreciation
- −$8,143
- Taxable income
- $5,326
- Est. tax owed @ 24.0%
- −$1,278
- After-tax cash flow
- $8,336/yr
For passive investors: Depreciation is non-cash, so a rental often shows a tax loss while cash-flowing — sheltering income. Rental losses are passive: they offset passive income freely, and up to $25,000/yr can offset ordinary (W-2) income if you actively participate and your MAGI is under $100k (phasing out to $0 by $150k); unused losses carry forward. On sale, claimed depreciation is recaptured at up to 25%, and gains may owe capital-gains tax (a 1031 exchange can defer both). Figures are a year-1 estimate at your 24.0% rate — not tax advice; consult a CPA.
Schools (NCES district)
- District
- Culver Community Schools Corporation
- NCES district ID
- 1802520
- Math proficiency
- 27% ▼ -9.00%
- Reading proficiency
- 35% ▼ -5.00%
- Median HH income
- $43,718
- Composite
- 26.41/100
- National rank
- #7227
- State rank
- #236 of 301 in IN
Livability — Bass Lake
- Score
- 61/100
- State rank
- #494
- US rank
- #17594
Category grades
Schools grade is shown separately in the Schools card above.
Census & demographics
- Census place
- Bass Lake, IN
- Population (ZIP)
- 11,029
Population outlook (Starke County) Hauer SSP2
- Today (2025)
- 21,860 people
- By 2030
- 21,024 · -3.8%
- By 2040
- 19,041 · -12.9%
- By 2050
- 16,881 · -22.8%
- By 2075
- 11,880 · -45.7%
- By 2100
- 7,217 · -67.0%
Race, ethnicity, and origin ACS 2023
- Neighborhood character
- Predominantly White (92%)
- Race & ethnicity
- White 92% Hispanic / Latino 4% Two or more races 3%
- Common ancestry
- Romanian 5% Lithuanian 2% Slovak 2%
- Foreign-born
- 2% · Canada
- Languages at home
- 96% English-only · Spanish 2% Other Indo-European 2% German/W. Germanic 1%
Political lean MEDSL · Starke
- 2024 margin
- Solid R (+52.0) · D 23.2% · R 75.3% · Other 1.5%
- 2008→2024 swing
- -55.3pp toward R · 2008: 3.2pp · 2024: -52.0pp
- All cycles
- 2024: R+52.0 2020: R+46.8 2016: R+42.0 2012: R+10.6 2008: D+3.2
Not yet ingested
- Civics
- —
Market trends
- HPI YoY
- ▼ -58.15%
- Current HPI
- 244.2216
- Rent YoY
- —
- Metro
- —
- State GDP YoY
- ▲ 2.90%
- F500 in state
- 18
Industry mix (Fortune 500 HQ in IN)
| Industry | F500 HQs | Revenue |
|---|---|---|
| Industrial Machinery | 2 | $37B |
|
||
| Healthcare | 1 | $177B |
|
||
| Pharmaceuticals | 1 | $45B |
|
||
| Metals / Steel | 1 | $18B |
|
||
| Agriculture | 1 | $17B |
|
||
| Packaging | 1 | $12B |
|
||
Price history
-6.1% since first listed4 events — show timeline
- 2026-06-10 Listed $279,900 NIRA MLS as Distributed by MLS Grid
- 2026-05-12 Listed $279,900 FSBO.com
- 2026-04-09 Listing Removed — NIRA MLS as Distributed by MLS Grid
- 2025-10-06 Listed $298,000 NIRA MLS as Distributed by MLS Grid
Property tax history
+6.8%/yrLatest (2024): $1,709 · +10.3% YoY. Source: county tax records.
Cash-flow waterfall
monthlySold comps — $/sqft
last 12 mo · ≤1 miLoading sold comps…