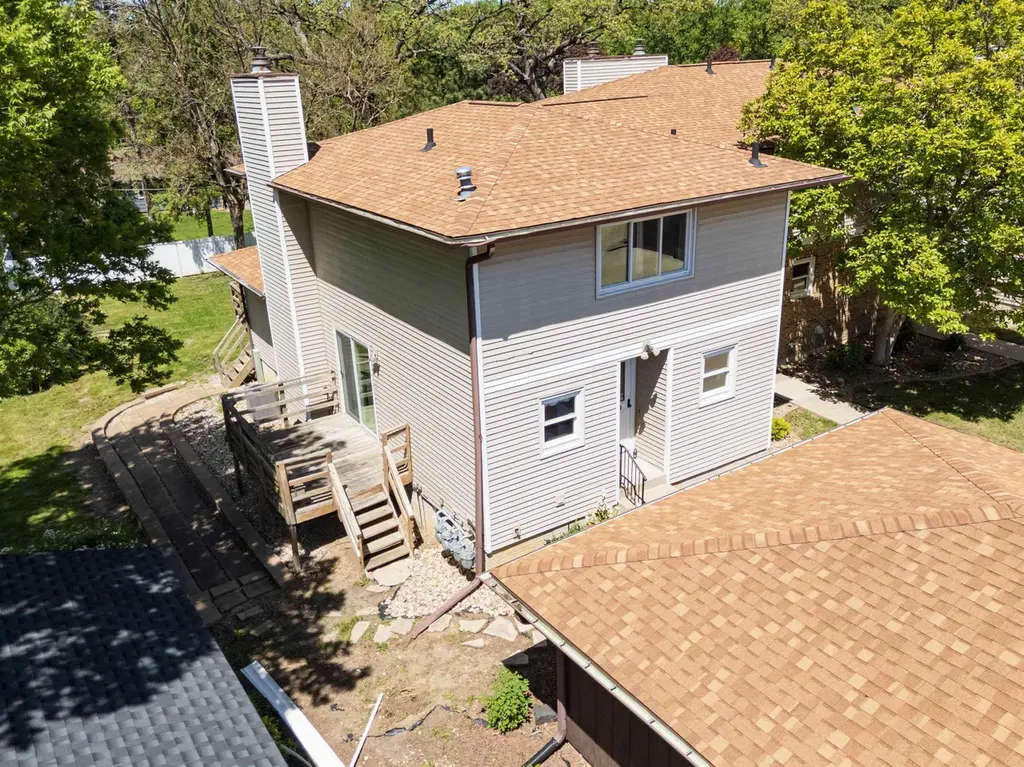
2122 Bicentennial Dr · Cedar Falls, IA
Flood risk 1/10 · Minimal
- FEMA flood zone
- X (unshaded)
- Chance of flooding over 30 yrs
- 0.0%
- Est. flood insurance / yr
- $507 – $1,088
Fire risk 2/10 · Minimal
- Est. fire insurance / yr
- $902 – $1,676
Heat risk 3/10 · Minor
- Hot days now (above 101°F)
- 7 days/yr
- Hot days in 30 yrs
- 15 days/yr
Wind risk 2/10 · Minimal
- Chance of severe wind over 30 yrs
- —
Air-quality risk 1/10 · Minimal
- Unhealthy air days now
- 0 days/yr
- Unhealthy air days in 30 yrs
- 0 days/yr
Risk factors via First Street. Map © Google.
Why this score? — see what drove the C- grade
The composite is a weighted blend of 9 inputs, each scored 0–100. Each bar is that input's sub-score; the figure is the points it added to the 100-point composite (weight × sub-score).
- ARV discount +15.0/15.0
- Cash flow +12.7/30.0
- Schools +6.6/10.0
- 1% rule +4.7/10.0
- Livability +4.0/5.0
- DSCR +3.8/10.0
- Rent growth +3.0/5.0
- Condition / age +2.5/5.0
- Appreciation +0.0/10.0
$189,999
🖨 Deal sheet 📄 Offer letter ✓ Due diligence
Listing remarks MLS
A great Value! This 3 bedroom, 2.5 bath 2 story condo situated in central Cedar Falls offers a private location, main level master suite plus 2 spacious bedrooms on the second level. Great room with fireplace, 2 decks and main floor laundry too. All appliances included, new carpet, fresh paint , great storage and double garage provide a great "total package" opportunity,
Key facts
- Newer mechanicals
- Main-floor laundry
- New roof
Tags
Property features AI
Finance
- HOA & community: Homeowners association with $200 monthly fee
Exterior
- Parking: Detached carport with 2 spaces
- Security: Smoke detectors
- Utilities: Public water; Public sewer
- Home design: Residential condominium
- Construction: Vinyl siding; Asphalt roof; Basement with concrete floor
- Exterior features: Deck; Irregular-shaped lot
Interior
- Kitchen: Dishwasher; Oven; Refrigerator
- Bathrooms: Two full bathrooms
- Heating & cooling: Forced air heating (natural gas); Central air conditioning; Gas water heater
- Interior features: Gas fireplace in the living room; Water softener; Sump pump in basement
- Laundry & utility: Washer and dryer included; Main-level laundry
Neighborhood map
What this means for you Summary
Snapshot
- This is a 2-bed/2.0-bath condo listed at $190k.
Deal economics
- At list price, monthly cash flow is $-21 ($-251/yr) — negative.
- To cash-flow at today's rent, offer at most $186k (1.9% below list).
- To meet the 1% rule (rent ≥ 1% of price), the offer needs to be $185k (2.5% below list).
- Recommended offer: $184k (3.0% below list) — sets the bar for market timing.
- Cap rate 6.2% vs local median 3.1% in Cedar Falls — top-decile yield for the area; either an underpriced asset or a hidden risk that comps aren't pricing in. Stress-test before assuming the spread holds.
Location & tenants
- Location reads 81/100 on livability (#60 in IA, #1,357 nationally) — a professional / high-income tenant draw. Strengths: cost of living A+, housing A+, health & safety A+; Watch: amenities D, commute F.
- Cedar Falls Community School District (urban): math 76% / reading 79% proficiency, ranked #45 of 289 in IA (top 16%) — strong family-tenant draw, lease renewals of 3-5y typical; only 18% free/reduced lunch — higher-income household profile.
- Zoned schools: Cedar Heights Elementary School (math 70% / reading 74%, grade A-, #181 of 616 statewide, top 34%, 474 students, 40% FRL); Peet Junior High School (math 79% / reading 80%, grade A+, #35 of 246 statewide, top 16%, 670 students, 27% FRL); Cedar Falls High School (math 74% / reading 78%, grade A-, #75 of 336 statewide, top 23%, 1,302 students, 24% FRL).
- Market conditions: Rents rising (+2.0%/yr); 387 active listings in the ZIP; 2 comparable units currently listed for rent nearby; solid renter incomes; 287 units permitted in Black Hawk County in 2024 (67 in 5+ unit buildings).
Forward outlook
- Local home prices are declining (-3.0%/yr); year-one equity from $1k of loan paydown is wiped out by about $6k of value loss. Plan a longer hold.
- Black Hawk County population projected at +10% by 2050 — modest demand growth; plan on rents tracking national, not racing it.
Negotiation context
- It's been on market 37 days — a 3% lower offer ($184k) is reasonable based on typical stale-listing flexibility.
- 2 sale attempts since 11y ago with the ask held roughly flat each time — persistent listings suggest the price (not the market) is what's stuck; bring a comps-based counter.
- Current owner paid $126k; list at $190k implies a 51% gain — meaningful room to come down on a strong offer.
Questions for the listing agent
- What do current leases actually rent for vs. the listed asking? Can we see a recent rent roll and the last 12 months of T-12 income?
- It's been on market 37 days. Have you received any prior offers? Is the seller open to a 3% concession, seller financing, or rate buy-down credit?
- What does the HOA fee cover, when was the last increase, and are there any pending special assessments or reserve-fund shortfalls?
- Any open or pending special assessments — roof, HVAC, plumbing, elevator, façade? What's the per-unit balance and payoff schedule, and is the seller paying it off at close or rolling it to the buyer?
- Is there a deadline driving the sale (1031 exchange, divorce, estate, relocation)? That informs how much negotiation room exists.
- Schools are A-rated — typically a magnet for longer-tenancy family renters. What's the average tenant stay here, and is there a school-zone premium baked into asking?
- What's the average days-on-market for RENTAL listings here right now (not sales)? A rising rental-DOM trend means longer vacancies and softer asking-rent achievability than the comps imply.
- What's the recent tenant-quality profile in this submarket — average credit score on applications, eviction rate, late-payment / NSF rate, and stable-employment percentage? A property-management company in the area should have these aggregated.
- How much new apartment / multifamily construction is in the pipeline within 1–3 miles? Heavy new supply (>2% of stock underway) typically softens rents 12–24 months out; light construction supports rent growth.
Investment metrics
- 1% rule
- 0.97% ✗
- Cap rate
- 6.16%
- Cash-on-cash
- -0.47%
- DSCR
- 0.98
- GRM
- 8.5
CMA / ARV
- ARV (median comp)
- $282,357
- List price
- $189,999
- Delta
- -32.71%
- Verdict
- UNDERPRICED
- Comps
- 15 within 1.0 mi
Projected returns pro-forma
-3.0% appreciation · 1.97% rent growth · sell at horizon
- IRR
- -18.3%
- Equity multiple
- 0.36×
- Total profit
- $-33,885
- Equity at exit
- $28,329
- IRR
- -12.9%
- Equity multiple
- 0.28×
- Total profit
- $-38,316
- Equity at exit
- $16,428
Cash invested: $53,200 (down + closing). Projections, not guarantees.
Landlord ↔ Tenant lean methodology
- Overall (STATE)
- 83 Strongly Landlord-Friendly
- State Iowa
- 83 Strongly Landlord-Friendly · R+6
- County
- — inherits STATE
- City
- — inherits STATE
ZIP-level market 50613
- Rents YoY
- 2.0%
- Active inventory
- 387
- Price-to-rent
- 8.5×
Monthly cashflow live
- Estimated rent
- $1,852 medium interval (Pro) →
- Mortgage (P&I)
- −$996
- Tax from tax record
- −$208 /mo · $2,500/yr
- Insurance
- −$79
- HOA
- −$200
- Vacancy / Maint / Mgmt
- −$389
- Net cashflow
- $-21
Break-even live
UW: 25.0% down · 7.5% · 30yr · 1.5% tax · 5.0% vac · 8.0% maint · 8.0% mgmt
Financing live
Cash to close
- Down payment
- $47,500
- Closing costs
- $5,700
- Reserves months
- —
- Total cash needed
- —
Loan-product check · same deal, 3 products live
Conventional
25% down · 7.5% · 30yr
- Down + closing
- —
- Monthly P&I
- —
- Monthly cashflow
- —
- DSCR
- —
- Eligible?
- —
Personal DTI + credit; lowest rate.
DSCR
20% down · 8.5% · 30yr
- Down + closing
- —
- Monthly P&I
- —
- Monthly cashflow
- —
- DSCR
- —
- Eligible?
- —
No personal income docs; deal must DSCR.
Hard money
10% down · 12.0% · 12mo
- Down + closing
- —
- Monthly P&I
- —
- Monthly cashflow
- —
- DSCR
- —
- Eligible?
- —
Short-term bridge; refi at stabilization.
Rent comps 2 comps
| Address | Beds | Baths | Sqft | Rent | $/sqft | DOM | Units | Dist |
|---|---|---|---|---|---|---|---|---|
| 3856 Jay Ln Waterloo, IA | 3.0 | 3.5 | 1520 | $1,975 | $1.30 | 43d | 1 | 0.84mi |
| 725 Melendy Ln Cedar Falls, IA | 3.0 | 2.0 | 1526 | $2,800 | $1.83 | 43d | 1 | 1.27mi |
HOA detail condo
- Monthly dues
- $200 · $2,400/yr
- Assessments
- None detected in remarks — confirm with the listing agent.
Listing history 24 events
-
2026-06-19days on market $189,999 Active 37 DOM
-
2026-06-18days on market $189,999 Active 36 DOM
-
2026-06-17days on market $189,999 Active 35 DOM
-
2026-06-16days on market $189,999 Active 34 DOM
-
2026-06-15days on market $189,999 Active 33 DOM
-
2026-06-14days on market $189,999 Active 31 DOM
-
2026-06-13days on market $189,999 Active 30 DOM
-
2026-06-10days on market $189,999 Active 28 DOM
-
2026-06-09days on market $189,999 Active 27 DOM
-
2026-06-08days on market $189,999 Active 26 DOM
-
2026-06-07days on market $189,999 Active 25 DOM
-
2026-06-05days on market $189,999 Active 22 DOM
-
2026-06-03days on market $189,999 Active 21 DOM
-
2026-06-03price $189,999 Active 20 DOM
-
2026-06-02days on market $199,000 Active 20 DOM
-
2026-06-01days on market $199,000 Active 19 DOM
-
2026-05-31days on market $199,000 Active 18 DOM
-
2026-05-30days on market $199,000 Active 17 DOM
-
2026-05-12$199,000 Active 1615-char remark
-
2026-03-20price $199,000
-
2016-02-08soldstatus $125,500
-
2015-12-16soldstatus $125,250
Show marketing remark (383 chars)
A great Value! This 3 bedroom, 2.5 bath 2 story condo situated in central Cedar Falls offers a private location, main level master suite plus 2 spacious bedrooms on the second level. Great room with fireplace, 2 decks and main floor laundry too. All appliances included, new carpet, fresh paint , great storage and double garage provide a great "total package" opportunity,
-
2015-09-24$129,500
Show marketing remark (383 chars)
A great Value! This 3 bedroom, 2.5 bath 2 story condo situated in central Cedar Falls offers a private location, main level master suite plus 2 spacious bedrooms on the second level. Great room with fireplace, 2 decks and main floor laundry too. All appliances included, new carpet, fresh paint , great storage and double garage provide a great "total package" opportunity,
-
2012-09-05soldstatus $112,500
ⓘ Source: listings_history table (triggers on properties + properties_extension) + one-shot
backfill from property_details.listing_events for pre-trigger history.
Tax reassessment forecast IA · Partial reset (capped growth)
- Current annual tax
- $2,500 · $208/mo
- Projected year-2 tax
- $2,741 · $228/mo
- Expected delta
- +$241/yr (+$20/mo · 9.7%)
ⓘ Screening estimate from a state-policy table — verify with the county assessor before closing.
Climate risk First Street
- Flood 1/10 Low FEMA zone X (unshaded) · 0% chance over 30 yrs
- Wildfire 2/10 Low
- Heat 3/10 Moderate 7 d/yr ≥101°F today · 15 d/yr by 30 yrs out
- Wind 2/10 Low
- Air quality 1/10 Low 0 unhealthy d/yr today · 0 by 30 yrs out
Nearby sold comps map
Loading sold comps map…
Walkable amenities ~0.75 mi
Loading nearby amenities…
Taxation est. · year 1
- Rental income
- $22,223
- − Mortgage interest
- −$10,643
- − Property taxes
- −$2,500
- − Insurance
- −$950
- − Repairs & maintenance
- −$1,778
- − Management
- −$1,778
- − HOA
- −$2,400
- − Depreciation
- −$5,527
- Taxable loss
- −$3,353
- Est. tax savings @ 24.0%
- +$805
- After-tax cash flow
- $554/yr
For passive investors: Depreciation is non-cash, so a rental often shows a tax loss while cash-flowing — sheltering income. Rental losses are passive: they offset passive income freely, and up to $25,000/yr can offset ordinary (W-2) income if you actively participate and your MAGI is under $100k (phasing out to $0 by $150k); unused losses carry forward. On sale, claimed depreciation is recaptured at up to 25%, and gains may owe capital-gains tax (a 1031 exchange can defer both). Figures are a year-1 estimate at your 24.0% rate — not tax advice; consult a CPA.
Schools (NCES district)
- District
- Cedar Falls Community School District
- NCES district ID
- 1906510
- Math proficiency
- 76% ▼ -6.00%
- Reading proficiency
- 79% ▼ -2.00%
- Median HH income
- $53,634
- Composite
- 65.93/100
- National rank
- #443
- State rank
- #45 of 289 in IA
Livability — Cedar Falls
- Score
- 81/100
- State rank
- #60
- US rank
- #1357
Category grades
Schools grade is shown separately in the Schools card above.
Census & demographics
- Census place
- Cedar Falls, IA
- County
- Black Hawk County · 112,933 people
- City population
- 43,867
- Metro
- Waterloo-Cedar Falls, IA
- Population (ZIP)
- 43,867
- Household income
- $78,503
- Rent vs Own
- Severe rent burden
- 1514.0
Population outlook (Black Hawk County) Hauer SSP2
- Today (2025)
- 139,716 people
- By 2030
- 142,853 · +2.2%
- By 2040
- 147,843 · +5.8%
- By 2050
- 153,247 · +9.7%
- By 2075
- 167,977 · +20.2%
- By 2100
- 177,320 · +26.9%
Race, ethnicity, and origin ACS 2023
- Neighborhood character
- Predominantly White (90%)
- Race & ethnicity
- White 90% Asian 3% Two or more races 3% Hispanic / Latino 3% Black 1%
- Common ancestry
- Portuguese 6% Italian 3% Iranian 3%
- Foreign-born
- 4% · Canada, South Korea
- Languages at home
- 95% English-only · Spanish 2% Russian/Polish/Slavic 1% Other Indo-European 1%
Political lean MEDSL · Black Hawk
- 2024 margin
- Toss-up / Even · D 50.0% · R 48.8% · Other 1.2%
- 2008→2024 swing
- -21.3pp toward R · 2008: 22.4pp · 2024: 1.2pp
- All cycles
- 2024: D+1.2 2020: D+9.0 2016: D+7.3 2012: D+20.0 2008: D+22.4
Not yet ingested
- Civics
- —
Market trends
- HPI YoY
- ▼ -175.51%
- Current HPI
- 169.0591
- Rent YoY
- ▲ 1.97%
- Metro
- Waterloo-Cedar Falls, IA
- State GDP YoY
- ▲ 2.48%
- F500 in state
- 4
Industry mix (Fortune 500 HQ in IA)
| Industry | F500 HQs | Revenue |
|---|---|---|
| Financial Services | 1 | $16B |
|
||
| Retail / Convenience | 1 | $15B |
|
||
Price history
+68.9% since first listed7 events — show timeline
- 2026-06-02 Price Changed $189,999 NEIRBR as distributed by MLS GRID
- 2026-05-12 Listed $199,000 NEIRBR as distributed by MLS GRID
- 2026-03-20 Price Changed $199,000 NEIRBR as distributed by MLS GRID
- 2016-02-08 Sold (Public Records) $125,500 Public Records
- 2015-12-16 Sold (MLS) $125,250 NEIRBR as distributed by MLS GRID
- 2015-09-24 Listed $129,500 NEIRBR as distributed by MLS GRID
- 2012-09-05 Sold (Public Records) $112,500 Public Records
Property tax history
+1.5%/yrLatest (2025): $2,500 · +2.9% YoY. Source: county tax records.
Cash-flow waterfall
monthlySold comps — $/sqft
last 12 mo · ≤1 miLoading sold comps…