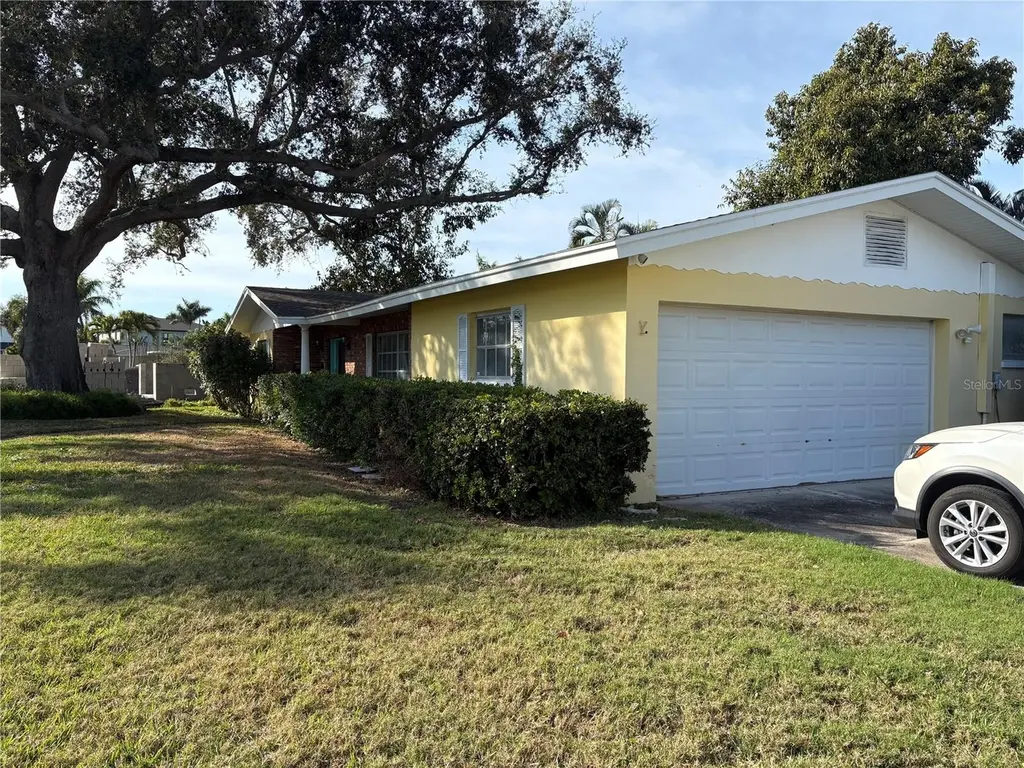
498 Bayview Dr NE · St. Petersburg, FL
Flood risk 9/10 · Severe
- FEMA flood zone
- AE
- Chance of flooding over 30 yrs
- 0.99%
- Est. flood insurance / yr
- $1,737 – $8,500
Fire risk 1/10 · Minimal
- Est. fire insurance / yr
- $947 – $1,759
Heat risk 10/10 · Severe
- Hot days now (above 106°F)
- 7 days/yr
- Hot days in 30 yrs
- 28 days/yr
Wind risk 10/10 · Severe
- Chance of severe wind over 30 yrs
- 99.0%
Air-quality risk 3/10 · Minor
- Unhealthy air days now
- 2 days/yr
- Unhealthy air days in 30 yrs
- 3 days/yr
Risk factors via First Street. Map © Google.
Why this score? — see what drove the D+ grade
The composite is a weighted blend of 9 inputs, each scored 0–100. Each bar is that input's sub-score; the figure is the points it added to the 100-point composite (weight × sub-score).
- Cash flow +16.7/30.0
- ARV discount +7.5/15.0
- DSCR +5.2/10.0
- Schools +4.3/10.0
- 1% rule +3.5/10.0
- Rent growth +3.4/5.0
- Livability +2.5/5.0
- Condition / age +2.5/5.0
- Appreciation +0.0/10.0
$650,000
🖨 Deal sheet (PDF) 📄 Offer letter ✓ Due diligence
Listing remarks
Under contract-accepting backup offers. Step into a home with serious potential, effortless everyday function, and the classic Florida footprint buyers love. This single-level residence offers 4 bedrooms, 2 bathrooms, and 1,866 square feet of living space, giving you room to spread out, host, work from home, create, relax, and live exactly the way you want. From the moment you arrive, the corner-lot setting makes an impression. Mature landscaping, a welcoming front porch, and a side-facing 2-car garage create clean, polished curb appeal while giving the home a practical, easy-living layout. Inside, the space opens with a bright, flexible floor plan designed for real life. Terrazzo and tile
Key facts
- Pantry storage
- Corner-lot setting
- Mature landscaping
Tags
Neighborhood map
What this means for you Summary
Snapshot
- This is a 4-bed/2.0-bath single-family listed at $650k.
Deal economics
- At list price, monthly cash flow is $-23 ($-280/yr) — negative.
- To cash-flow at today's rent, offer at most $646k (0.6% below list).
- To meet the 1% rule (rent ≥ 1% of price), the offer needs to be $553k (14.9% below list).
- Recommended offer: $553k (14.9% below list) — sets the bar for 1% rule.
- Cap rate 7.0% vs local median 2.6% in St. Petersburg — top-decile yield for the area; either an underpriced asset or a hidden risk that comps aren't pricing in. Stress-test before assuming the spread holds.
Location & tenants
- Location reads: area grade D — affects rentability + tenant quality, not the cash-flow math above.
- Pinellas (suburban): math 51% / reading 51% proficiency, ranked #31 of 73 in FL (top 42%) — acceptable for families but not a draw, mixed tenant base, ~2y average lease.
- Zoned schools: North Shore Elementary School (math 42% / reading 47%, grade F, #1,288 of 2,144 statewide, top 62%, 501 students, 46% FRL); John Hopkins Middle School (math 25% / reading 27%, grade F, #506 of 571 statewide, top 89%, 723 students, 66% FRL); St. Petersburg High School (math 31% / reading 61%, grade D-, #220 of 667 statewide, top 33%, 1,723 students, 39% FRL) — zoned schools at 51% FRL track the district average.
- Zoned-school proficiency averages 39% at this address vs 51% district-wide (-12 pts) — the specific schools serving this property underperform the Pinellas average; the district grade overstates school quality for this exact location.
- Market conditions: Rents rising (+3.4%/yr); 242 active listings in the ZIP; 10 comparable units currently listed for rent nearby; rentals leasing fast (median 7d on market — plan ~1-2 weeks tenant-placement turnaround); solid renter incomes; 2,676 units permitted in Pinellas County in 2024 (1,422 in 5+ unit buildings).
Forward outlook
- Local home prices are declining (-3.0%/yr); year-one equity from $4k of loan paydown is wiped out by about $20k of value loss. Plan a longer hold.
- Pinellas County population projected at +14% by 2050 — modest demand growth; plan on rents tracking national, not racing it.
Negotiation context
- Only 3 days on market — expect competitive offers; lowballing is unlikely to land.
- 3 sale attempts since 2y ago with the ask held roughly flat each time — persistent listings suggest the price (not the market) is what's stuck; bring a comps-based counter.
- Current owner paid $145k; list at $650k implies a 349% gain — meaningful room to come down on a strong offer.
Risks & watch-outs
- Watch-outs: flood insurance adds $427/mo.
- Climate carrying-cost: in FEMA flood zone AE (mandatory federal flood insurance); severe wind risk, 99% chance of damaging wind over 30y; extreme-heat days projected 7→28/yr by 2055 (HVAC capex compounding) — expect insurance premiums to compound above CPI over the hold.
Questions for the listing agent
- What do current leases actually rent for vs. the listed asking? Can we see a recent rent roll and the last 12 months of T-12 income?
- Built in 1964 — when were the roof, HVAC, electrical panel, plumbing, and water heater last replaced?
- What's the actual annual flood-insurance premium (NFIP or private), and is the property in a SFHA with mandatory coverage?
- Is there a deadline driving the sale (1031 exchange, divorce, estate, relocation)? That informs how much negotiation room exists.
- The area grade is low — what's the realistic commute time and amenity access for the typical tenant pool here? Any planned neighborhood developments (good or bad) we should know about?
- What's the average days-on-market for RENTAL listings here right now (not sales)? A rising rental-DOM trend means longer vacancies and softer asking-rent achievability than the comps imply.
- What's the recent tenant-quality profile in this submarket — average credit score on applications, eviction rate, late-payment / NSF rate, and stable-employment percentage? A property-management company in the area should have these aggregated.
- How much new for-sale + rental construction is in the pipeline within 1–3 miles? Heavy new supply typically softens prices + rents 12–24 months out; constrained supply supports both.
Investment metrics
- 1% rule
- 0.85% ✗
- Cap rate
- 7.04%
- Cash-on-cash
- 2.66%
- DSCR
- 1.12
- GRM
- 9.8
CMA / ARV
- ARV (on-the-fly)
- $649,368
- Comps found
- 12
Show comp detail 12 sales within ~0.75 mi
| Address | Dist | Beds/Ba | Sqft | Sold | Price | $/sf | Match |
|---|---|---|---|---|---|---|---|
| 498 Bayview Dr NE | 0.00mi | 4/2.0 | 1,866 (0%) | 1mo | $650,000 | $348 | 99 |
| 1200 Eden Isle Blvd NE | 0.10mi | 3/2.0 (-1) | 1,796 (-4%) | 0mo | $715,000 | $398 | 84 |
| 3650 Bayshore Blvd NE | 0.62mi | 4/3.0 | 1,885 (+1%) | 8mo | $380,000 | $202 | 58 |
| 1233 Eden Isle Dr NE | 0.24mi | 3/2.0 (-1) | 2,144 (+15%) | 1mo | $1,350,000 | $630 | 58 |
| 1112 38th Ave NE | 0.65mi | 3/2.5 (-1) | 1,901 (+2%) | 3mo | $1,200,000 | $631 | 56 |
| 3406 Bayshore Blvd NE | 0.40mi | 4/3.0 | 1,975 (+6%) | 14mo | $310,000 | $157 | 56 |
| 3219 Bayshore Blvd NE | 0.35mi | 3/3.0 (-1) | 1,754 (-6%) | 14mo | $1,825,000 | $1,040 | 53 |
| 4090 14th Ln NE | 0.71mi | 3/2.0 (-1) | 1,805 (-3%) | 4mo | $515,000 | $285 | 53 |
| 546 Rafael Blvd NE | 0.28mi | 4/3.5 | 2,055 (+10%) | 13mo | $1,225,000 | $596 | 53 |
| 3932 Shore Acres Blvd NE | 0.60mi | 3/2.0 (-1) | 2,000 (+7%) | 11mo | $520,700 | $260 | 46 |
| 1518 Cheyenne St NE | 0.68mi | 3/2.0 (-1) | 1,728 (-7%) | 10mo | $515,000 | $298 | 42 |
| 3934 Huntington St NE | 0.68mi | 3/2.0 (-1) | 1,630 (-13%) | 2mo | $255,500 | $157 | 41 |
Match score weights: distance 35% · size 25% · config 20% · recency 20%. Top-matched comps best support the ARV.
Projected returns pro-forma
-3.0% appreciation · 3.43% rent growth · sell at horizon
- IRR
- -16.1%
- Equity multiple
- 0.43×
- Total profit
- $-104,388
- Equity at exit
- $96,917
- IRR
- -7.0%
- Equity multiple
- 0.55×
- Total profit
- $-82,767
- Equity at exit
- $56,200
Cash invested: $182,000 (down + closing). Projections, not guarantees.
Landlord ↔ Tenant lean methodology
- Overall (STATE)
- 87 Strongly Landlord-Friendly
- State Florida
- 87 Strongly Landlord-Friendly · R+3
- County
- — inherits STATE
- City
- — inherits STATE
ZIP-level market 33704
- Rents YoY
- 3.4%
- Active inventory
- 242
- Price-to-rent
- 9.8×
Monthly cashflow live
- Estimated rent
- $5,533 high interval (Pro) →
- Mortgage (P&I)
- −$3,409
- Tax from tax record
- −$288 /mo · $3,462/yr
- Insurance
- −$271
- Flood insurance flood zone
- −$427 /mo · $5,118/yr
- HOA
- −$0
- Vacancy / Maint / Mgmt
- −$1,162
- Net cashflow
- $-23
Break-even live
Sensitivity live
| Price | -10% $345 | -5% $161 | +0% $-23 | +5% $-207 | +10% $-391 |
|---|---|---|---|---|---|
| Rent | -10% $-460 | -5% $-242 | +0% $-23 | +5% $195 | +10% $414 |
| Rate | -1.0pp $304 | -0.5pp $142 | base $-23 | +0.5pp $-192 | +1.0pp $-363 |
UW: 25.0% down · 7.5% · 30yr · 1.5% tax · 5.0% vac · 8.0% maint · 8.0% mgmt
Financing live
Cash to close
- Down payment
- $162,500
- Closing costs
- $19,500
- Reserves months
- —
- Total cash needed
- —
Loan-product check · same deal, 3 products live
Conventional
25% down · 7.5% · 30yr
- Down + closing
- —
- Monthly P&I
- —
- Monthly cashflow
- —
- DSCR
- —
- Eligible?
- —
Personal DTI + credit; lowest rate.
DSCR
20% down · 8.5% · 30yr
- Down + closing
- —
- Monthly P&I
- —
- Monthly cashflow
- —
- DSCR
- —
- Eligible?
- —
No personal income docs; deal must DSCR.
Hard money
10% down · 12.0% · 12mo
- Down + closing
- —
- Monthly P&I
- —
- Monthly cashflow
- —
- DSCR
- —
- Eligible?
- —
Short-term bridge; refi at stabilization.
Rent comps 10 comps
| Address | Beds | Baths | Sqft | Rent | $/sqft | DOM | Units | Dist |
|---|---|---|---|---|---|---|---|---|
| 926 Cordova Blvd NE Saint Petersburg, FL | 4.0 | 3.0 | 2554 | $7,500 | $2.94 | 6d | 1 | 0.11mi |
| 1325 Snell Isle Blvd NE #507 Saint Petersburg, FL | 3.0 | 3.0 | 1940 | $6,700 | $3.45 | 6d | 1 | 0.14mi |
| 3435 Overlook Dr NE Saint Petersburg, FL | 3.0 | 2.5 | 1428 | $3,800 | $2.66 | 6d | 1 | 0.43mi |
| 4026 Indianapolis St NE Saint Petersburg, FL | 3.0 | 2.0 | 1364 | $3,200 | $2.35 | 6d | 1 | 0.80mi |
| 300 Brightwaters Blvd NE Saint Petersburg, FL | 3.0 | 3.0 | 2448 | $7,500 | $3.06 | 6d | 1 | 0.82mi |
| 4036 Overlook Dr NE Saint Petersburg, FL | 3.0 | 2.0 | 1412 | $2,645 | $1.87 | 16d | 1 | 0.86mi |
| 541 40th Ave NE Saint Petersburg, FL | 3.0 | 1.0 | 1630 | $3,000 | $1.84 | 26d | 1 | 1.15mi |
| 742 45th Ave NE Saint Petersburg, FL | 3.0 | 3.0 | 1900 | $5,200 | $2.74 | 6d | 1 | 1.20mi |
| 411 42nd Ave NE Saint Petersburg, FL | 3.0 | 2.0 | 1365 | $3,500 | $2.56 | 19d | 1 | 1.32mi |
| 5273 Denver St NE Saint Petersburg, FL | 4.0 | 2.0 | 2262 | $3,875 | $1.71 | 26d | 1 | 1.42mi |
Listing history 8 events
-
2026-04-27status Pending
-
2026-04-24$650,000 Active
-
2025-01-27status Active
-
2025-01-25historical
-
2024-08-22$899,999 Active
-
1998-03-02soldstatus $144,900
-
1994-12-13soldstatus $89,000
-
1994-08-10soldstatus $80,300
ⓘ Source: listings_history table (triggers on properties + properties_extension) + one-shot
backfill from property_details.listing_events for pre-trigger history.
Tax reassessment forecast FL · Resets to sale price
- Current annual tax
- $3,462 · $288/mo
- Projected year-2 tax
- $5,395 · $450/mo
- Expected delta
- +$1,933/yr (+$161/mo · 55.9%)
ⓘ Screening estimate from a state-policy table — verify with the county assessor before closing.
Climate risk First Street
- Flood 9/10 Extreme FEMA zone AE · 99% chance over 30 yrs
- Wildfire 1/10 Low
- Heat 10/10 Extreme 7 d/yr ≥106°F today · 28 d/yr by 30 yrs out
- Wind 10/10 Extreme 99% chance of damaging wind over 30 yrs
- Air quality 3/10 Moderate 2 unhealthy d/yr today · 3 by 30 yrs out
Nearby sold comps map
Loading sold comps map…
Walkable amenities ~0.75 mi
Loading nearby amenities…
Taxation est. · year 1
- Rental income
- $66,397
- − Mortgage interest
- −$36,410
- − Property taxes
- −$3,462
- − Insurance
- −$8,368
- − Repairs & maintenance
- −$5,312
- − Management
- −$5,312
- − Depreciation
- −$18,909
- Taxable loss
- −$11,376
- Est. tax savings @ 24.0%
- +$2,730
- After-tax cash flow
- $2,450/yr
For passive investors: Depreciation is non-cash, so a rental often shows a tax loss while cash-flowing — sheltering income. Rental losses are passive: they offset passive income freely, and up to $25,000/yr can offset ordinary (W-2) income if you actively participate and your MAGI is under $100k (phasing out to $0 by $150k); unused losses carry forward. On sale, claimed depreciation is recaptured at up to 25%, and gains may owe capital-gains tax (a 1031 exchange can defer both). Figures are a year-1 estimate at your 24.0% rate — not tax advice; consult a CPA.
Schools (NCES district)
- District
- Pinellas
- NCES district ID
- 1201560
- Math proficiency
- 51% ▼ -5.00%
- Reading proficiency
- 51% ▼ -3.00%
- Median HH income
- $46,270
- Composite
- 43.27/100
- National rank
- #3046
- State rank
- #31 of 73 in FL
Livability — St. Petersburg
No livability data for this city. (Only ~50 U.S. cities are tracked.)
Census & demographics
- Census place
- St. Petersburg, FL
- County
- Pinellas County · 939,478 people
- City population
- 249,151
- Metro
- Tampa-St. Petersburg-Clearwater, FL
- Population (ZIP)
- 16,232
- Household income
- $107,889
- Rent vs Own
- Severe rent burden
- 632.0
Population outlook (Pinellas County) Hauer SSP2
- Today (2025)
- 1,027,532 people
- By 2030
- 1,063,586 · +3.5%
- By 2040
- 1,125,020 · +9.5%
- By 2050
- 1,168,637 · +13.7%
- By 2075
- 1,265,188 · +23.1%
- By 2100
- 1,260,357 · +22.7%
Race, ethnicity, and origin ACS 2023
- Neighborhood character
- Predominantly White (83%)
- Race & ethnicity
- White 83% Two or more races 8% Hispanic / Latino 7% Black 4% Asian 2%
- Hispanic origin (detail)
- Mexican 1% Puerto Rican 1% Cuban 1%
- Common ancestry
- Lithuanian 4% Slovak 4% Romanian 4%
- Foreign-born
- 9% · Canada, Jamaica, Vietnam
- Languages at home
- 92% English-only · Spanish 3% German/W. Germanic 1% French/Haitian/Cajun 1%
Political lean MEDSL · Pinellas
- 2024 margin
- Lean R (+5.2) · D 46.9% · R 52.1%
- 2008→2024 swing
- -13.5pp toward R · 2008: 8.3pp · 2024: -5.2pp
- All cycles
- 2024: R+5.2 2020: D+0.2 2016: R+1.1 2012: D+5.6 2008: D+8.3
Not yet ingested
- Civics
- —
Market trends
- HPI YoY
- ▼ -822.13%
- Current HPI
- 473.0888
- Rent YoY
- ▲ 3.43%
- Metro
- Tampa-St. Petersburg-Clearwater, FL
- State GDP YoY
- ▲ 3.28%
- F500 in state
- 36
Industry mix (Fortune 500 HQ in FL)
| Industry | F500 HQs | Revenue |
|---|---|---|
| Industrial Technology | 2 | $29B |
|
||
| Insurance | 2 | $17B |
|
||
| Retail | 1 | $60B |
|
||
| Technology Distribution | 1 | $58B |
|
||
| Homebuilding | 1 | $35B |
|
||
| Technology Manufacturing | 1 | $35B |
|
||
Price history
+709.5% since first listed8 events — show timeline
- 2026-04-27 Pending — Stellar MLS as Distributed by MLS Grid
- 2026-04-24 Listed $650,000 Stellar MLS as Distributed by MLS Grid
- 2025-01-27 Relisted — Stellar MLS as Distributed by MLS Grid
- 2025-01-25 Listing Removed — Stellar MLS as Distributed by MLS Grid
- 2024-08-22 Listed $899,999 Stellar MLS as Distributed by MLS Grid
- 1998-03-02 Sold (Public Records) $144,900 Public Records
- 1994-12-13 Sold (Public Records) $89,000 Public Records
- 1994-08-10 Sold (Public Records) $80,300 Public Records
Property tax history
-1.8%/yrLatest (2025): $3,462 · -4.4% YoY. Source: county tax records.
Cash-flow waterfall
monthlySold comps — $/sqft
last 12 mo · ≤1 miLoading sold comps…