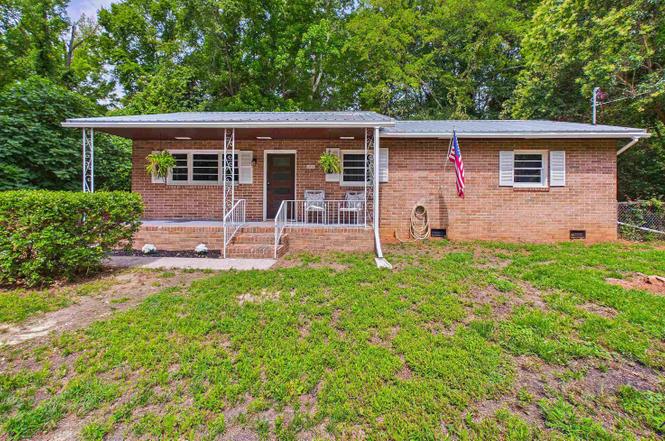
910 Perry Dr · Macon-Bibb County, GA
Flood risk 7/10 · Major
- FEMA flood zone
- X (unshaded)
- Chance of flooding over 30 yrs
- 0.99%
- Est. flood insurance / yr
- $507 – $1,088
Fire risk 3/10 · Minor
- Est. fire insurance / yr
- $963 – $1,789
Heat risk 7/10 · Major
- Hot days now (above 108°F)
- 7 days/yr
- Hot days in 30 yrs
- 17 days/yr
Wind risk 6/10 · Moderate
- Chance of severe wind over 30 yrs
- 66.0%
Air-quality risk 4/10 · Minor
- Unhealthy air days now
- 4 days/yr
- Unhealthy air days in 30 yrs
- 4 days/yr
Risk factors via First Street. Map © Google.
Why this score? — see what drove the C grade
The composite is a weighted blend of 9 inputs, each scored 0–100. Each bar is that input's sub-score; the figure is the points it added to the 100-point composite (weight × sub-score).
- Cash flow +19.4/30.0
- ARV discount +7.5/15.0
- Appreciation +7.2/10.0
- DSCR +6.1/10.0
- Rent growth +5.0/5.0
- 1% rule +4.0/10.0
- Livability +2.5/5.0
- Condition / age +2.5/5.0
- Schools +1.2/10.0
$125,000
🖨 Deal sheet (PDF) 📄 Offer letter ✓ Due diligence
Listing remarks MLS
Welcome home to this beautifully renovated and move-in ready brick ranch! This charming 3-bedroom, 1.5-bath home combines modern updates with timeless appeal. Step inside to a spacious living area accented by stylish fluted wall paneling, creating a warm and inviting atmosphere. The updated kitchen features refreshed cabinetry, butcher block countertops, a new sink and fixtures, new appliances, and a generous dining area perfect for meals and entertaining. Just off the dining space, you'll find a newly added half bath and convenient laundry room. Three comfortable bedrooms share a beautifully renovated hall bath, while fresh paint throughout, several new windows, and new carpet in the bedrooms add to the home's turnkey appeal. Outside, enjoy a fenced backyard with plenty of room for pets, play, or gardening. Conveniently located less than 2 miles from a local golf course, this home offers both comfort and convenience. Don't miss your opportunity to own this adorable, updated home!
Key facts
- New appliances
- Updated kitchen
- Fenced backyard
Tags
Property features AI
Finance
- Other: Located in the Morningside subdivision; Located in Macon, Bibb County, GA
- HOA & community: No HOA
Exterior
- Parking: Off-street parking
- Utilities: Public water; Public sewer; Electricity available; Natural gas available; Sewer connected; Water available
- Home design: Single-family house; One level; Resale property
- Construction: Built in 1971; Brick construction; Metal roof
- Exterior features: Fenced yard; Level lot
Interior
- Kitchen: Dishwasher; Stainless steel appliances; Electric water heater
- Bedrooms: Three bedrooms (all on the main level)
- Flooring: Carpet; Laminate; Tile
- Bathrooms: One full bathroom; One half bathroom
- Heating & cooling: Natural gas heating; Electric cooling
- Interior features: Tile bathroom; Family room; Crawl space basement
- Laundry & utility: Laundry closet
Neighborhood map
What this means for you Summary
Snapshot
- This is a 3-bed/1.0-bath single-family listed at $125k.
Deal economics
- At list price, monthly cash flow is $73 ($881/yr) — positive.
- The deal already cash-flows at list — no discount required.
- To meet the 1% rule (rent ≥ 1% of price), the offer needs to be $113k (9.9% below list).
- Recommended offer: $113k (9.9% below list) — sets the bar for 1% rule.
- Cap rate 7.6% vs local median 5.4% in Macon-Bibb County — top-decile yield for the area; either an underpriced asset or a hidden risk that comps aren't pricing in. Stress-test before assuming the spread holds.
Location & tenants
- Location reads: area grade C — affects rentability + tenant quality, not the cash-flow math above.
- Bibb County (urban): math 11% / reading 18% proficiency, ranked #161 of 174 in GA (top 92%) — low school quality limits family demand, transient renter base, plan for 1-2y turnover; 75% free/reduced lunch — lower-income household profile, screen leases tightly.
- Zoned schools: Bernd Elementary School (math 8% / reading 12%, grade F, #1,092 of 1,228 statewide, top 91%, 415 students, 100% FRL); Appling Middle School (math 7% / reading 14%, grade F, #429 of 470 statewide, top 91%, 648 students, 100% FRL); Northeast High School (math 2% / reading 5%, grade F, #413 of 424 statewide, top 99%, 742 students, 100% FRL) — zoned schools average 100% FRL vs 75% district-wide (25 pts higher); higher-poverty schools than district average — tighter screening recommended.
- Market conditions: Rents rising fast (+10.8%/yr); 122 active listings in the ZIP; 20 comparable units currently listed for rent nearby; rentals at typical pace (median 22d on market — plan ~3-4 weeks tenant-placement turnaround); 45% of comp listings sitting > 30 days — soft ceiling on asking rent; lower-income renter base — watch delinquency; 154 units permitted in Bibb County in 2024 (0 in 5+ unit buildings).
Forward outlook
- In year one you build about $6k of equity ($864 loan paydown + $5k appreciation (4.3% local appreciation)).
- Bibb County population projected at -12% by 2050 — secular population decline; favor cash flow + early exit over multi-decade hold.
- At projected returns (4.3% appreciation + 8.0% rent growth), your $35k cash investment doubles in ~4 years — after that, you're playing with house money.
- By year 6, paydown + projected appreciation supports a ~$33k cash-out refi (75% LTV) — recoverable capital for the next deal without selling this one.
Negotiation context
- It's been on market 15 days — a 2% lower offer ($123k) is reasonable based on typical stale-listing flexibility.
- 3 sale attempts with the ask held roughly flat each time — persistent listings suggest the price (not the market) is what's stuck; bring a comps-based counter.
Risks & watch-outs
- Watch-outs: flood insurance adds $66/mo.
- Climate carrying-cost: major flood risk; major wind risk, 66% chance of damaging wind over 30y; extreme-heat days projected 7→17/yr by 2055 (HVAC capex compounding) — expect insurance premiums to compound above CPI over the hold.
Questions for the listing agent
- Built in 1971 — when were the roof, HVAC, electrical panel, plumbing, and water heater last replaced?
- What's the actual annual flood-insurance premium (NFIP or private), and is the property in a SFHA with mandatory coverage?
- Is there a deadline driving the sale (1031 exchange, divorce, estate, relocation)? That informs how much negotiation room exists.
- What's the average days-on-market for RENTAL listings here right now (not sales)? A rising rental-DOM trend means longer vacancies and softer asking-rent achievability than the comps imply.
- What's the recent tenant-quality profile in this submarket — average credit score on applications, eviction rate, late-payment / NSF rate, and stable-employment percentage? A property-management company in the area should have these aggregated.
- How much new for-sale + rental construction is in the pipeline within 1–3 miles? Heavy new supply typically softens prices + rents 12–24 months out; constrained supply supports both.
Investment metrics
- 1% rule
- 0.90% ✗
- Cap rate
- 7.64%
- Cash-on-cash
- 4.80%
- DSCR
- 1.21
- GRM
- 9.2
CMA / ARV
- ARV (on-the-fly)
- $76,751
- Comps found
- 8
Show comp detail 8 sales within ~0.75 mi
| Address | Dist | Beds/Ba | Sqft | Sold | Price | $/sf | Match |
|---|---|---|---|---|---|---|---|
| 2738 Bryant Pl | 0.53mi | 3/1.0 | 1,032 (-4%) | 8mo | $97,000 | $94 | 61 |
| 2074 Melton Ave | 0.60mi | 3/1.0 | 1,110 (+3%) | 10mo | $117,000 | $105 | 59 |
| 875 Artic Pl | 0.64mi | 2/1.0 (-1) | 1,020 (-6%) | 4mo | $40,000 | $39 | 52 |
| 2345 Danbury Drive Dr | 0.49mi | 3/1.0 | 1,016 (-6%) | 18mo | $97,000 | $95 | 52 |
| 875 Artic Cir | 0.67mi | 2/1.0 (-1) | 1,020 (-6%) | 4mo | $40,000 | $39 | 51 |
| 1860 Washburn St | 0.61mi | 3/1.0 | 1,068 (-1%) | 23mo | $54,850 | $51 | 51 |
| 869 Roseview Dr | 0.39mi | 2/1.0 (-1) | 1,009 (-7%) | 23mo | $46,500 | $46 | 47 |
| 2845 Flewellyn Dr | 0.62mi | 2/1.0 (-1) | 1,056 (-2%) | 22mo | $75,000 | $71 | 44 |
Match score weights: distance 35% · size 25% · config 20% · recency 20%. Top-matched comps best support the ARV.
Projected returns pro-forma
4.31% appreciation · 8.0% rent growth · sell at horizon
- IRR
- 15.7%
- Equity multiple
- 1.99×
- Total profit
- $34,573
- Equity at exit
- $65,670
- IRR
- 18.7%
- Equity multiple
- 4.35×
- Total profit
- $117,236
- Equity at exit
- $109,281
Cash invested: $35,000 (down + closing). Projections, not guarantees.
Landlord ↔ Tenant lean methodology
- Overall (STATE)
- 90 Strongly Landlord-Friendly
- State Georgia
- 90 Strongly Landlord-Friendly · R+3
- County
- — inherits STATE
- City
- — inherits STATE
ZIP-level market 31217
- Home prices YoY
- 2.1%
- Rents YoY
- 10.8%
- Active inventory
- 122
- Price-to-rent
- 9.2×
Monthly cashflow live
- Estimated rent
- $1,126 high interval (Pro) →
- Mortgage (P&I)
- −$656
- Tax from tax record
- −$42 /mo · $506/yr
- Insurance
- −$52
- Flood insurance flood zone
- −$66 /mo · $798/yr
- HOA
- −$0
- Vacancy / Maint / Mgmt
- −$237
- Net cashflow
- $73
Break-even live
Sensitivity live
| Price | -10% $144 | -5% $109 | +0% $73 | +5% $38 | +10% $3 |
|---|---|---|---|---|---|
| Rent | -10% $-16 | -5% $29 | +0% $73 | +5% $118 | +10% $162 |
| Rate | -1.0pp $136 | -0.5pp $105 | base $73 | +0.5pp $41 | +1.0pp $8 |
UW: 25.0% down · 7.5% · 30yr · 1.5% tax · 5.0% vac · 8.0% maint · 8.0% mgmt
Financing live
Cash to close
- Down payment
- $31,250
- Closing costs
- $3,750
- Reserves months
- —
- Total cash needed
- —
Loan-product check · same deal, 3 products live
Conventional
25% down · 7.5% · 30yr
- Down + closing
- —
- Monthly P&I
- —
- Monthly cashflow
- —
- DSCR
- —
- Eligible?
- —
Personal DTI + credit; lowest rate.
DSCR
20% down · 8.5% · 30yr
- Down + closing
- —
- Monthly P&I
- —
- Monthly cashflow
- —
- DSCR
- —
- Eligible?
- —
No personal income docs; deal must DSCR.
Hard money
10% down · 12.0% · 12mo
- Down + closing
- —
- Monthly P&I
- —
- Monthly cashflow
- —
- DSCR
- —
- Eligible?
- —
Short-term bridge; refi at stabilization.
Rent comps 20 comps
| Address | Beds | Baths | Sqft | Rent | $/sqft | DOM | Units | Dist |
|---|---|---|---|---|---|---|---|---|
| 2621 Jeffersonville Rd Unit 23 Macon, GA | 3.0 | 2.0 | 1152 | $1,150 | $1.00 | 44d | 1 | 0.41mi |
| 2621 Jeffersonville Rd Unit 42 Macon, GA | 3.0 | 2.0 | 1152 | $1,081 | $0.94 | 44d | 1 | 0.41mi |
| 2621 Jeffersonville Rd Unit 68 Macon, GA | 3.0 | 2.0 | 1056 | $1,050 | $0.99 | 44d | 1 | 0.41mi |
| 2485 Bristol Dr Macon, GA | 4.0 | 1.0 | 1400 | $1,265 | $0.90 | 44d | 1 | 0.58mi |
| 2251 Companion Dr Macon, GA | 3.0 | 1.0 | 920 | $905 | $0.98 | 21d | 1 | 0.63mi |
| 2055 Pine Hill Dr Macon, GA | 2.0 | 1.0 | 1056 | $775 | $0.73 | 21d | 1 | 0.79mi |
| 1143 Sunnydale Dr Macon, GA | 3.0 | 1.0 | 1053 | $975 | $0.93 | 44d | 1 | 0.95mi |
| 720 Baker St Macon, GA | 2.0 | 1.0 | 1020 | $900 | $0.88 | 45d | 1 | 1.14mi |
| 2909 Skyline Rd Macon, GA | 2.0 | 1.0 | 850 | $910 | $1.07 | 21d | 1 | 1.17mi |
| 2117 Knightsbridge Rd Macon, GA | 3.0 | 1.0 | 1020 | $1,350 | $1.32 | 14d | 1 | 1.17mi |
| 2913 Skyline Rd Macon, GA | 2.0 | 1.0 | 700 | $910 | $1.30 | 21d | 1 | 1.19mi |
| 2903 Skyline Rd Macon, GA | 2.0 | 1.0 | 725 | $960 | $1.32 | 14d | 1 | 1.19mi |
| 2926 Skyline Rd Macon, GA | 2.0 | 1.0 | 725 | $910 | $1.26 | 21d | 1 | 1.19mi |
| 2525 Tredway Dr Macon, GA | 2.0 | 1.0 | 1026 | $825 | $0.80 | 14d | 1 | 1.26mi |
| 854 Trinity Pl Macon, GA | 2.0 | 1.0 | 1260 | $875 | $0.69 | 44d | 1 | 1.29mi |
| 1233 Woolfolk Ter Macon, GA | 2.0 | 1.0 | 740 | $750 | $1.01 | 14d | 1 | 1.36mi |
| 3240 Commodore Dr Macon, GA | 3.0 | 1.5 | 1135 | $1,200 | $1.06 | 44d | 1 | 1.37mi |
| 3240 Commodore Dr Macon, GA | 3.0 | 1.5 | 1135 | $1,200 | $1.06 | 14d | 1 | 1.37mi |
| 1918 Fairway Dr Macon, GA | 3.0 | 1.0 | 1228 | $975 | $0.79 | 21d | 1 | 1.38mi |
| 1143 Woolfolk St Unit 3 Macon, GA | 2.0 | 1.0 | 900 | $800 | $0.89 | 44d | 1 | 1.46mi |
Listing history 12 events
-
2026-06-19days on market $125,000 Active 15 DOM
-
2026-06-18statusdays on market $125,000 Active 14 DOM
-
2026-06-17days on market $125,000 New 13 DOM
-
2026-06-16days on market $125,000 New 12 DOM
-
2026-06-15days on market $125,000 New 11 DOM
-
2026-06-14days on market $125,000 New 9 DOM
-
2026-06-13days on market $125,000 New 8 DOM
-
2026-06-10days on market $125,000 New 6 DOM
-
2026-06-09days on market $125,000 New 5 DOM
-
2026-06-08days on market $125,000 New 4 DOM
-
2026-06-07remarks 699-char remark
-
2026-06-07$125,000 New 3 DOM
ⓘ Source: listings_history table (triggers on properties + properties_extension) + one-shot
backfill from property_details.listing_events for pre-trigger history.
Tax reassessment forecast GA · Resets to sale price
- Current annual tax
- $506 · $42/mo
- Projected year-2 tax
- $1,150 · $96/mo
- Expected delta
- +$644/yr (+$54/mo · 127.2%)
ⓘ Screening estimate from a state-policy table — verify with the county assessor before closing.
Climate risk First Street
- Flood 7/10 Severe FEMA zone X (unshaded) · 99% chance over 30 yrs
- Wildfire 3/10 Moderate
- Heat 7/10 Severe 7 d/yr ≥108°F today · 17 d/yr by 30 yrs out
- Wind 6/10 Major 66% chance of damaging wind over 30 yrs
- Air quality 4/10 Moderate 4 unhealthy d/yr today · 4 by 30 yrs out
Nearby sold comps map
Loading sold comps map…
Walkable amenities ~0.75 mi
Loading nearby amenities…
Taxation est. · year 1
- Rental income
- $13,514
- − Mortgage interest
- −$7,002
- − Property taxes
- −$506
- − Insurance
- −$1,422
- − Repairs & maintenance
- −$1,081
- − Management
- −$1,081
- − Depreciation
- −$3,636
- Taxable loss
- −$1,215
- Est. tax savings @ 24.0%
- +$292
- After-tax cash flow
- $1,173/yr
For passive investors: Depreciation is non-cash, so a rental often shows a tax loss while cash-flowing — sheltering income. Rental losses are passive: they offset passive income freely, and up to $25,000/yr can offset ordinary (W-2) income if you actively participate and your MAGI is under $100k (phasing out to $0 by $150k); unused losses carry forward. On sale, claimed depreciation is recaptured at up to 25%, and gains may owe capital-gains tax (a 1031 exchange can defer both). Figures are a year-1 estimate at your 24.0% rate — not tax advice; consult a CPA.
Schools (NCES district)
- District
- Bibb County
- NCES district ID
- 1300420
- Math proficiency
- 11% ▼ -14.00%
- Reading proficiency
- 18% ▼ -11.00%
- Median HH income
- $37,426
- Composite
- 12.13/100
- National rank
- #9654
- State rank
- #161 of 174 in GA
Livability — Macon-Bibb County
No livability data for this city. (Only ~50 U.S. cities are tracked.)
Census & demographics
- Census place
- Macon-Bibb County, GA
- County
- Bibb County · 164,332 people
- City population
- 143,186
- Metro
- Macon-Bibb County, GA
- Population (ZIP)
- 17,732
- Household income
- $44,809
- Rent vs Own
- Severe rent burden
- 391.0
Population outlook (Bibb County) Hauer SSP2
- Today (2025)
- 148,772 people
- By 2030
- 145,904 · -1.9%
- By 2040
- 139,404 · -6.3%
- By 2050
- 131,603 · -11.5%
- By 2075
- 111,050 · -25.4%
- By 2100
- 83,346 · -44.0%
Race, ethnicity, and origin ACS 2023
- Neighborhood character
- Majority Black (57%)
- Race & ethnicity
- Black 57% White 38% Two or more races 4% Hispanic / Latino 2%
- Common ancestry
- Slovak 1% Italian 1%
- Foreign-born
- 1% · Canada
- Languages at home
- 98% English-only · Spanish 1%
Political lean MEDSL · Bibb
- 2024 margin
- Strong D (+22.4) · D 61.0% · R 38.5%
- 2008→2024 swing
- +4.4pp toward D · 2008: 18.0pp · 2024: 22.4pp
- All cycles
- 2024: D+22.4 2020: D+23.8 2016: D+20.2 2012: D+20.0 2008: D+18.0
Not yet ingested
- Civics
- —
Market trends
- HPI YoY
- ▲ 4.31%
- Current HPI
- 209.9166
- Rent YoY
- ▲ 10.85%
- Metro
- Macon-Bibb County, GA
- State GDP YoY
- ▲ 2.66%
- F500 in state
- 28
Industry mix (Fortune 500 HQ in GA)
| Industry | F500 HQs | Revenue |
|---|---|---|
| Paper / Packaging | 2 | $29B |
|
||
| Retail | 1 | $160B |
|
||
| Transportation / Logistics | 1 | $91B |
|
||
| Airlines | 1 | $62B |
|
||
| Consumer Goods | 1 | $47B |
|
||
| Utilities | 1 | $25B |
|
||
Price history
+0.0% since first listed3 events — show timeline
- 2026-06-04 Listed $125,000 MGMLS
- 2026-06-04 Listed $125,000 CGMLS
- 2026-06-03 Listed $125,000 GAMLS
Property tax history
+13.1%/yrLatest (2025): $506 · -1.3% YoY. Source: county tax records.
Cash-flow waterfall
monthlySold comps — $/sqft
last 12 mo · ≤1 miLoading sold comps…