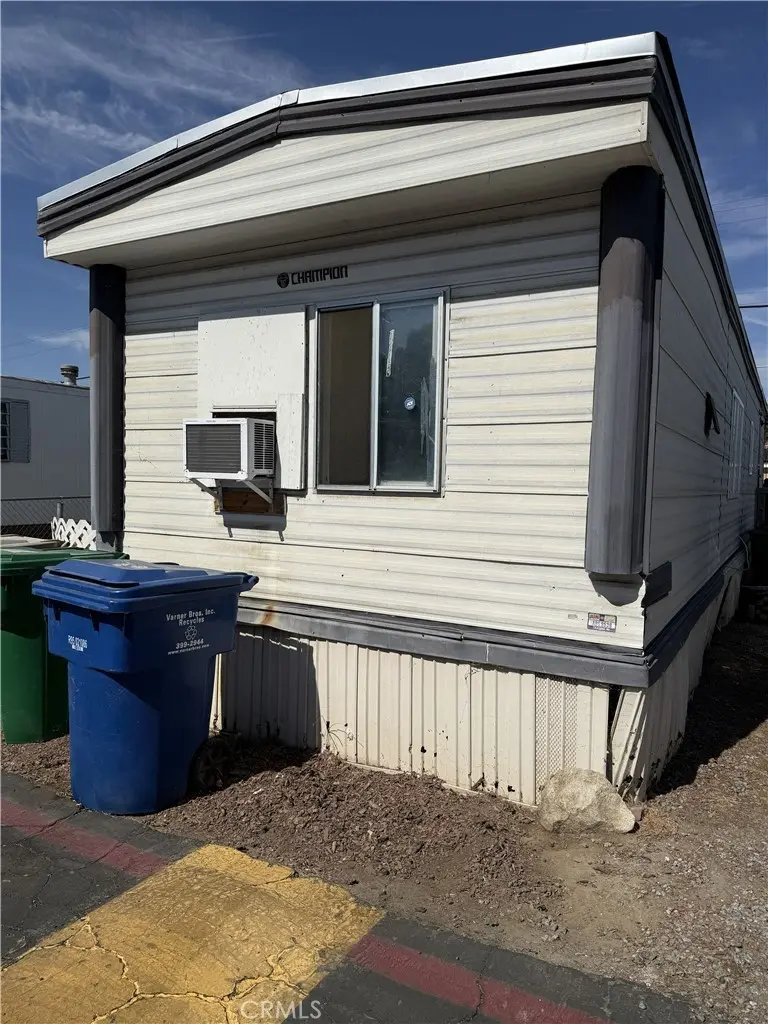
224 Mccord #4 · Oildale, CA
Flood risk 1/10 · Minimal
- FEMA flood zone
- X
- Chance of flooding over 30 yrs
- 0.0%
- Est. flood insurance / yr
- $507 – $1,088
Fire risk 5/10 · Moderate
- Est. fire insurance / yr
- $659 – $1,223
Heat risk 8/10 · Major
- Hot days now (above 105°F)
- 7 days/yr
- Hot days in 30 yrs
- 18 days/yr
Wind risk 1/10 · Minimal
- Chance of severe wind over 30 yrs
- —
Air-quality risk 10/10 · Severe
- Unhealthy air days now
- 39 days/yr
- Unhealthy air days in 30 yrs
- 45 days/yr
Risk factors via First Street. Map © Google.
Why this score? — see what drove the D grade
The composite is a weighted blend of 9 inputs, each scored 0–100. Each bar is that input's sub-score; the figure is the points it added to the 100-point composite (weight × sub-score).
- Cash flow +15.0/30.0
- ARV discount +7.5/15.0
- 1% rule +5.0/10.0
- DSCR +5.0/10.0
- Rent growth +3.1/5.0
- Livability +2.9/5.0
- Appreciation +2.7/10.0
- Condition / age +2.5/5.0
- Schools +1.0/10.0
$20,000
🖨 Deal sheet (PDF) 📄 Offer letter ✓ Due diligence
Listing remarks MLS
Ez Seller Financing On Nice Mobile Home-low Space Rent!new Carpet-whole Interior & Ext Like New!lots Of Cabinets & Strgnice, Adult Park!seller Finance W/ $2000 Down, Or Just Closing Costs!
Key facts
- Garage
- Built 1976
- Listed 38 days
Property features AI
Finance
- Other: Parcel number 11436004007; Directions: Take Highway 99 North. Exit on Airport Drive. Turn right on Roberts Lane, right on Plymouth, then left on Mccord.
- Financial info: Land lease of $500 monthly
- HOA & community: Part of an association; Community features include biking; Park name: Idle Wheels Mobile Homes Park; Manager approval required for residency; Pets: contact manager/park for details
Exterior
- Parking: Attached garage with space for 1 vehicle (total 1 parking space)
- Utilities: Public sewer; District/public water
- Home design: Single (mobile) home — Stylecrest model; Mobile home remains in place; Entry at front; Total of 1 story; Mobile dimensions approximately 12 ft. by 47 ft.
- Construction: Living area per public records; Year built per public records
- Exterior features: No pool; One shed on the property; Lot characterized as 0–1 unit per acre
Interior
- Bathrooms: 1 full bathroom
- Interior features: Front entry; One-level (single story) home
- Laundry & utility: Community laundry facilities
Neighborhood map
What this means for you Summary
Snapshot
- This is a 2-bed/1.0-bath manufactured listed at $20k.
Deal economics
- At list price, monthly cash flow is $708 ($8k/yr) — positive.
- The deal already cash-flows at list — no discount required.
- Meets the 1% rule at list price ($1k rent vs $20k).
- Recommended offer: $19k (3.0% below list) — sets the bar for market timing.
- Cap rate 48.8% vs local median 3.9% in Oildale — top-decile yield for the area; either an underpriced asset or a hidden risk that comps aren't pricing in. Stress-test before assuming the spread holds.
Location & tenants
- Location reads 58/100 on livability (#680 in CA) — a working-class tenant base; expect higher turnover. Strengths: housing A+; Watch: crime F, amenities F, commute F.
- Beardsley Elementary (suburban): math 7% / reading 18% proficiency, ranked #501 of 517 in CA (top 97%) — low school quality limits family demand, transient renter base, plan for 1-2y turnover; 76% free/reduced lunch — lower-income household profile, screen leases tightly.
- Zoned schools: North Beardsley Elementary (math 8% / reading 17%, grade F, #1,477 of 1,571 statewide, top 94%, 752 students, 98% FRL); Beardsley Junior High (math 8% / reading 22%, grade F, #461 of 498 statewide, top 93%, 400 students, 94% FRL); North High (reading 75%, 2,214 students, 87% FRL) — zoned schools average 93% FRL vs 76% district-wide (17 pts higher); higher-poverty schools than district average — tighter screening recommended.
- Market conditions: Rents rising (+2.2%/yr); 313 active listings in the ZIP; 18 comparable units currently listed for rent nearby; rentals leasing fast (median 5d on market — plan ~1-2 weeks tenant-placement turnaround); 3,244 units permitted in Kern County in 2024 (73 in 5+ unit buildings).
Forward outlook
- Local home prices are declining (-3.0%/yr); year-one equity from $138 of loan paydown is wiped out by about $600 of value loss. Plan a longer hold.
- Kern County population projected at +17% by 2050 — long-run rental-demand tailwind backs the buy-and-hold thesis.
- At projected returns (-3.0% appreciation + 2.2% rent growth), your $6k cash investment doubles in ~1 year — after that, you're playing with house money.
Negotiation context
- It's been on market 38 days — a 3% lower offer ($19k) is reasonable based on typical stale-listing flexibility.
- 2 sale attempts since 28y ago; this cycle's ask has dropped $5k (20%) from the opening price — seller is motivated, your offer sets the floor, not the list.
- Current owner paid $5k; list at $20k implies a 281% gain — meaningful room to come down on a strong offer.
Risks & watch-outs
- Climate carrying-cost: moderate wildfire risk; extreme-heat days projected 7→18/yr by 2055 (HVAC capex compounding) — expect insurance premiums to compound above CPI over the hold.
Questions for the listing agent
- It's been on market 38 days. Have you received any prior offers? Is the seller open to a 3% concession, seller financing, or rate buy-down credit?
- Built in 1976 — when were the roof, HVAC, electrical panel, plumbing, and water heater last replaced?
- Is there a deadline driving the sale (1031 exchange, divorce, estate, relocation)? That informs how much negotiation room exists.
- Schools are B-rated — typically a magnet for longer-tenancy family renters. What's the average tenant stay here, and is there a school-zone premium baked into asking?
- Crime grade is F in this area — have there been break-ins, vandalism, or insurance claims at this property in the last 3 years? What carrier currently insures it and at what premium?
- The area grade is low — what's the realistic commute time and amenity access for the typical tenant pool here? Any planned neighborhood developments (good or bad) we should know about?
- What's the average days-on-market for RENTAL listings here right now (not sales)? A rising rental-DOM trend means longer vacancies and softer asking-rent achievability than the comps imply.
- What's the recent tenant-quality profile in this submarket — average credit score on applications, eviction rate, late-payment / NSF rate, and stable-employment percentage? A property-management company in the area should have these aggregated.
- How much new for-sale + rental construction is in the pipeline within 1–3 miles? Heavy new supply typically softens prices + rents 12–24 months out; constrained supply supports both.
Investment metrics
- 1% rule
- 5.36% ✓
- Cap rate
- 48.78%
- Cash-on-cash
- 151.73%
- DSCR
- 7.75
- GRM
- 1.6
CMA / ARV
- ARV (median comp)
- $50,000
- List price
- $20,000
- Delta
- -60.00%
- Verdict
- UNDERPRICED
- Comps
- 3 within 1.0 mi
Show comp detail 1 sale within ~0.75 mi
| Address | Dist | Beds/Ba | Sqft | Sold | Price | $/sf | Match |
|---|---|---|---|---|---|---|---|
| 117 Harris Dr | 0.66mi | 3/2.0 (+1) | 560 (-1%) | 3mo | $180,000 | $321 | 56 |
Match score weights: distance 35% · size 25% · config 20% · recency 20%. Top-matched comps best support the ARV.
Projected returns pro-forma
-3.0% appreciation · 2.22% rent growth · sell at horizon
- IRR
- —
- Equity multiple
- 8.33×
- Total profit
- $41,039
- Equity at exit
- $2,982
- IRR
- —
- Equity multiple
- 17.16×
- Total profit
- $90,504
- Equity at exit
- $1,729
Cash invested: $5,600 (down + closing). Projections, not guarantees.
Landlord ↔ Tenant lean methodology
- Overall (STATE)
- 18 Strongly Tenant-Friendly
- State California
- 18 Strongly Tenant-Friendly · D+13
- County
- — inherits STATE
- City
- — inherits STATE
ZIP-level market 93308
- Home prices YoY
- -0.5%
- Rents YoY
- 2.2%
- Active inventory
- 313
- Price-to-rent
- 1.6×
Monthly cashflow live
- Estimated rent
- $1,071 high interval (Pro) →
- Mortgage (P&I)
- −$105
- Tax est. 1.5%
- −$25 /mo · $300/yr
- Insurance
- −$8
- HOA
- −$0
- Vacancy / Maint / Mgmt
- −$225
- Net cashflow
- $708
Break-even live
Sensitivity live
| Price | -10% $722 | -5% $715 | +0% $708 | +5% $701 | +10% $694 |
|---|---|---|---|---|---|
| Rent | -10% $623 | -5% $666 | +0% $708 | +5% $750 | +10% $793 |
| Rate | -1.0pp $718 | -0.5pp $713 | base $708 | +0.5pp $703 | +1.0pp $698 |
UW: 25.0% down · 7.5% · 30yr · 1.5% tax · 5.0% vac · 8.0% maint · 8.0% mgmt
Financing live
Cash to close
- Down payment
- $5,000
- Closing costs
- $600
- Reserves months
- —
- Total cash needed
- —
Loan-product check · same deal, 3 products live
Conventional
25% down · 7.5% · 30yr
- Down + closing
- —
- Monthly P&I
- —
- Monthly cashflow
- —
- DSCR
- —
- Eligible?
- —
Personal DTI + credit; lowest rate.
DSCR
20% down · 8.5% · 30yr
- Down + closing
- —
- Monthly P&I
- —
- Monthly cashflow
- —
- DSCR
- —
- Eligible?
- —
No personal income docs; deal must DSCR.
Hard money
10% down · 12.0% · 12mo
- Down + closing
- —
- Monthly P&I
- —
- Monthly cashflow
- —
- DSCR
- —
- Eligible?
- —
Short-term bridge; refi at stabilization.
Rent comps 18 comps
| Address | Beds | Baths | Sqft | Rent | $/sqft | DOM | Units | Dist |
|---|---|---|---|---|---|---|---|---|
| 214 Beardsley Ave Bakersfield, CA | 1.0 | 1.0 | 450 | $850 | $1.89 | 5d | 1 | 0.19mi |
| 214 Beardsley Ave Unit 12 Bakersfield, CA | 2.0 | 2.0 | 655 | $1,095 | $1.67 | 5d | 1 | 0.19mi |
| 214 Beardsley Ave Unit 11 Bakersfield, CA | 1.0 | 1.0 | 650 | $950 | $1.46 | 5d | 1 | 0.19mi |
| 210 Beardsley Ave Unit 8 Bakersfield, CA | 1.0 | 1.0 | 650 | $895 | $1.38 | 5d | 1 | 0.20mi |
| 313 Beardsley Ave Unit 315 B Bakersfield, CA | 1.0 | 1.0 | 550 | $850 | $1.55 | 5d | 1 | 0.24mi |
| 502 Beardsley Ave Unit T Bakersfield, CA | 1.0 | 1.0 | 624 | $950 | $1.52 | 46d | 1 | 0.36mi |
| 701 Lilac St Unit 1/2 Bakersfield, CA | 1.0 | 1.0 | 400 | $895 | $2.24 | 5d | 1 | 0.50mi |
| 126 Wilson Ave Unit B Bakersfield, CA | 1.0 | 1.0 | 650 | $850 | $1.31 | 16d | 1 | 0.66mi |
| 117 Harris Dr Bakersfield, CA | 2.0 | 1.0 | 560 | $1,300 | $2.32 | 21d | 1 | 0.68mi |
| 611 Wilson Ave Unit B Bakersfield, CA | 2.0 | 1.0 | 750 | $1,195 | $1.59 | 46d | 1 | 0.78mi |
| 1405 Yosemite Dr Unit 1405 Bakersfield, CA | 2.0 | 1.0 | 712 | $1,100 | $1.54 | 46d | 1 | 0.89mi |
| 611 Ann Arbor Dr Unit A Bakersfield, CA | 1.0 | 1.0 | 650 | $1,100 | $1.69 | 46d | 1 | 0.95mi |
| 901 W Columbus St Bakersfield, CA | 1.0–2.0 | 1.0 | 807 | $1,425 | $1.77 | 5d | 12 | 1.07mi |
| 1905 McCray St Bakersfield, CA | 2.0 | 1.0 | 736 | $1,450 | $1.97 | 5d | 1 | 1.12mi |
| 3850 Q St Bakersfield, CA | 1.0 | 1.0 | 531 | $1,100 | $2.07 | 5d | 1 | 1.21mi |
| 3800 Q St Bakersfield, CA | 1.0 | 1.0 | 495 | $1,075 | $2.17 | 5d | 4 | 1.24mi |
| 3701 Q St Bakersfield, CA | 2.0 | 1.0 | 615 | $1,200 | $1.95 | 5d | 5 | 1.31mi |
| 615 W China Grade Loop Bakersfield, CA | 1.0–2.0 | 1.0–2.0 | 875 | $1,850 | $2.11 | 5d | 6 | 1.37mi |
Listing history 20 events
-
2026-06-22days on market $20,000 Active 38 DOM
-
2026-06-18days on market $20,000 Active 35 DOM
-
2026-06-17days on market $20,000 Active 34 DOM
-
2026-06-16days on market $20,000 Active 33 DOM
-
2026-06-15days on market $20,000 Active 32 DOM
-
2026-06-14days on market $20,000 Active 30 DOM
-
2026-06-10pricedays on market $20,000 Active 27 DOM
-
2026-06-09days on market $25,000 Active 26 DOM
-
2026-06-08days on market $25,000 Active 25 DOM
-
2026-06-07days on market $25,000 Active 24 DOM
-
2026-06-05days on market $25,000 Active 21 DOM
-
2026-06-03days on market $25,000 Active 20 DOM
-
2026-06-03days on market $25,000 Active 19 DOM
-
2026-06-01days on market $25,000 Active 18 DOM
-
2026-05-31days on market $25,000 Active 17 DOM
-
2026-05-14$25,000 Active 561-char remark
-
1998-09-08soldstatus $5,250 207-char remark
Show marketing remark (207 chars)
Ez Seller Financing On Nice Mobile Home-low Space Rent!new Carpet-whole Interior & Ext Like New!lots Of Cabinets & Strgnice, Adult Park!seller Finance W/ $2000 Down, Or Just Closing Costs!
-
1998-08-18historical 207-char remark
Show marketing remark (207 chars)
Ez Seller Financing On Nice Mobile Home-low Space Rent!new Carpet-whole Interior & Ext Like New!lots Of Cabinets & Strgnice, Adult Park!seller Finance W/ $2000 Down, Or Just Closing Costs!
-
1998-08-18price $6,950 207-char remark
Show marketing remark (207 chars)
Ez Seller Financing On Nice Mobile Home-low Space Rent!new Carpet-whole Interior & Ext Like New!lots Of Cabinets & Strgnice, Adult Park!seller Finance W/ $2000 Down, Or Just Closing Costs!
-
1998-06-16$5,250 207-char remark
Show marketing remark (207 chars)
Ez Seller Financing On Nice Mobile Home-low Space Rent!new Carpet-whole Interior & Ext Like New!lots Of Cabinets & Strgnice, Adult Park!seller Finance W/ $2000 Down, Or Just Closing Costs!
ⓘ Source: listings_history table (triggers on properties + properties_extension) + one-shot
backfill from property_details.listing_events for pre-trigger history.
Climate risk First Street
- Flood 1/10 Low FEMA zone X · 0% chance over 30 yrs
- Wildfire 5/10 Major
- Heat 8/10 Severe 7 d/yr ≥105°F today · 18 d/yr by 30 yrs out
- Wind 1/10 Low
- Air quality 10/10 Extreme 39 unhealthy d/yr today · 45 by 30 yrs out
Nearby sold comps map
Loading sold comps map…
Walkable amenities ~0.75 mi
Loading nearby amenities…
Taxation est. · year 1
- Rental income
- $12,855
- − Mortgage interest
- −$1,120
- − Property taxes
- −$300
- − Insurance
- −$100
- − Repairs & maintenance
- −$1,028
- − Management
- −$1,028
- − Depreciation
- −$582
- Taxable income
- $8,696
- Est. tax owed @ 24.0%
- −$2,087
- After-tax cash flow
- $6,410/yr
For passive investors: Depreciation is non-cash, so a rental often shows a tax loss while cash-flowing — sheltering income. Rental losses are passive: they offset passive income freely, and up to $25,000/yr can offset ordinary (W-2) income if you actively participate and your MAGI is under $100k (phasing out to $0 by $150k); unused losses carry forward. On sale, claimed depreciation is recaptured at up to 25%, and gains may owe capital-gains tax (a 1031 exchange can defer both). Figures are a year-1 estimate at your 24.0% rate — not tax advice; consult a CPA.
Schools (NCES district)
- District
- Beardsley Elementary
- NCES district ID
- 0604260
- Math proficiency
- 7% ▼ -12.00%
- Reading proficiency
- 18% ▼ -16.00%
- Median HH income
- $28,808
- Composite
- 9.63/100
- National rank
- #9841
- State rank
- #501 of 517 in CA
Livability — Oildale
- Score
- 58/100
- State rank
- #680
- US rank
- #20848
Category grades
Schools grade is shown separately in the Schools card above.
Census & demographics
- Census place
- Oildale, CA
- County
- Kern County · 710,371 people
- Metro
- Bakersfield, CA
- Population (ZIP)
- 55,078
- Household income
- $62,445
- Rent vs Own
- Severe rent burden
- 2931.0
Population outlook (Kern County) Hauer SSP2
- Today (2025)
- 947,286 people
- By 2030
- 978,984 · +3.3%
- By 2040
- 1,045,018 · +10.3%
- By 2050
- 1,105,232 · +16.7%
- By 2075
- 1,229,538 · +29.8%
- By 2100
- 1,238,059 · +30.7%
Race, ethnicity, and origin ACS 2023
- Neighborhood character
- Diverse neighborhood (Simpson 0.57)
- Race & ethnicity
- White 57% Hispanic / Latino 32% Two or more races 15% Black 3% Asian 3% Native American 1%
- Hispanic origin (detail)
- Mexican 26%
- Common ancestry
- Slovak 3% Italian 1% Romanian 1%
- Foreign-born
- 8% · Canada, Vietnam
- Languages at home
- 80% English-only · Spanish 17%
Political lean MEDSL · Kern
- 2024 margin
- Strong R (+21.1) · D 38.2% · R 59.3% · Other 2.5%
- 2008→2024 swing
- -3.3pp toward R · 2008: -17.8pp · 2024: -21.1pp
- All cycles
- 2024: R+21.1 2020: R+10.2 2016: R+15.0 2012: R+20.9 2008: R+17.8
Not yet ingested
- Civics
- —
Market trends
- HPI YoY
- ▼ -4.52%
- Current HPI
- 825.65
- Rent YoY
- ▲ 2.22%
- Metro
- Bakersfield, CA
- State GDP YoY
- ▲ 3.21%
- F500 in state
- 116
Industry mix (Fortune 500 HQ in CA)
| Industry | F500 HQs | Revenue |
|---|---|---|
| Technology | 27 | $1,492B |
|
||
| Financial Services | 3 | $174B |
|
||
| Retail | 3 | $44B |
|
||
| Insurance | 3 | $26B |
|
||
| Media / Entertainment | 2 | $115B |
|
||
| Pharmaceuticals / Biotech | 2 | $62B |
|
||
Price history
+281.0% since first listed6 events — show timeline
- 2026-06-09 Price Changed $20,000 CRMLS
- 2026-05-14 Listed $25,000 CRMLS
- 1998-09-08 Sold (MLS) $5,250 GEMLS
- 1998-08-18 Price Changed $6,950 GEMLS
- 1998-08-18 Delisted — GEMLS
- 1998-06-16 Listed $5,250 GEMLS
Cash-flow waterfall
monthlySold comps — $/sqft
last 12 mo · ≤1 miLoading sold comps…