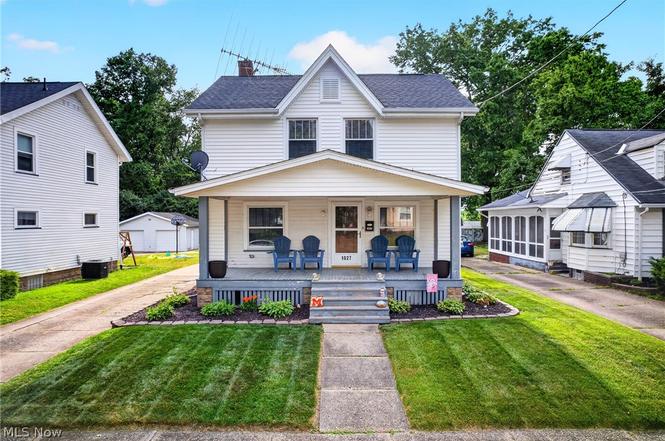
1027 2nd St NE · Massillon, OH
Flood risk 1/10 · Minimal
- FEMA flood zone
- X (unshaded)
- Chance of flooding over 30 yrs
- 0.0%
- Est. flood insurance / yr
- $473 – $860
Fire risk 1/10 · Minimal
- Est. fire insurance / yr
- $713 – $1,323
Heat risk 3/10 · Minor
- Hot days now (above 97°F)
- 7 days/yr
- Hot days in 30 yrs
- 17 days/yr
Wind risk 1/10 · Minimal
- Chance of severe wind over 30 yrs
- —
Air-quality risk 2/10 · Minimal
- Unhealthy air days now
- 0 days/yr
- Unhealthy air days in 30 yrs
- 1 days/yr
Risk factors via First Street. Map © Google.
Why this score? — see what drove the C grade
The composite is a weighted blend of 9 inputs, each scored 0–100. Each bar is that input's sub-score; the figure is the points it added to the 100-point composite (weight × sub-score).
- Cash flow +18.3/30.0
- ARV discount +15.0/15.0
- DSCR +5.7/10.0
- 1% rule +4.7/10.0
- Rent growth +4.0/5.0
- Schools +4.0/10.0
- Livability +3.7/5.0
- Condition / age +2.5/5.0
- Appreciation +0.0/10.0
$154,900
🖨 Deal sheet (PDF) 📄 Offer letter ✓ Due diligence
Listing remarks MLS
This charming house has so much to offer. Starting with 4 bedrooms and an additional craft or bonus room this home has all the space you need. This home boasts of hardwood floors and great wood work. The large bathroom up upstairs features a beautiful claw foot tub, new flooring and paint. The Kitchen is large with plenty of cabinet space and a eat in kitchen. No need to buy kitchen appliances because they are all staying with the house. The Living room is large and has a fireplace for those cold nights. The dining room offers plenty of space for those large get togethers. The basement is completely dry and is partially finished with a full shower. The mechanical updates are all recently done including a High efficiency furnace, central air, hot water tank, newer windows and new roof. The large 2 car garage plus a shed is also a rare find. This home is move in ready.
Key facts
- Flex room
- Above-ground pool
- Fenced backyard
Tags
Property features AI
Exterior
- Parking: Detached garage with two spaces; Garage with electricity and garage door opener; Paved parking
- Utilities: Public water; Public sewer
- Home design: Two-story home; Asphalt and fiberglass roof; Vinyl siding
- Construction: Built according to public records; Vinyl siding construction; Asphalt/Fiberglass roof
- Exterior features: Enclosed porch; Patio; Outbuilding/storage; Private pool
Interior
- Bathrooms: Two full bathrooms; One half bathroom
- Heating & cooling: Forced air heating (gas); Central air conditioning
- Interior features: Full, partially finished basement; One fireplace
Neighborhood map
What this means for you Summary
Snapshot
- This is a 4-bed/1.5-bath single-family listed at $155k.
Deal economics
- At list price, monthly cash flow is $142 ($2k/yr) — positive.
- The deal already cash-flows at list — no discount required.
- To meet the 1% rule (rent ≥ 1% of price), the offer needs to be $150k (3.2% below list).
- Recommended offer: $150k (3.2% below list) — sets the bar for 1% rule.
- Cap rate 7.4% vs local median 3.9% in Massillon — top-decile yield for the area; either an underpriced asset or a hidden risk that comps aren't pricing in. Stress-test before assuming the spread holds.
Location & tenants
- Location reads 74/100 on livability (#306 in OH, #4,928 nationally) — a middle-class / working-renter tenant base. Strengths: cost of living A+, housing A+, health & safety A-; Watch: employment C-, amenities F, commute F.
- Massillon City (urban): math 43% / reading 52% proficiency, ranked #487 of 656 in OH (top 74%) — families likely to look elsewhere, expect single-tenant / working-renter base with shorter leases; 60% free/reduced lunch — lower-income household profile, screen leases tightly.
- Zoned schools: Whittier Elementary School (math 57% / reading 62%, grade B-, #670 of 1,584 statewide, top 45%, 363 students, 0% FRL); Massillon Intermediate School (math 38% / reading 51%, grade D, #477 of 654 statewide, top 74%, 880 students, 0% FRL); Washington High School (math 30% / reading 59%, grade F, #470 of 781 statewide, top 62%, 1,179 students, 0% FRL) — zoned schools average 0% FRL vs 60% district-wide (60 pts lower); this property's tenant base skews higher-income than the district average.
- Market conditions: Rents rising fast (+6.0%/yr); 209 active listings in the ZIP; 2 comparable units currently listed for rent nearby; 528 units permitted in Stark County in 2024 (84 in 5+ unit buildings).
Forward outlook
- Local home prices are declining (-3.0%/yr); year-one equity from $1k of loan paydown is wiped out by about $5k of value loss. Plan a longer hold.
- Stark County population projected to shrink 8% by 2050 — rents likely to lag national; underwrite the cash flow, not the appreciation.
Negotiation context
- Only 3 days on market — expect competitive offers; lowballing is unlikely to land.
- 3 sale attempts since 12y ago with the ask held roughly flat each time — persistent listings suggest the price (not the market) is what's stuck; bring a comps-based counter.
- Current owner paid $76k; list at $155k implies a 102% gain — meaningful room to come down on a strong offer.
Risks & watch-outs
- Watch-outs: built in 1928 — expect roof / HVAC / electrical / plumbing capex.
Questions for the listing agent
- Built in 1928 — when were the roof, HVAC, electrical panel, plumbing, and water heater last replaced?
- Is there a deadline driving the sale (1031 exchange, divorce, estate, relocation)? That informs how much negotiation room exists.
- Schools are B-rated — typically a magnet for longer-tenancy family renters. What's the average tenant stay here, and is there a school-zone premium baked into asking?
- What's the average days-on-market for RENTAL listings here right now (not sales)? A rising rental-DOM trend means longer vacancies and softer asking-rent achievability than the comps imply.
- What's the recent tenant-quality profile in this submarket — average credit score on applications, eviction rate, late-payment / NSF rate, and stable-employment percentage? A property-management company in the area should have these aggregated.
- How much new for-sale + rental construction is in the pipeline within 1–3 miles? Heavy new supply typically softens prices + rents 12–24 months out; constrained supply supports both.
Investment metrics
- 1% rule
- 0.97% ✗
- Cap rate
- 7.39%
- Cash-on-cash
- 3.92%
- DSCR
- 1.17
- GRM
- 8.6
CMA / ARV
- ARV (on-the-fly)
- $221,064
- Comps found
- 12
Show comp detail 12 sales within ~0.75 mi
| Address | Dist | Beds/Ba | Sqft | Sold | Price | $/sf | Match |
|---|---|---|---|---|---|---|---|
| 1110 2nd St NE | 0.09mi | 3/2.0 (-1) | 1,632 (-10%) | 3mo | $239,900 | $147 | 69 |
| 727 Amherst Rd NE | 0.46mi | 3/1.5 (-1) | 1,764 (-3%) | 5mo | $169,000 | $96 | 65 |
| 827 Amherst Rd NE | 0.37mi | 3/1.0 (-1) | 1,910 (+5%) | 9mo | $133,000 | $70 | 59 |
| 815 Amherst Rd NE | 0.38mi | 3/2.0 (-1) | 1,622 (-10%) | 0mo | $45,000 | $28 | 58 |
| 416 3rd St NE | 0.59mi | 4/3.0 | 1,716 (-5%) | 3mo | $175,000 | $102 | 55 |
| 1013 Lake Ave NE | 0.57mi | 4/2.5 | 1,888 (+4%) | 10mo | $230,000 | $122 | 54 |
| 1309 11th St NE | 0.64mi | 3/2.5 (-1) | 1,864 (+3%) | 3mo | $370,000 | $198 | 54 |
| 415 Valeside Ave NE | 0.57mi | 4/2.0 | 1,560 (-14%) | 2mo | $284,900 | $183 | 47 |
| 826 Bennington Ave NE | 0.54mi | 3/1.0 (-1) | 1,662 (-8%) | 9mo | $208,500 | $125 | 47 |
| 433 7th St NE | 0.60mi | 4/1.5 | 2,064 (+14%) | 4mo | $167,500 | $81 | 46 |
| 1220 11th St NE | 0.66mi | 3/2.5 (-1) | 1,668 (-8%) | 5mo | $239,900 | $144 | 43 |
| 710 North Ave NE | 0.73mi | 3/2.0 (-1) | 1,579 (-13%) | 6mo | $130,000 | $82 | 33 |
Match score weights: distance 35% · size 25% · config 20% · recency 20%. Top-matched comps best support the ARV.
Projected returns pro-forma
-3.0% appreciation · 6.04% rent growth · sell at horizon
- IRR
- -6.9%
- Equity multiple
- 0.74×
- Total profit
- $-11,358
- Equity at exit
- $23,096
- IRR
- 6.1%
- Equity multiple
- 1.52×
- Total profit
- $22,372
- Equity at exit
- $13,393
Cash invested: $43,372 (down + closing). Projections, not guarantees.
Landlord ↔ Tenant lean methodology
- Overall (STATE)
- 73 Landlord-Friendly
- State Ohio
- 73 Landlord-Friendly · R+6
- County
- — inherits STATE
- City
- — inherits STATE
ZIP-level market 44646
- Rents YoY
- 6.0%
- Active inventory
- 209
- Price-to-rent
- 8.6×
Monthly cashflow live
- Estimated rent
- $1,499 medium interval (Pro) →
- Mortgage (P&I)
- −$812
- Tax from tax record
- −$166 /mo · $1,989/yr
- Insurance
- −$65
- HOA
- −$0
- Vacancy / Maint / Mgmt
- −$315
- Net cashflow
- $142
Break-even live
Sensitivity live
| Price | -10% $229 | -5% $185 | +0% $142 | +5% $98 | +10% $54 |
|---|---|---|---|---|---|
| Rent | -10% $23 | -5% $82 | +0% $142 | +5% $201 | +10% $260 |
| Rate | -1.0pp $220 | -0.5pp $181 | base $142 | +0.5pp $101 | +1.0pp $61 |
UW: 25.0% down · 7.5% · 30yr · 1.5% tax · 5.0% vac · 8.0% maint · 8.0% mgmt
Financing live
Cash to close
- Down payment
- $38,725
- Closing costs
- $4,647
- Reserves months
- —
- Total cash needed
- —
Loan-product check · same deal, 3 products live
Conventional
25% down · 7.5% · 30yr
- Down + closing
- —
- Monthly P&I
- —
- Monthly cashflow
- —
- DSCR
- —
- Eligible?
- —
Personal DTI + credit; lowest rate.
DSCR
20% down · 8.5% · 30yr
- Down + closing
- —
- Monthly P&I
- —
- Monthly cashflow
- —
- DSCR
- —
- Eligible?
- —
No personal income docs; deal must DSCR.
Hard money
10% down · 12.0% · 12mo
- Down + closing
- —
- Monthly P&I
- —
- Monthly cashflow
- —
- DSCR
- —
- Eligible?
- —
Short-term bridge; refi at stabilization.
Rent comps 2 comps
| Address | Beds | Baths | Sqft | Rent | $/sqft | DOM | Units | Dist |
|---|---|---|---|---|---|---|---|---|
| 1040 Stuart St NW Massillon, OH | 3.0 | 2.0 | 1870 | $1,595 | $0.85 | 45d | 1 | 1.24mi |
| 709 3rd St SE Massillon, OH | 4.0 | 1.5 | 1233 | $1,300 | $1.05 | 45d | 1 | 1.45mi |
Listing history 5 events
-
2026-06-19status $154,900 Pending 3 DOM
-
2026-06-18days on market $154,900 Active 3 DOM
-
2026-06-17days on market $154,900 Active 2 DOM
-
2026-06-15remarks 687-char remark
-
2026-06-15$154,900 Active 1 DOM
ⓘ Source: listings_history table (triggers on properties + properties_extension) + one-shot
backfill from property_details.listing_events for pre-trigger history.
Tax reassessment forecast OH · Partial reset (capped growth)
- Current annual tax
- $1,989 · $166/mo
- Projected year-2 tax
- $2,203 · $184/mo
- Expected delta
- +$214/yr (+$18/mo · 10.7%)
ⓘ Screening estimate from a state-policy table — verify with the county assessor before closing.
Climate risk First Street
- Flood 1/10 Low FEMA zone X (unshaded) · 0% chance over 30 yrs
- Wildfire 1/10 Low
- Heat 3/10 Moderate 7 d/yr ≥97°F today · 17 d/yr by 30 yrs out
- Wind 1/10 Low
- Air quality 2/10 Low 0 unhealthy d/yr today · 1 by 30 yrs out
Nearby sold comps map
Loading sold comps map…
Walkable amenities ~0.75 mi
Loading nearby amenities…
Taxation est. · year 1
- Rental income
- $17,986
- − Mortgage interest
- −$8,677
- − Property taxes
- −$1,989
- − Insurance
- −$774
- − Repairs & maintenance
- −$1,439
- − Management
- −$1,439
- − Depreciation
- −$4,506
- Taxable loss
- −$838
- Est. tax savings @ 24.0%
- +$201
- After-tax cash flow
- $1,899/yr
For passive investors: Depreciation is non-cash, so a rental often shows a tax loss while cash-flowing — sheltering income. Rental losses are passive: they offset passive income freely, and up to $25,000/yr can offset ordinary (W-2) income if you actively participate and your MAGI is under $100k (phasing out to $0 by $150k); unused losses carry forward. On sale, claimed depreciation is recaptured at up to 25%, and gains may owe capital-gains tax (a 1031 exchange can defer both). Figures are a year-1 estimate at your 24.0% rate — not tax advice; consult a CPA.
Schools (NCES district)
- District
- Massillon City
- NCES district ID
- 3904435
- Math proficiency
- 43% ▼ -14.00%
- Reading proficiency
- 52% ▼ -11.00%
- Median HH income
- $38,094
- Composite
- 39.54/100
- National rank
- #3941
- State rank
- #487 of 656 in OH
Livability — Massillon
- Score
- 74/100
- State rank
- #306
- US rank
- #4928
Category grades
Schools grade is shown separately in the Schools card above.
Census & demographics
- Census place
- Massillon, OH
- County
- Stark County · 272,865 people
- City population
- 65,858
- Metro
- Canton-Massillon, OH
- Population (ZIP)
- 47,741
- Household income
- $69,179
- Rent vs Own
- Severe rent burden
- 1011.0
Population outlook (Stark County) Hauer SSP2
- Today (2025)
- 373,708 people
- By 2030
- 371,245 · -0.7%
- By 2040
- 361,331 · -3.3%
- By 2050
- 345,290 · -7.6%
- By 2075
- 302,669 · -19.0%
- By 2100
- 238,870 · -36.1%
Race, ethnicity, and origin ACS 2023
- Neighborhood character
- Predominantly White (86%)
- Race & ethnicity
- White 86% Black 7% Two or more races 5% Hispanic / Latino 3% Asian 1%
- Common ancestry
- Lithuanian 3% Romanian 2% Scandinavian 2%
- Foreign-born
- 2% · Canada, China
- Languages at home
- 97% English-only · Spanish 1% Other Indo-European 1%
Political lean MEDSL · Stark
- 2024 margin
- Strong R (+21.9) · D 38.6% · R 60.5%
- 2008→2024 swing
- -27.4pp toward R · 2008: 5.5pp · 2024: -21.9pp
- All cycles
- 2024: R+21.9 2020: R+18.5 2016: R+17.4 2012: R+0.4 2008: D+5.5
Not yet ingested
- Civics
- —
Market trends
- HPI YoY
- ▼ -190.31%
- Current HPI
- 217.8955
- Rent YoY
- ▲ 6.04%
- Metro
- Canton-Massillon, OH
- State GDP YoY
- ▲ 1.98%
- F500 in state
- 48
Industry mix (Fortune 500 HQ in OH)
| Industry | F500 HQs | Revenue |
|---|---|---|
| Insurance | 3 | $145B |
|
||
| Industrial Machinery | 3 | $49B |
|
||
| Financial Services | 3 | $24B |
|
||
| Consumer Goods | 2 | $93B |
|
||
| Aerospace / Defense | 2 | $47B |
|
||
| Utilities | 2 | $33B |
|
||
Price history
+63.2% since first listed7 events — show timeline
- 2026-06-15 Listed $154,900 MLSNOW
- 2015-03-02 Sold (Public Records) $76,500 Public Records
- 2015-03-02 Sold (MLS) $76,500 MLSNOW
- 2015-01-20 Listing Removed — MLSNOW
- 2014-11-20 Listed $79,900 MLSNOW
- 2014-10-21 Listing Removed — MLSNOW
- 2014-07-21 Listed $94,900 MLSNOW
Property tax history
+5.9%/yrLatest (2024): $1,989 · +7.8% YoY. Source: county tax records.
Cash-flow waterfall
monthlySold comps — $/sqft
last 12 mo · ≤1 miLoading sold comps…