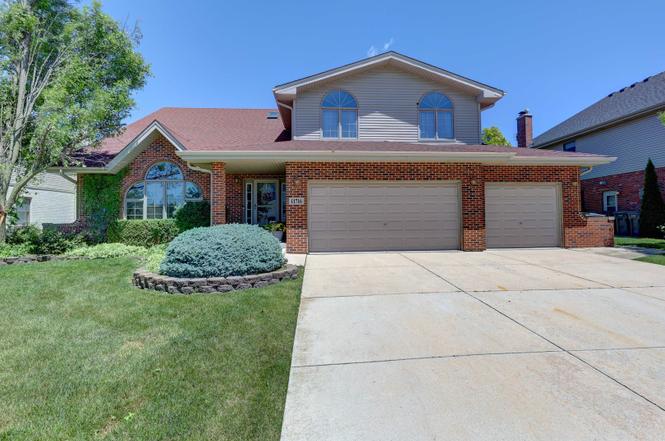
11716 Bolton Ln · Orland Park, IL
Flood risk 1/10 · Minimal
- FEMA flood zone
- X (unshaded)
- Chance of flooding over 30 yrs
- 0.0%
- Est. flood insurance / yr
- $473 – $860
Fire risk 3/10 · Minor
- Est. fire insurance / yr
- $804 – $1,492
Heat risk 3/10 · Minor
- Hot days now (above 102°F)
- 7 days/yr
- Hot days in 30 yrs
- 15 days/yr
Wind risk 2/10 · Minimal
- Chance of severe wind over 30 yrs
- —
Air-quality risk 2/10 · Minimal
- Unhealthy air days now
- 1 days/yr
- Unhealthy air days in 30 yrs
- 1 days/yr
Risk factors via First Street. Map © Google.
Why this score? — see what drove the D grade
The composite is a weighted blend of 9 inputs, each scored 0–100. Each bar is that input's sub-score; the figure is the points it added to the 100-point composite (weight × sub-score).
- Cash flow +12.7/30.0
- ARV discount +7.6/15.0
- 1% rule +4.4/10.0
- Livability +4.2/5.0
- DSCR +3.8/10.0
- Schools +3.4/10.0
- Rent growth +2.5/5.0
- Condition / age +2.5/5.0
- Appreciation +0.0/10.0
$639,900
🖨 Deal sheet (PDF) 📄 Offer letter ✓ Due diligence
Listing remarks
The home you've been longing for in popular Long Run Creek community! Original owners have lovingly taken care of this 6 Bedroom oversized house with over 3,000 Square Feet Plus Finished Lower Level! Your beautifully maintained two-story home is designed for today's growing and multi-generational households. Built in 2001 and offering 6 bedrooms, 3.5 bathrooms, a 3 car attached garage, and exceptional living space on every level, this home provides the flexibility buyers have been searching for. The second floor features four generously sized bedrooms, large closets throughout, including a private primary suite enhanced with a vaulted wood-beam ceiling, walk-in closet, and en suite bath wit
Key facts
- First-floor bedroom
- Walk-in closet
- Bright living room
Tags
Property features AI
Finance
- Other: Possession negotiable; Earnest money is held; Living area source: assessor
- HOA & community: No required master association fee; Community features include curbs, sidewalks and street lights
Exterior
- Parking: Attached garage owned with 3 garage spaces; Concrete driveway; Garage door opener
- Utilities: Public water; Public sewer; Electric with circuit breakers
- Home design: Detached single-family home; Two-story home; Fee simple ownership; Age approximately 21–25 years
- Construction: Brick exterior; Asphalt roof; Built within last 25 years
- Exterior features: Lot approximately 132 x 75; Less than 0.25 acre lot; Curbs, sidewalks and street lights in the neighborhood; Directions: Wolf Road to 139th Street west to Preston, south to Bolton Ave., west to 11716
Interior
- Kitchen: Kitchen with eating area/table space; Granite counters; Ceramic tile flooring in kitchen; Range; Microwave; Dishwasher
- Bedrooms: Five bedrooms with a possible sixth; One bedroom located below grade; Master bedroom on second floor with whirlpool and separate shower; Bedroom sizes include: 16 x 13, 14 x 13, 14 x 12, 12 x 10, 23 x 17
- Flooring: Hardwood flooring in main living areas; Carpet in most bedrooms and finished basement rooms; Ceramic tile in kitchen, eating area and mud room
- Bathrooms: Three full bathrooms; One half bathroom; Basement includes a bathroom; Master bath includes whirlpool and separate shower
- Heating & cooling: Natural gas heating; Forced air; Multiple heating systems (2+); Zoned heating; Central air conditioning; Zoned cooling
- Interior features: First-floor bedroom; Walk-in closets; Beamed ceilings; Open floor plan; Granite counters; Separate dining room; Storm door(s); Finished full basement; 13 total rooms
- Laundry & utility: Laundry in basement; Washer and dryer included; Laundry chute; Utility room on main level (14 x 11)
Neighborhood map
What this means for you Summary
Snapshot
- This is a 4-bed/3.0-bath single-family listed at $640k.
Deal economics
- At list price, monthly cash flow is $-65 ($-774/yr) — negative.
- To cash-flow at today's rent, offer at most $629k (1.8% below list).
- To meet the 1% rule (rent ≥ 1% of price), the offer needs to be $600k (6.2% below list).
- Recommended offer: $600k (6.2% below list) — sets the bar for 1% rule.
- Cap rate 6.2% vs local median 4.5% in Orland Park — top-decile yield for the area; either an underpriced asset or a hidden risk that comps aren't pricing in. Stress-test before assuming the spread holds.
Location & tenants
- Location reads 85/100 on livability (#29 in IL, #529 nationally) — a professional / high-income tenant draw. Strengths: crime A+, amenities A+, commute A+.
- Cons Hsd 230 (suburban): math 35% / reading 39% proficiency, ranked #146 of 620 in IL (top 24%) — families likely to look elsewhere, expect single-tenant / working-renter base with shorter leases.
- Zoned schools: Carl Sandburg High School (math 41% / reading 45%, grade F, #72 of 693 statewide, top 10%, 2,894 students, 0% FRL).
- Market conditions: 118 active listings in the ZIP; 1 comparable units currently listed for rent nearby; 6,272 units permitted in Cook County in 2024 (4,658 in 5+ unit buildings).
Forward outlook
- Local home prices are declining (-3.0%/yr); year-one equity from $4k of loan paydown is wiped out by about $19k of value loss. Plan a longer hold.
Negotiation context
- Only 5 days on market — expect competitive offers; lowballing is unlikely to land.
- Current owner paid $380k; list at $640k implies a 68% gain — meaningful room to come down on a strong offer.
Questions for the listing agent
- What do current leases actually rent for vs. the listed asking? Can we see a recent rent roll and the last 12 months of T-12 income?
- Is there a deadline driving the sale (1031 exchange, divorce, estate, relocation)? That informs how much negotiation room exists.
- The area grade is low — what's the realistic commute time and amenity access for the typical tenant pool here? Any planned neighborhood developments (good or bad) we should know about?
- What's the average days-on-market for RENTAL listings here right now (not sales)? A rising rental-DOM trend means longer vacancies and softer asking-rent achievability than the comps imply.
- What's the recent tenant-quality profile in this submarket — average credit score on applications, eviction rate, late-payment / NSF rate, and stable-employment percentage? A property-management company in the area should have these aggregated.
- How much new for-sale + rental construction is in the pipeline within 1–3 miles? Heavy new supply typically softens prices + rents 12–24 months out; constrained supply supports both.
Investment metrics
- 1% rule
- 0.94% ✗
- Cap rate
- 6.17%
- Cash-on-cash
- -0.43%
- DSCR
- 0.98
- GRM
- 8.9
CMA / ARV
- ARV (on-the-fly)
- $641,946
- Comps found
- 12
Show comp detail 12 sales within ~0.75 mi
| Address | Dist | Beds/Ba | Sqft | Sold | Price | $/sf | Match |
|---|---|---|---|---|---|---|---|
| 11725 Cooper Way | 0.16mi | 5/3.5 (+1) | 3,200 (-3%) | 6mo | $635,000 | $198 | 75 |
| 14170 Green Valley Dr | 0.40mi | 5/3.0 (+1) | 3,420 (+3%) | 3mo | $615,000 | $180 | 69 |
| 14212 Burnley Dr | 0.39mi | 4/2.5 | 3,386 (+2%) | 15mo | $629,000 | $186 | 64 |
| 13721 S Santa FE Trl | 0.30mi | 3/3.5 (-1) | 3,304 (-0%) | 18mo | $425,000 | $129 | 64 |
| 13812 Mccabe Dr | 0.15mi | 3/2.5 (-1) | 3,000 (-9%) | 8mo | $607,000 | $202 | 63 |
| 11452 Greystone Dr | 0.38mi | 4/3.5 | 3,500 (+6%) | 12mo | $880,000 | $251 | 60 |
| 11731 Blackburn Dr | 0.45mi | 4/2.5 | 3,100 (-6%) | 12mo | $600,000 | $194 | 56 |
| 12033 Wooly Hill Ct | 0.54mi | 4/3.0 | 3,303 (-0%) | 24mo | $411,000 | $124 | 55 |
| 13948 Citation Dr | 0.45mi | 5/3.0 (+1) | 3,000 (-9%) | 9mo | $565,900 | $189 | 51 |
| 11454 Boulder Dr | 0.42mi | 5/4.5 (+1) | 3,634 (+10%) | 13mo | $940,000 | $259 | 42 |
| 14341 Creek Crossing Dr | 0.59mi | 5/2.5 (+1) | 2,894 (-12%) | 12mo | $557,000 | $192 | 34 |
| 11153 Woodstock Dr | 0.71mi | 4/3.5 | 3,000 (-9%) | 22mo | $640,000 | $213 | 31 |
Match score weights: distance 35% · size 25% · config 20% · recency 20%. Top-matched comps best support the ARV.
Projected returns pro-forma
-3.0% appreciation · 3.0% rent growth · sell at horizon
- IRR
- -16.9%
- Equity multiple
- 0.40×
- Total profit
- $-107,474
- Equity at exit
- $95,411
- IRR
- -8.7%
- Equity multiple
- 0.46×
- Total profit
- $-97,554
- Equity at exit
- $55,327
Cash invested: $179,172 (down + closing). Projections, not guarantees.
Landlord ↔ Tenant lean methodology
- Overall (STATE)
- 43 Moderately Tenant-Leaning
- State Illinois
- 43 Moderately Tenant-Leaning · D+7
- County
- — inherits STATE
- City
- — inherits STATE
ZIP-level market 60467
- Home prices YoY
- -30.4%
- Active inventory
- 118
- Price-to-rent
- 8.9×
Monthly cashflow live
- Estimated rent
- $6,000 medium interval (Pro) →
- Mortgage (P&I)
- −$3,356
- Tax from tax record
- −$1,182 /mo · $14,186/yr
- Insurance
- −$267
- HOA
- −$0
- Vacancy / Maint / Mgmt
- −$1,260
- Net cashflow
- $-65
Break-even live
Sensitivity live
| Price | -10% $298 | -5% $117 | +0% $-65 | +5% $-246 | +10% $-427 |
|---|---|---|---|---|---|
| Rent | -10% $-539 | -5% $-302 | +0% $-65 | +5% $172 | +10% $409 |
| Rate | -1.0pp $258 | -0.5pp $98 | base $-65 | +0.5pp $-230 | +1.0pp $-399 |
UW: 25.0% down · 7.5% · 30yr · 1.5% tax · 5.0% vac · 8.0% maint · 8.0% mgmt
Financing live
Cash to close
- Down payment
- $159,975
- Closing costs
- $19,197
- Reserves months
- —
- Total cash needed
- —
Loan-product check · same deal, 3 products live
Conventional
25% down · 7.5% · 30yr
- Down + closing
- —
- Monthly P&I
- —
- Monthly cashflow
- —
- DSCR
- —
- Eligible?
- —
Personal DTI + credit; lowest rate.
DSCR
20% down · 8.5% · 30yr
- Down + closing
- —
- Monthly P&I
- —
- Monthly cashflow
- —
- DSCR
- —
- Eligible?
- —
No personal income docs; deal must DSCR.
Hard money
10% down · 12.0% · 12mo
- Down + closing
- —
- Monthly P&I
- —
- Monthly cashflow
- —
- DSCR
- —
- Eligible?
- —
Short-term bridge; refi at stabilization.
Rent comps 1 comps
| Address | Beds | Baths | Sqft | Rent | $/sqft | DOM | Units | Dist |
|---|---|---|---|---|---|---|---|---|
| 14031 Preston Dr Orland Park, IL | 4.0 | 3.5 | 3319 | $6,000 | $1.81 | 9d | 1 | 0.18mi |
Listing history 4 events
-
2026-06-22days on market $639,900 Active 5 DOM
-
2026-06-21days on market $639,900 Active 4 DOM
-
2026-06-17remarks 699-char remark
-
2026-06-17$639,900 Active 1 DOM
ⓘ Source: listings_history table (triggers on properties + properties_extension) + one-shot
backfill from property_details.listing_events for pre-trigger history.
Tax reassessment forecast IL · Partial reset (capped growth)
- Current annual tax
- $14,186 · $1,182/mo
- Projected year-2 tax
- $14,356 · $1,196/mo
- Expected delta
- +$170/yr (+$14/mo · 1.2%)
ⓘ Screening estimate from a state-policy table — verify with the county assessor before closing.
Climate risk First Street
- Flood 1/10 Low FEMA zone X (unshaded) · 0% chance over 30 yrs
- Wildfire 3/10 Moderate
- Heat 3/10 Moderate 7 d/yr ≥102°F today · 15 d/yr by 30 yrs out
- Wind 2/10 Low
- Air quality 2/10 Low 1 unhealthy d/yr today · 1 by 30 yrs out
Nearby sold comps map
Loading sold comps map…
Walkable amenities ~0.75 mi
Loading nearby amenities…
Taxation est. · year 1
- Rental income
- $72,000
- − Mortgage interest
- −$35,844
- − Property taxes
- −$14,186
- − Insurance
- −$3,200
- − Repairs & maintenance
- −$5,760
- − Management
- −$5,760
- − Depreciation
- −$18,615
- Taxable loss
- −$11,365
- Est. tax savings @ 24.0%
- +$2,728
- After-tax cash flow
- $1,954/yr
For passive investors: Depreciation is non-cash, so a rental often shows a tax loss while cash-flowing — sheltering income. Rental losses are passive: they offset passive income freely, and up to $25,000/yr can offset ordinary (W-2) income if you actively participate and your MAGI is under $100k (phasing out to $0 by $150k); unused losses carry forward. On sale, claimed depreciation is recaptured at up to 25%, and gains may owe capital-gains tax (a 1031 exchange can defer both). Figures are a year-1 estimate at your 24.0% rate — not tax advice; consult a CPA.
Schools (NCES district)
- District
- Cons Hsd 230
- NCES district ID
- 1708400
- Math proficiency
- 35% ▼ -8.00%
- Reading proficiency
- 39% ▼ -6.00%
- Median HH income
- $73,953
- Composite
- 34.29/100
- National rank
- #5244
- State rank
- #146 of 620 in IL
Livability — Orland Park
- Score
- 85/100
- State rank
- #29
- US rank
- #529
Category grades
Schools grade is shown separately in the Schools card above.
Census & demographics
- Census place
- Orland Park, IL
- City population
- 41,456
- Population (ZIP)
- 24,952
Population outlook (Cook County) Hauer SSP2
- Today (2025)
- 5,347,519 people
- By 2030
- 5,357,703 · +0.2%
- By 2040
- 5,324,924 · -0.4%
- By 2050
- 5,230,762 · -2.2%
- By 2075
- 4,785,735 · -10.5%
- By 2100
- 4,188,836 · -21.7%
Race, ethnicity, and origin ACS 2023
- Neighborhood character
- Predominantly White (83%)
- Race & ethnicity
- White 83% Hispanic / Latino 6% Asian 5% Two or more races 4% Black 4%
- Hispanic origin (detail)
- Mexican 5%
- Common ancestry
- Romanian 15% Armenian 2% Iranian 2%
- Foreign-born
- 14% · Canada, South Korea, China
- Languages at home
- 78% English-only · Arabic 9% Russian/Polish/Slavic 4% Other Indo-European 4%
Political lean MEDSL · Cook
- 2024 margin
- Solid D (+42.0) · D 70.4% · R 28.4% · Other 1.2%
- 2008→2024 swing
- -11.4pp toward R · 2008: 53.4pp · 2024: 42.0pp
- All cycles
- 2024: D+42.0 2020: D+50.3 2016: D+53.0 2012: D+49.4 2008: D+53.4
Not yet ingested
- Civics
- —
Market trends
- HPI YoY
- ▼ -82.13%
- Current HPI
- 188.3676
- Rent YoY
- —
- Metro
- —
- State GDP YoY
- ▲ 1.59%
- F500 in state
- 60
Industry mix (Fortune 500 HQ in IL)
| Industry | F500 HQs | Revenue |
|---|---|---|
| Insurance | 4 | $201B |
|
||
| Consumer Goods | 4 | $87B |
|
||
| Industrial Machinery | 3 | $64B |
|
||
| Healthcare | 2 | $55B |
|
||
| Retail / Pharmacy | 1 | $148B |
|
||
| Agriculture / Food | 1 | $86B |
|
||
Price history
+68.4% since first listed2 events — show timeline
- 2026-06-17 Listed $639,900 MRED as Distributed by MLS Grid
- 2004-10-13 Sold (Public Records) $380,000 Public Records
Property tax history
+4.6%/yrLatest (2023): $14,186 · +20.5% YoY. Source: county tax records.
Cash-flow waterfall
monthlySold comps — $/sqft
last 12 mo · ≤1 miLoading sold comps…