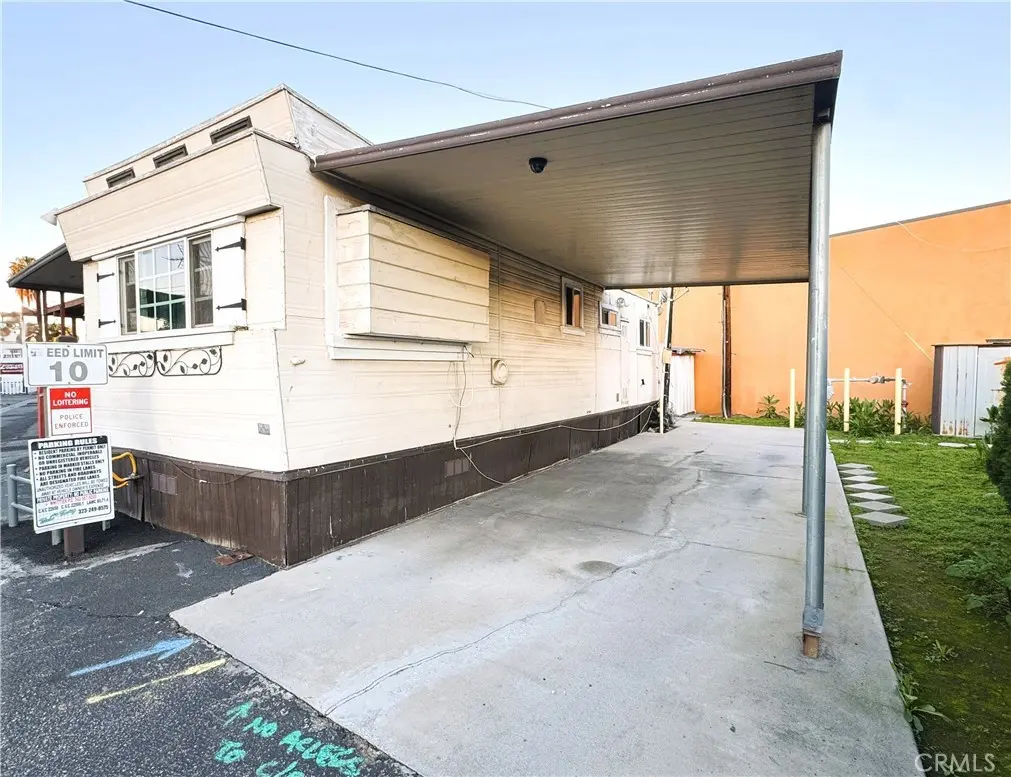
11825 Washington Blvd · West Whittier-Los Nietos, CA
Flood risk 1/10 · Minimal
- FEMA flood zone
- X (unshaded)
- Chance of flooding over 30 yrs
- 0.0%
- Est. flood insurance / yr
- $507 – $1,088
Fire risk 1/10 · Minimal
- Est. fire insurance / yr
- $659 – $1,223
Heat risk 6/10 · Moderate
- Hot days now (above 95°F)
- 7 days/yr
- Hot days in 30 yrs
- 21 days/yr
Wind risk 1/10 · Minimal
- Chance of severe wind over 30 yrs
- —
Air-quality risk 6/10 · Moderate
- Unhealthy air days now
- 9 days/yr
- Unhealthy air days in 30 yrs
- 10 days/yr
Risk factors via First Street. Map © Google.
Why this score? — see what drove the B- grade
The composite is a weighted blend of 9 inputs, each scored 0–100. Each bar is that input's sub-score; the figure is the points it added to the 100-point composite (weight × sub-score).
- Cash flow +30.0/30.0
- 1% rule +10.0/10.0
- DSCR +10.0/10.0
- ARV discount +7.5/15.0
- Schools +4.7/10.0
- Rent growth +2.5/5.0
- Livability +2.5/5.0
- Condition / age +2.5/5.0
- Appreciation +0.0/10.0
$59,990
🖨 Deal sheet (PDF) 📄 Offer letter ✓ Due diligence
Listing remarks MLS
Well maintained home in a quiet all age park. Nice location in the center of Whittier. Close to schools, shops, freeways and public transportation. Home entrance is located along Sorensen Ave, Space 6. It has a spacious living room, kitchen and dining area with ample cabinet space, storage shed and adjacent 2 car covered carport.
Key facts
- Prime location
- Conveniently located
- 2 garage spots
Tags
Property features AI
Finance
- Other: Manager approval required for park; Elevation units listed in feet; Lot described as 0-1 Unit/Acre
- HOA & community: Land lease community (Hacienda MH); Land lease amount: $885
Exterior
- Parking: Carport; 2 total parking spaces (including 2 garage spaces)
- Utilities: Public sewer; District/Public water
- Home design: Single-story mobile home; Mobile home remains on site; 40' x 10' mobile dimensions
- Construction: Year built reported by seller; Living area reported by seller
- Exterior features: No pool; Sidewalks (community)
Interior
- Kitchen: Gas & Electric Range
- Flooring: Vinyl flooring
- Bathrooms: 1 full bathroom
- Heating & cooling: Wall/window cooling
- Interior features: Corian counters; Entry on main level
- Laundry & utility: Community laundry
Neighborhood map
What this means for you Summary
Snapshot
- This is a 1-bed/1.0-bath land listed at $60k.
Deal economics
- At list price, monthly cash flow is $1k ($14k/yr) — positive.
- The deal already cash-flows at list — no discount required.
- Meets the 1% rule at list price ($2k rent vs $60k).
- Recommended offer: $59k (1.5% below list) — sets the bar for market timing.
- Cap rate 30.4% vs local median 2.9% in West Whittier-Los Nietos — top-decile yield for the area; either an underpriced asset or a hidden risk that comps aren't pricing in. Stress-test before assuming the spread holds.
Location & tenants
- Location reads: area grade B — affects rentability + tenant quality, not the cash-flow math above.
- Whittier Union High (suburban): math 42% / reading 65% proficiency, ranked #111 of 517 in CA (top 22%) — acceptable for families but not a draw, mixed tenant base, ~2y average lease.
- Zoned schools: Daniel Phelan Elementary (534 students, 50% FRL); Katherine Edwards Middle (916 students, 73% FRL); Santa Fe High (math 44% / reading 66%, grade C, #249 of 1,170 statewide, top 22%, 1,935 students, 79% FRL) — zoned schools average 67% FRL vs 26% district-wide (42 pts higher); higher-poverty schools than district average — tighter screening recommended.
- Market conditions: 34 active listings in the ZIP; solid renter incomes; 19,697 units permitted in Los Angeles County in 2024 (9,426 in 5+ unit buildings).
Forward outlook
- Local home prices are declining (-3.0%/yr); year-one equity from $414 of loan paydown is wiped out by about $2k of value loss. Plan a longer hold.
- Los Angeles County population projected at +9% by 2050 — modest demand growth; plan on rents tracking national, not racing it.
- At projected returns (-3.0% appreciation + 3.0% rent growth), your $17k cash investment doubles in ~2 years — after that, you're playing with house money.
Negotiation context
- It's been on market 20 days — a 2% lower offer ($59k) is reasonable based on typical stale-listing flexibility.
- 3 sale attempts since 3y ago with the ask held roughly flat each time — persistent listings suggest the price (not the market) is what's stuck; bring a comps-based counter.
Risks & watch-outs
- Watch-outs: built in 1958 — expect roof / HVAC / electrical / plumbing capex.
- Climate carrying-cost: extreme-heat days projected 7→21/yr by 2055 (HVAC capex compounding) — expect insurance premiums to compound above CPI over the hold.
Questions for the listing agent
- Built in 1958 — when were the roof, HVAC, electrical panel, plumbing, and water heater last replaced?
- Is there a deadline driving the sale (1031 exchange, divorce, estate, relocation)? That informs how much negotiation room exists.
- What's the average days-on-market for RENTAL listings here right now (not sales)? A rising rental-DOM trend means longer vacancies and softer asking-rent achievability than the comps imply.
- What's the recent tenant-quality profile in this submarket — average credit score on applications, eviction rate, late-payment / NSF rate, and stable-employment percentage? A property-management company in the area should have these aggregated.
- How much new for-sale + rental construction is in the pipeline within 1–3 miles? Heavy new supply typically softens prices + rents 12–24 months out; constrained supply supports both.
Investment metrics
- 1% rule
- 3.42% ✓
- Cap rate
- 30.43%
- Cash-on-cash
- 86.21%
- DSCR
- 4.84
- GRM
- 2.4
CMA / ARV
No comps found within radius.
Projected returns pro-forma
-3.0% appreciation · 3.0% rent growth · sell at horizon
- IRR
- 86.7%
- Equity multiple
- 5.00×
- Total profit
- $67,165
- Equity at exit
- $8,945
- IRR
- 89.8%
- Equity multiple
- 10.38×
- Total profit
- $157,576
- Equity at exit
- $5,187
Cash invested: $16,797 (down + closing). Projections, not guarantees.
Landlord ↔ Tenant lean methodology
- Overall (STATE)
- 18 Strongly Tenant-Friendly
- State California
- 18 Strongly Tenant-Friendly · D+13
- County
- — inherits STATE
- City
- — inherits STATE
ZIP-level market 90606
- Active inventory
- 34
- Price-to-rent
- 2.4×
Monthly cashflow live
- Estimated rent
- $2,052 medium interval (Pro) →
- Mortgage (P&I)
- −$315
- Tax est. 1.5%
- −$75 /mo · $900/yr
- Insurance
- −$25
- HOA
- −$0
- Lot rent
- −$0
- Vacancy / Maint / Mgmt
- −$431
- Net cashflow
- $1,207
Break-even live
Sensitivity live
| Price | -10% $1,248 | -5% $1,227 | +0% $1,207 | +5% $1,186 | +10% $1,165 |
|---|---|---|---|---|---|
| Rent | -10% $1,045 | -5% $1,126 | +0% $1,207 | +5% $1,288 | +10% $1,369 |
| Rate | -1.0pp $1,237 | -0.5pp $1,222 | base $1,207 | +0.5pp $1,191 | +1.0pp $1,175 |
UW: 25.0% down · 7.5% · 30yr · 1.5% tax · 5.0% vac · 8.0% maint · 8.0% mgmt
Financing live
Cash to close
- Down payment
- $14,998
- Closing costs
- $1,800
- Reserves months
- —
- Total cash needed
- —
Loan-product check · same deal, 3 products live
Conventional
25% down · 7.5% · 30yr
- Down + closing
- —
- Monthly P&I
- —
- Monthly cashflow
- —
- DSCR
- —
- Eligible?
- —
Personal DTI + credit; lowest rate.
DSCR
20% down · 8.5% · 30yr
- Down + closing
- —
- Monthly P&I
- —
- Monthly cashflow
- —
- DSCR
- —
- Eligible?
- —
No personal income docs; deal must DSCR.
Hard money
10% down · 12.0% · 12mo
- Down + closing
- —
- Monthly P&I
- —
- Monthly cashflow
- —
- DSCR
- —
- Eligible?
- —
Short-term bridge; refi at stabilization.
Listing history 14 events
-
2026-06-03days on market $59,990 Active 20 DOM
-
2026-06-02days on market $59,990 Active 19 DOM
-
2026-06-01days on market $59,990 Active 18 DOM
-
2026-05-31days on market $59,990 Active 17 DOM
-
2026-05-14$59,990 Active
-
2025-12-01historical
-
2025-09-29$85,000 Active
-
2024-03-14soldstatus $86,000 Closed Sale 331-char remark
Show marketing remark (331 chars)
Well maintained home in a quiet all age park. Nice location in the center of Whittier. Close to schools, shops, freeways and public transportation. Home entrance is located along Sorensen Ave, Space 6. It has a spacious living room, kitchen and dining area with ample cabinet space, storage shed and adjacent 2 car covered carport.
-
2024-01-28historical Active Under Contract 331-char remark
Show marketing remark (331 chars)
Well maintained home in a quiet all age park. Nice location in the center of Whittier. Close to schools, shops, freeways and public transportation. Home entrance is located along Sorensen Ave, Space 6. It has a spacious living room, kitchen and dining area with ample cabinet space, storage shed and adjacent 2 car covered carport.
-
2023-11-18$89,999 Active 331-char remark
Show marketing remark (331 chars)
Well maintained home in a quiet all age park. Nice location in the center of Whittier. Close to schools, shops, freeways and public transportation. Home entrance is located along Sorensen Ave, Space 6. It has a spacious living room, kitchen and dining area with ample cabinet space, storage shed and adjacent 2 car covered carport.
-
2023-11-16price $89,999 331-char remark
Show marketing remark (331 chars)
Well maintained home in a quiet all age park. Nice location in the center of Whittier. Close to schools, shops, freeways and public transportation. Home entrance is located along Sorensen Ave, Space 6. It has a spacious living room, kitchen and dining area with ample cabinet space, storage shed and adjacent 2 car covered carport.
-
2023-11-10historical $99,000 331-char remark
Show marketing remark (331 chars)
Well maintained home in a quiet all age park. Nice location in the center of Whittier. Close to schools, shops, freeways and public transportation. Home entrance is located along Sorensen Ave, Space 6. It has a spacious living room, kitchen and dining area with ample cabinet space, storage shed and adjacent 2 car covered carport.
-
2010-12-30soldstatus $995,000
-
2008-02-13soldstatus $2,725,000
ⓘ Source: listings_history table (triggers on properties + properties_extension) + one-shot
backfill from property_details.listing_events for pre-trigger history.
Climate risk First Street
- Flood 1/10 Low FEMA zone X (unshaded) · 0% chance over 30 yrs
- Wildfire 1/10 Low
- Heat 6/10 Major 7 d/yr ≥95°F today · 21 d/yr by 30 yrs out
- Wind 1/10 Low
- Air quality 6/10 Major 9 unhealthy d/yr today · 10 by 30 yrs out
Nearby sold comps map
Loading sold comps map…
Walkable amenities ~0.75 mi
Loading nearby amenities…
Taxation est. · year 1
- Rental income
- $24,627
- − Mortgage interest
- −$3,360
- − Property taxes
- −$900
- − Insurance
- −$300
- − Repairs & maintenance
- −$1,970
- − Management
- −$1,970
- − Depreciation
- −$1,745
- Taxable income
- $14,381
- Est. tax owed @ 24.0%
- −$3,452
- After-tax cash flow
- $11,029/yr
For passive investors: Depreciation is non-cash, so a rental often shows a tax loss while cash-flowing — sheltering income. Rental losses are passive: they offset passive income freely, and up to $25,000/yr can offset ordinary (W-2) income if you actively participate and your MAGI is under $100k (phasing out to $0 by $150k); unused losses carry forward. On sale, claimed depreciation is recaptured at up to 25%, and gains may owe capital-gains tax (a 1031 exchange can defer both). Figures are a year-1 estimate at your 24.0% rate — not tax advice; consult a CPA.
Schools (NCES district)
- District
- Whittier Union High
- NCES district ID
- 0642480
- Math proficiency
- 42% ▲ 9.00%
- Reading proficiency
- 65% ▲ 7.00%
- Median HH income
- $66,675
- Composite
- 47.19/100
- National rank
- #2321
- State rank
- #111 of 517 in CA
Livability — West Whittier-Los Nietos
No livability data for this city. (Only ~50 U.S. cities are tracked.)
Census & demographics
- Census place
- West Whittier-Los Nietos, CA
- County
- Los Angeles County · 9,444,647 people
- City population
- 31,881
- Metro
- Los Angeles-Long Beach-Anaheim, CA
- Population (ZIP)
- 32,057
- Household income
- $100,428
- Rent vs Own
- Severe rent burden
- 556.0
Population outlook (Los Angeles County) Hauer SSP2
- Today (2025)
- 10,940,515 people
- By 2030
- 11,256,481 · +2.9%
- By 2040
- 11,729,929 · +7.2%
- By 2050
- 11,948,407 · +9.2%
- By 2075
- 11,818,114 · +8.0%
- By 2100
- 10,842,928 · -0.9%
Race, ethnicity, and origin ACS 2023
- Neighborhood character
- Predominantly Hispanic (85%)
- Race & ethnicity
- Hispanic / Latino 85% Two or more races 17% White 8% Asian 5% Native American 2% Black 1%
- Hispanic origin (detail)
- Mexican 76%
- Foreign-born
- 24% · Canada, South Korea, Vietnam
- Languages at home
- 41% English-only · Spanish 55% Tagalog/Filipino 2% Korean 1%
Political lean MEDSL · Los Angeles
- 2024 margin
- Solid D (+32.9) · D 64.8% · R 31.9% · Other 3.3%
- 2008→2024 swing
- -7.4pp toward R · 2008: 40.4pp · 2024: 32.9pp
- All cycles
- 2024: D+32.9 2020: D+44.2 2016: D+48.0 2012: D+40.0 2008: D+40.4
Not yet ingested
- Civics
- —
Market trends
- HPI YoY
- ▼ -973.24%
- Current HPI
- 428.5874
- Rent YoY
- —
- Metro
- Los Angeles-Long Beach-Anaheim, CA
- State GDP YoY
- ▲ 3.21%
- F500 in state
- 116
Industry mix (Fortune 500 HQ in CA)
| Industry | F500 HQs | Revenue |
|---|---|---|
| Technology | 27 | $1,492B |
|
||
| Financial Services | 3 | $174B |
|
||
| Retail | 3 | $44B |
|
||
| Insurance | 3 | $26B |
|
||
| Media / Entertainment | 2 | $115B |
|
||
| Pharmaceuticals / Biotech | 2 | $62B |
|
||
Price history
-97.8% since first listed10 events — show timeline
- 2026-05-14 Listed $59,990 CRMLS
- 2025-12-01 Listing Removed — CRMLS
- 2025-09-29 Listed $85,000 CRMLS
- 2024-03-14 Sold (MLS) $86,000 CRMLS
- 2024-01-28 Contingent — CRMLS
- 2023-11-18 Listed $89,999 CRMLS
- 2023-11-16 Price Changed $89,999 CRMLS
- 2023-11-10 Coming Soon $99,000 CRMLS
- 2010-12-30 Sold (Public Records) $995,000 Public Records
- 2008-02-13 Sold (Public Records) $2,725,000 Public Records
Property tax history
+3.4%/yrLatest (2025): $43,595 · +12.3% YoY. Source: county tax records.
Cash-flow waterfall
monthlySold comps — $/sqft
last 12 mo · ≤1 miLoading sold comps…