 Multi-family
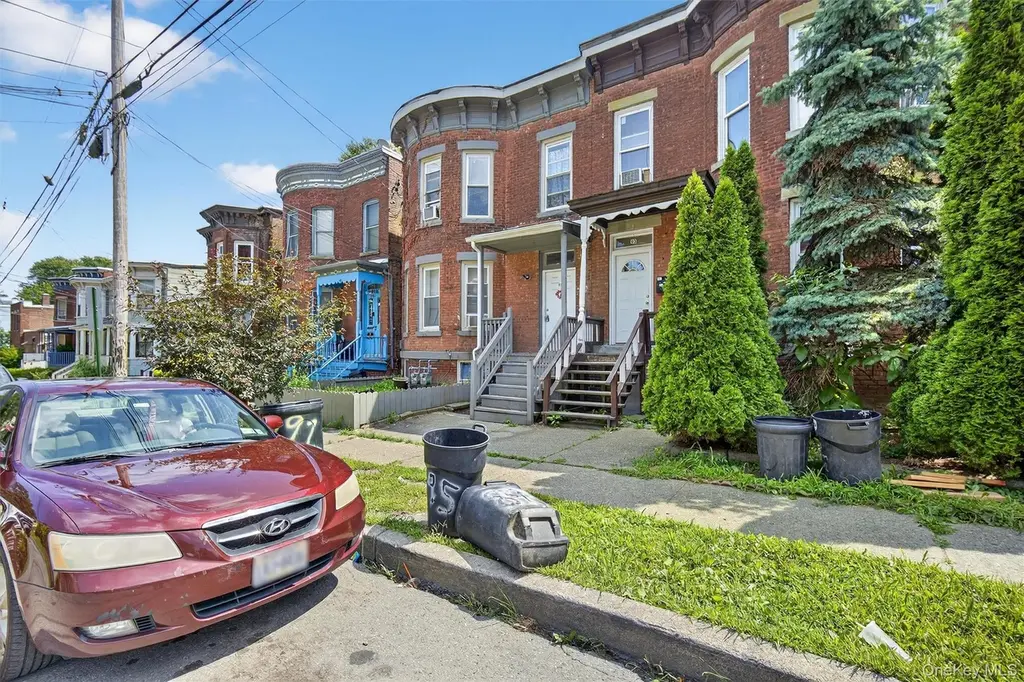
91 Carson Ave · Newburgh, NY
Flood risk 1/10 · Minimal
- FEMA flood zone
- X (unshaded)
- Chance of flooding over 30 yrs
- 0.0%
- Est. flood insurance / yr
- $473 – $860
Fire risk 2/10 · Minimal
- Est. fire insurance / yr
- $691 – $1,283
Heat risk 5/10 · Moderate
- Hot days now (above 100°F)
- 7 days/yr
- Hot days in 30 yrs
- 16 days/yr
Wind risk 4/10 · Minor
- Chance of severe wind over 30 yrs
- 13.0%
Air-quality risk 3/10 · Minor
- Unhealthy air days now
- 2 days/yr
- Unhealthy air days in 30 yrs
- 3 days/yr
Risk factors via First Street. Map © Google.
Why this score? — see what drove the C grade
The composite is a weighted blend of 9 inputs, each scored 0–100. Each bar is that input's sub-score; the figure is the points it added to the 100-point composite (weight × sub-score).
- Cash flow +17.1/30.0
- ARV discount +15.0/15.0
- 1% rule +5.8/10.0
- DSCR +5.3/10.0
- Schools +3.5/10.0
- Livability +3.1/5.0
- Rent growth +2.7/5.0
- Condition / age +2.5/5.0
- Appreciation +0.0/10.0
$365,000
🖨 Deal sheet (PDF) 📄 Offer letter ✓ Due diligence
Multi-family units
County records classify this as Multi-Family (2-4 Unit). Listing-text estimate: 1 unit. estimate disagrees with records
Listing remarks MLS
Here’s your chance to own a classic brick multi-family in Newburgh’s desirable East End Historic District. This fully occupied property features two large 2-bedroom, 1-bath units, each has over 1000 sqft of space. Both apartments offer eat-in kitchens, hardwood-style flooring, and bright bay windows that bring in great natural light. The building includes separate utilities. Two 2-bed / 1-bath units Fully rented with stable tenants Classic brick façade with bay windows Large kitchens with plenty of cabinet space Separate gas and electric meters Full basement with interior and exterior access Prime Location: Minutes to Newburgh Waterfront, ferry to Beacon, I-84 & I-87 Close to local shops, restaurants, and public transit Located on a block lined with historic rowhomes and strong rental demand Whether you’re building your portfolio or looking for a smart owner-occupant play, 91 Carson offers reliable income, architectural character, and long-term upside in a rapidly appreciating market.
Key facts
- Separate utilities
- Eat-in kitchens
- Bright bay windows
Tags
Neighborhood map
What this means for you Summary
Snapshot
- This is a 4-bed/2.0-bath multifamily listed at $365k.
Deal economics
- At list price, monthly cash flow is $252 ($3k/yr) — positive.
- The deal already cash-flows at list — no discount required.
- Meets the 1% rule at list price ($4k rent vs $365k).
- Recommended offer: $321k (12.0% below list) — sets the bar for market timing.
- Cap rate 7.1% vs local median 4.4% in Newburgh — top-decile yield for the area; either an underpriced asset or a hidden risk that comps aren't pricing in. Stress-test before assuming the spread holds.
Location & tenants
- Location reads 62/100 on livability (#878 in NY) — a middle-class / working-renter tenant base. Strengths: health & safety A+, housing B+, cost of living B; Watch: employment D+, crime F, amenities F.
- Newburgh City School District (suburban): math 33% / reading 48% proficiency, ranked #500 of 590 in NY (top 85%) — families likely to look elsewhere, expect single-tenant / working-renter base with shorter leases; 61% free/reduced lunch — lower-income household profile, screen leases tightly.
- Zoned schools: Newburgh Free Academy (math 76% / reading 85%, grade A, #506 of 1,100 statewide, top 46%, 3,433 students, 56% FRL).
- Zoned-school proficiency averages 80% at this address vs 40% district-wide (+40 pts) — the actual schools serving this property are materially stronger than the Newburgh City School District average implies; a family-tenant draw the district grade alone would hide.
- Market conditions: Rents flat; 387 active listings in the ZIP; 4 comparable units currently listed for rent nearby; rentals lingering (median 46d on market — plan ~5-8 weeks vacancy on turnover, expect pricing pressure); 75% of comp listings sitting > 30 days — soft ceiling on asking rent; solid renter incomes; 1,746 units permitted in Orange County in 2024 (1,265 in 5+ unit buildings).
- At $3,950/mo this rent would consume 55% of the median local household income ($86k/yr) (locally 2412% of renters already pay >50% of income on rent) — very limited rent-growth headroom before tenants either downsize or default.
Forward outlook
- Local home prices are declining (-3.0%/yr); year-one equity from $3k of loan paydown is wiped out by about $11k of value loss. Plan a longer hold.
Negotiation context
- It's been on market 325 days — a 12% lower offer ($321k) is reasonable based on typical stale-listing flexibility.
- 8 sale attempts since 24y ago; this cycle's ask has dropped $60k (14%) from the opening price — seller is motivated, your offer sets the floor, not the list.
Risks & watch-outs
- Watch-outs: property tax is 2.6% of price; built in 1890 — expect roof / HVAC / electrical / plumbing capex.
- Climate carrying-cost: extreme-heat days projected 7→16/yr by 2055 (HVAC capex compounding) — expect insurance premiums to compound above CPI over the hold.
Questions for the listing agent
- It's been on market 325 days. Have you received any prior offers? Is the seller open to a 12% concession, seller financing, or rate buy-down credit?
- Built in 1890 — when were the roof, HVAC, electrical panel, plumbing, and water heater last replaced?
- Property tax is high relative to price — has the assessment been appealed recently, and will the sale trigger a re-assessment?
- Why hasn't it sold? Are there any deal-killer items the seller is aware of (foundation, flood, title, zoning, code violations)?
- Is there a deadline driving the sale (1031 exchange, divorce, estate, relocation)? That informs how much negotiation room exists.
- Schools are D-rated, which usually means shorter tenancies and higher turnover. Who's the typical renter profile here, and what's been the actual vacancy rate?
- Crime grade is F in this area — have there been break-ins, vandalism, or insurance claims at this property in the last 3 years? What carrier currently insures it and at what premium?
- What's the average days-on-market for RENTAL listings here right now (not sales)? A rising rental-DOM trend means longer vacancies and softer asking-rent achievability than the comps imply.
- What's the recent tenant-quality profile in this submarket — average credit score on applications, eviction rate, late-payment / NSF rate, and stable-employment percentage? A property-management company in the area should have these aggregated.
- How much new apartment / multifamily construction is in the pipeline within 1–3 miles? Heavy new supply (>2% of stock underway) typically softens rents 12–24 months out; light construction supports rent growth.
Investment metrics
- 1% rule
- 1.08% ✓
- Cap rate
- 7.12%
- Cash-on-cash
- 2.96%
- DSCR
- 1.13
- GRM
- 7.7
CMA / ARV
- ARV (median comp)
- $564,673
- List price
- $365,000
- Delta
- -35.36%
- Verdict
- UNDERPRICED
- Comps
- 20 within 1.0 mi
Show comp detail 12 sales within ~0.75 mi
| Address | Dist | Beds/Ba | Sqft | Sold | Price | $/sf | Match |
|---|---|---|---|---|---|---|---|
| 77 Courtney Ave #2 | 0.11mi | 4/2.0 | 2,178 (+0%) | 13mo | $246,000 | $113 | 84 |
| 57 Henry Ave | 0.17mi | 4/2.0 | 2,128 (-2%) | 11mo | $260,000 | $122 | 80 |
| 186 S William St | 0.22mi | 5/3.0 (+1) | 2,160 (-1%) | 8mo | $408,000 | $189 | 73 |
| 30 Overlook Pl | 0.16mi | 4/2.0 | 1,940 (-11%) | 10mo | $390,000 | $201 | 66 |
| 2 Carson Ave | 0.18mi | 5/3.0 (+1) | 2,396 (+10%) | 9mo | $375,000 | $157 | 58 |
| 138 Benkard Ave | 0.27mi | 5/2.0 (+1) | 2,004 (-8%) | 15mo | $200,000 | $100 | 57 |
| 23 City Ter Unit A | 0.54mi | 5/2.0 (+1) | 1,952 (-10%) | 4mo | $280,000 | $143 | 50 |
| 95 Liberty St | 0.34mi | 4/4.0 | 2,400 (+10%) | 14mo | $545,000 | $227 | 48 |
| 34 Lutheran St | 0.57mi | 3/1.0 (-1) | 2,272 (+5%) | 13mo | $160,000 | $70 | 46 |
| 11 Courtney Ave | 0.23mi | 5/3.0 (+1) | 2,425 (+12%) | 18mo | $350,000 | $144 | 46 |
| 219A First St | 0.61mi | 5/2.0 (+1) | 1,938 (-11%) | 18mo | $270,000 | $139 | 34 |
| 181 First St | 0.59mi | 5/2.0 (+1) | 2,450 (+13%) | 15mo | $335,000 | $137 | 34 |
Match score weights: distance 35% · size 25% · config 20% · recency 20%. Top-matched comps best support the ARV.
Projected returns pro-forma
-3.0% appreciation · 0.63% rent growth · sell at horizon
- IRR
- -14.6%
- Equity multiple
- 0.49×
- Total profit
- $-52,023
- Equity at exit
- $54,423
- IRR
- -10.9%
- Equity multiple
- 0.42×
- Total profit
- $-59,531
- Equity at exit
- $31,559
Cash invested: $102,200 (down + closing). Projections, not guarantees.
Landlord ↔ Tenant lean methodology
- Overall (STATE)
- 15 Strongly Tenant-Friendly
- State New York
- 15 Strongly Tenant-Friendly · D+10
- County
- — inherits STATE
- City
- — inherits STATE
ZIP-level market 12550
- Home prices YoY
- -33.3%
- Rents YoY
- 0.6%
- Active inventory
- 387
- Price-to-rent
- 15.4×
Monthly cashflow live
- Estimated rent
- $3,950 high interval (Pro) →
- Mortgage (P&I)
- −$1,914
- Tax from tax record
- −$802 /mo · $9,627/yr
- Insurance
- −$152
- HOA
- −$0
- Lot rent
- −$0
- Vacancy / Maint / Mgmt
- −$830
- Net cashflow
- $252
Break-even live
Sensitivity live
| Price | -10% $459 | -5% $355 | +0% $252 | +5% $149 | +10% $45 |
|---|---|---|---|---|---|
| Rent | -10% $-60 | -5% $96 | +0% $252 | +5% $408 | +10% $564 |
| Rate | -1.0pp $436 | -0.5pp $345 | base $252 | +0.5pp $157 | +1.0pp $61 |
2-unit breakdown (identical units grouped — click to expand)
| Units | Beds | Baths | Est. rent |
|---|---|---|---|
| 2× units | 2 | 1 | $3,950 |
| #1 | 2 | 1 | $1,975 |
| #2 | 2 | 1 | $1,975 |
| Total (2 units) | $3,950 | ||
UW: 25.0% down · 7.5% · 30yr · 1.5% tax · 5.0% vac · 8.0% maint · 8.0% mgmt
Financing live
Cash to close
- Down payment
- $91,250
- Closing costs
- $10,950
- Reserves months
- —
- Total cash needed
- —
Loan-product check · same deal, 3 products live
Conventional
25% down · 7.5% · 30yr
- Down + closing
- —
- Monthly P&I
- —
- Monthly cashflow
- —
- DSCR
- —
- Eligible?
- —
Personal DTI + credit; lowest rate.
DSCR
20% down · 8.5% · 30yr
- Down + closing
- —
- Monthly P&I
- —
- Monthly cashflow
- —
- DSCR
- —
- Eligible?
- —
No personal income docs; deal must DSCR.
Hard money
10% down · 12.0% · 12mo
- Down + closing
- —
- Monthly P&I
- —
- Monthly cashflow
- —
- DSCR
- —
- Eligible?
- —
Short-term bridge; refi at stabilization.
Rent comps 4 comps
| Address | Beds | Baths | Sqft | Rent | $/sqft | DOM | Units | Dist |
|---|---|---|---|---|---|---|---|---|
| 4 Grand St Unit 3 Newburgh, NY | 4.0 | 2.0 | 1560 | $3,925 | $2.52 | 26d | 1 | 0.38mi |
| 160 N Miller St #1 Newburgh, NY | 4.0 | 1.0 | 1600 | $2,500 | $1.56 | 46d | 1 | 0.86mi |
| 457 1st St Newburgh, NY | 3.0 | 1.0 | 1680 | $2,950 | $1.76 | 46d | 1 | 0.97mi |
| 87 Ellis Ave Newburgh, NY | 5.0 | 2.5 | 2172 | $2,500 | $1.15 | 46d | 1 | 1.19mi |
Listing history 42 events
-
2026-06-23days on market $365,000 Active 325 DOM
-
2026-06-21days on market $365,000 Active 324 DOM
-
2026-06-18days on market $365,000 Active 321 DOM
-
2026-06-17days on market $365,000 Active 320 DOM
-
2026-06-16days on market $365,000 Active 319 DOM
-
2026-06-15days on market $365,000 Active 318 DOM
-
2026-06-14days on market $365,000 Active 316 DOM
-
2026-06-13days on market $365,000 Active 315 DOM
-
2026-06-10pricedays on market $365,000 Active 313 DOM
-
2026-06-09days on market $399,000 Active 312 DOM
-
2026-06-08days on market $399,000 Active 311 DOM
-
2026-06-07days on market $399,000 Active 310 DOM
-
2026-06-03days on market $399,000 Active 306 DOM
-
2026-06-02days on market $399,000 Active 305 DOM
-
2026-06-01days on market $399,000 Active 304 DOM
-
2026-05-31days on market $399,000 Active 303 DOM
-
2026-05-30days on market $399,000 Active 302 DOM
-
2026-03-20price $399,000 1040-char remark
Show marketing remark (1040 chars)
Here’s your chance to own a classic brick multi-family in Newburgh’s desirable East End Historic District. This fully occupied property features two large 2-bedroom, 1-bath units, each has over 1000 sqft of space. Both apartments offer eat-in kitchens, hardwood-style flooring, and bright bay windows that bring in great natural light. The building includes separate utilities. Two 2-bed / 1-bath units Fully rented with stable tenants Classic brick façade with bay windows Large kitchens with plenty of cabinet space Separate gas and electric meters Full basement with interior and exterior access Prime Location: Minutes to Newburgh Waterfront, ferry to Beacon, I-84 & I-87 Close to local shops, restaurants, and public transit Located on a block lined with historic rowhomes and strong rental demand Whether you’re building your portfolio or looking for a smart owner-occupant play, 91 Carson offers reliable income, architectural character, and long-term upside in a rapidly appreciating market.
-
2025-08-01$425,000 Active 1040-char remark
Show marketing remark (1040 chars)
Here’s your chance to own a classic brick multi-family in Newburgh’s desirable East End Historic District. This fully occupied property features two large 2-bedroom, 1-bath units, each has over 1000 sqft of space. Both apartments offer eat-in kitchens, hardwood-style flooring, and bright bay windows that bring in great natural light. The building includes separate utilities. Two 2-bed / 1-bath units Fully rented with stable tenants Classic brick façade with bay windows Large kitchens with plenty of cabinet space Separate gas and electric meters Full basement with interior and exterior access Prime Location: Minutes to Newburgh Waterfront, ferry to Beacon, I-84 & I-87 Close to local shops, restaurants, and public transit Located on a block lined with historic rowhomes and strong rental demand Whether you’re building your portfolio or looking for a smart owner-occupant play, 91 Carson offers reliable income, architectural character, and long-term upside in a rapidly appreciating market.
-
2022-04-11soldstatus $330,000
-
2022-03-25status Pending 820-char remark
Show marketing remark (820 chars)
This two family building in the heights has been totally renovated in 2021 and just completed. Everything is new. Bring your investors to see the craftsmanship that went into this two family. Go through showing time to be confirmed. Coming soon see 121 William street Newburgh City. You must see the magnificent job these master tradesman have done. Tenants are month, easy to show. NOTE; THIS IS A TWO FAMILY HOME, TOTALLY RENTED TO TWO FAMILIES. TOTAL SQUARE FEET IS 2172 FOR THE ENTIRE BUILDING NOT INCLUSIVE OF THE BASEMENT STORAGE AREA. PRICE PER SQUARE FOOT SHOULD BE $154.00. Both apartments have places (laundry areas) setup to accept a washer dryer. None supplied with apartments. THIS PROPERTY IS NO LONGER AVAILABLE, IT IS SOLD. HGAR IS WORKING ON GETTING IT INTO "SOLD" STATUS.
-
2022-03-01status Active 820-char remark
Show marketing remark (820 chars)
This two family building in the heights has been totally renovated in 2021 and just completed. Everything is new. Bring your investors to see the craftsmanship that went into this two family. Go through showing time to be confirmed. Coming soon see 121 William street Newburgh City. You must see the magnificent job these master tradesman have done. Tenants are month, easy to show. NOTE; THIS IS A TWO FAMILY HOME, TOTALLY RENTED TO TWO FAMILIES. TOTAL SQUARE FEET IS 2172 FOR THE ENTIRE BUILDING NOT INCLUSIVE OF THE BASEMENT STORAGE AREA. PRICE PER SQUARE FOOT SHOULD BE $154.00. Both apartments have places (laundry areas) setup to accept a washer dryer. None supplied with apartments. THIS PROPERTY IS NO LONGER AVAILABLE, IT IS SOLD. HGAR IS WORKING ON GETTING IT INTO "SOLD" STATUS.
-
2021-12-30soldstatus $330,000 Closed 820-char remark
Show marketing remark (820 chars)
This two family building in the heights has been totally renovated in 2021 and just completed. Everything is new. Bring your investors to see the craftsmanship that went into this two family. Go through showing time to be confirmed. Coming soon see 121 William street Newburgh City. You must see the magnificent job these master tradesman have done. Tenants are month, easy to show. NOTE; THIS IS A TWO FAMILY HOME, TOTALLY RENTED TO TWO FAMILIES. TOTAL SQUARE FEET IS 2172 FOR THE ENTIRE BUILDING NOT INCLUSIVE OF THE BASEMENT STORAGE AREA. PRICE PER SQUARE FOOT SHOULD BE $154.00. Both apartments have places (laundry areas) setup to accept a washer dryer. None supplied with apartments. THIS PROPERTY IS NO LONGER AVAILABLE, IT IS SOLD. HGAR IS WORKING ON GETTING IT INTO "SOLD" STATUS.
-
2021-10-26historical 820-char remark
Show marketing remark (820 chars)
This two family building in the heights has been totally renovated in 2021 and just completed. Everything is new. Bring your investors to see the craftsmanship that went into this two family. Go through showing time to be confirmed. Coming soon see 121 William street Newburgh City. You must see the magnificent job these master tradesman have done. Tenants are month, easy to show. NOTE; THIS IS A TWO FAMILY HOME, TOTALLY RENTED TO TWO FAMILIES. TOTAL SQUARE FEET IS 2172 FOR THE ENTIRE BUILDING NOT INCLUSIVE OF THE BASEMENT STORAGE AREA. PRICE PER SQUARE FOOT SHOULD BE $154.00. Both apartments have places (laundry areas) setup to accept a washer dryer. None supplied with apartments. THIS PROPERTY IS NO LONGER AVAILABLE, IT IS SOLD. HGAR IS WORKING ON GETTING IT INTO "SOLD" STATUS.
-
2021-10-08$339,000 Active 820-char remark
Show marketing remark (820 chars)
This two family building in the heights has been totally renovated in 2021 and just completed. Everything is new. Bring your investors to see the craftsmanship that went into this two family. Go through showing time to be confirmed. Coming soon see 121 William street Newburgh City. You must see the magnificent job these master tradesman have done. Tenants are month, easy to show. NOTE; THIS IS A TWO FAMILY HOME, TOTALLY RENTED TO TWO FAMILIES. TOTAL SQUARE FEET IS 2172 FOR THE ENTIRE BUILDING NOT INCLUSIVE OF THE BASEMENT STORAGE AREA. PRICE PER SQUARE FOOT SHOULD BE $154.00. Both apartments have places (laundry areas) setup to accept a washer dryer. None supplied with apartments. THIS PROPERTY IS NO LONGER AVAILABLE, IT IS SOLD. HGAR IS WORKING ON GETTING IT INTO "SOLD" STATUS.
-
2017-06-01soldstatus $36,000 Sold
-
2017-05-07historical Pending
-
2017-03-14$36,000 Active
-
2016-02-22historical Withdrawn
-
2016-02-22historical
-
2015-04-08Active
-
2015-04-08$100,000
-
2013-12-18price $179,000
-
2005-07-11soldstatus $182,000
-
2005-06-27soldstatus $182,000
-
2005-05-05historical
-
2005-03-04$182,000
-
2003-06-16soldstatus $32,500
-
2003-04-18historical
-
2003-04-18price $34,000
-
2002-11-21$32,500
-
1991-11-07soldstatus $80,000
ⓘ Source: listings_history table (triggers on properties + properties_extension) + one-shot
backfill from property_details.listing_events for pre-trigger history.
Tax reassessment forecast NY · Partial reset (capped growth)
- Current annual tax
- $9,627 · $802/mo
- Projected year-2 tax
- $9,627 · $802/mo
- Expected delta
- $0/yr ($0/mo · 0.0%)
ⓘ Screening estimate from a state-policy table — verify with the county assessor before closing.
Climate risk First Street
- Flood 1/10 Low FEMA zone X (unshaded) · 0% chance over 30 yrs
- Wildfire 2/10 Low
- Heat 5/10 Major 7 d/yr ≥100°F today · 16 d/yr by 30 yrs out
- Wind 4/10 Moderate 13% chance of damaging wind over 30 yrs
- Air quality 3/10 Moderate 2 unhealthy d/yr today · 3 by 30 yrs out
Nearby sold comps map
Loading sold comps map…
Walkable amenities ~0.75 mi
Loading nearby amenities…
Taxation est. · year 1
- Rental income
- $47,400
- − Mortgage interest
- −$20,446
- − Property taxes
- −$9,627
- − Insurance
- −$1,825
- − Repairs & maintenance
- −$3,792
- − Management
- −$3,792
- − Depreciation
- −$10,618
- Taxable loss
- −$2,700
- Est. tax savings @ 24.0%
- +$648
- After-tax cash flow
- $3,673/yr
For passive investors: Depreciation is non-cash, so a rental often shows a tax loss while cash-flowing — sheltering income. Rental losses are passive: they offset passive income freely, and up to $25,000/yr can offset ordinary (W-2) income if you actively participate and your MAGI is under $100k (phasing out to $0 by $150k); unused losses carry forward. On sale, claimed depreciation is recaptured at up to 25%, and gains may owe capital-gains tax (a 1031 exchange can defer both). Figures are a year-1 estimate at your 24.0% rate — not tax advice; consult a CPA.
Schools (NCES district)
- District
- Newburgh City School District
- NCES district ID
- 3620700
- Math proficiency
- 33% ▼ -8.00%
- Reading proficiency
- 48% ▲ 10.00%
- Median HH income
- $56,387
- Composite
- 35.46/100
- National rank
- #4927
- State rank
- #500 of 590 in NY
Livability — Newburgh
- Score
- 62/100
- State rank
- #878
- US rank
- #17021
Category grades
Schools grade is shown separately in the Schools card above.
Census & demographics
- Census place
- Newburgh, NY
- County
- Orange County · 267,004 people
- City population
- 55,152
- Metro
- Poughkeepsie-Newburgh-Middletown, NY
- Population (ZIP)
- 55,152
- Household income
- $85,697
- Rent vs Own
- Severe rent burden
- 2412.0
Population outlook (Orange County) Hauer SSP2
- Today (2025)
- 379,830 people
- By 2030
- 378,955 · -0.2%
- By 2040
- 375,444 · -1.2%
- By 2050
- 369,311 · -2.8%
- By 2075
- 354,233 · -6.7%
- By 2100
- 318,150 · -16.2%
Race, ethnicity, and origin ACS 2023
- Neighborhood character
- Diverse neighborhood (Simpson 0.68)
- Race & ethnicity
- Hispanic / Latino 39% White 36% Black 20% Two or more races 12% Asian 2%
- Hispanic origin (detail)
- Mexican 14% Puerto Rican 10% Dominican 2%
- Common ancestry
- Romanian 2% Hispanic 1% Lithuanian 1%
- Foreign-born
- 18% · Canada, Dominican Republic
- Languages at home
- 64% English-only · Spanish 30% French/Haitian/Cajun 1% Other Indo-European 1%
Political lean MEDSL · Orange
- 2024 margin
- Lean R (+8.4) · D 45.8% · R 54.2%
- 2008→2024 swing
- -12.5pp toward R · 2008: 4.1pp · 2024: -8.4pp
- All cycles
- 2024: R+8.4 2020: R+0.2 2016: R+6.5 2012: D+5.2 2008: D+4.1
Not yet ingested
- Civics
- —
Market trends
- HPI YoY
- ▼ -151.93%
- Current HPI
- 304.1046
- Rent YoY
- ▲ 0.63%
- Metro
- Poughkeepsie-Newburgh-Middletown, NY
- State GDP YoY
- ▲ 2.60%
- F500 in state
- 92
Industry mix (Fortune 500 HQ in NY)
| Industry | F500 HQs | Revenue |
|---|---|---|
| Financial Services | 10 | $950B |
|
||
| Consumer Goods | 9 | $162B |
|
||
| Insurance | 4 | $225B |
|
||
| Telecommunications | 2 | $144B |
|
||
| Pharmaceuticals | 2 | $112B |
|
||
| Media / Entertainment | 2 | $69B |
|
||
Price history
+398.8% since first listed25 events — show timeline
- 2026-03-20 Price Changed $399,000 OneKey® MLS as Distributed by MLS Grid
- 2025-08-01 Listed $425,000 OneKey® MLS as Distributed by MLS Grid
- 2022-04-11 Sold (Public Records) $330,000 Public Records
- 2022-03-25 Pending — OneKey® MLS as Distributed by MLS Grid
- 2022-03-01 Relisted — OneKey® MLS as Distributed by MLS Grid
- 2021-12-30 Sold (MLS) $330,000 OneKey® MLS as Distributed by MLS Grid
- 2021-10-26 Listing Removed — OneKey® MLS as Distributed by MLS Grid
- 2021-10-08 Listed $339,000 OneKey® MLS as Distributed by MLS Grid
- 2017-06-01 Sold (MLS) $36,000 OneKey® MLS as Distributed by MLS Grid
- 2017-05-07 Contingent — OneKey® MLS as Distributed by MLS Grid
- 2017-03-14 Listed $36,000 OneKey® MLS as Distributed by MLS Grid
- 2016-02-22 Delisted — HGMLS
- 2016-02-22 Listing Removed — OneKey® MLS as Distributed by MLS Grid
- 2015-04-08 Listed — HGMLS
- 2015-04-08 Listed $100,000 OneKey® MLS as Distributed by MLS Grid
- 2013-12-18 Price Changed $179,000 HGMLS
- 2005-07-11 Sold (Public Records) $182,000 Public Records
- 2005-06-27 Sold (MLS) $182,000 HGMLS
- 2005-05-05 Delisted — HGMLS
- 2005-03-04 Listed $182,000 HGMLS
- 2003-06-16 Sold (MLS) $32,500 HGMLS
- 2003-04-18 Price Changed $34,000 HGMLS
- 2003-04-18 Delisted — HGMLS
- 2002-11-21 Listed $32,500 HGMLS
- 1991-11-07 Sold (Public Records) $80,000 Public Records
Property tax history
+7.3%/yrLatest (2025): $9,627 · -3.9% YoY. Source: county tax records.
Cash-flow waterfall
monthlySold comps — $/sqft
last 12 mo · ≤1 miLoading sold comps…