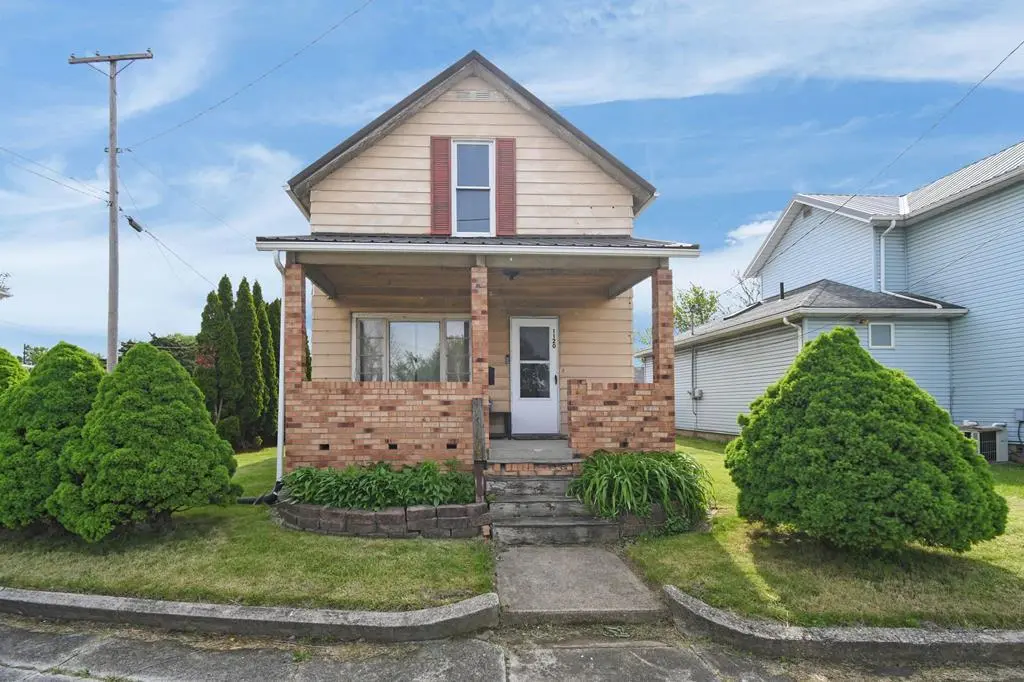
1120 N Sandusky Ave · Bucyrus, OH
Flood risk 1/10 · Minimal
- FEMA flood zone
- X (unshaded)
- Chance of flooding over 30 yrs
- 0.0%
- Est. flood insurance / yr
- $473 – $860
Fire risk 1/10 · Minimal
- Est. fire insurance / yr
- $713 – $1,323
Heat risk 3/10 · Minor
- Hot days now (above 98°F)
- 7 days/yr
- Hot days in 30 yrs
- 17 days/yr
Wind risk 2/10 · Minimal
- Chance of severe wind over 30 yrs
- —
Air-quality risk 2/10 · Minimal
- Unhealthy air days now
- 1 days/yr
- Unhealthy air days in 30 yrs
- 2 days/yr
Risk factors via First Street. Map © Google.
Why this score? — see what drove the B+ grade
The composite is a weighted blend of 9 inputs, each scored 0–100. Each bar is that input's sub-score; the figure is the points it added to the 100-point composite (weight × sub-score).
- Cash flow +30.0/30.0
- ARV discount +15.0/15.0
- DSCR +10.0/10.0
- 1% rule +8.3/10.0
- Livability +3.9/5.0
- Schools +3.4/10.0
- Rent growth +2.5/5.0
- Condition / age +2.5/5.0
- Appreciation +0.0/10.0
$85,000
🖨 Deal sheet (PDF) 📄 Offer letter ✓ Due diligence
Listing remarks
Affordable and full of potential, this Bucyrus home offers comfort and practical updates throughout. Relax on the inviting covered front porch or gather in the cozy family room featuring a fireplace. The home also includes a detached 1-car garage and durable metal roof for added peace of mind. A Google Nest thermostat brings modern convenience, while the basement offers flexibility with the possibility for another bedroom, or additional storage space. Whether you're looking for your first home, downsizing, or adding to your investment portfolio, this property offers a great opportunity with plenty to appreciate. Schedule your showing today!
Key facts
- Covered front porch
- Flexible basement
- Metal roof
Tags
Property features AI
Exterior
- Parking: Gravel parking; 1-car garage
- Utilities: Public water; Public sewer
- Home design: Single-family residence; Residential property
- Construction: Aluminum siding
- Exterior features: Garden; Fenced yard; Corner lot
Interior
- Kitchen: Range; Refrigerator
- Bathrooms: 1 full bathroom
- Heating & cooling: Forced air heating; Natural gas heating
- Interior features: Eat-in kitchen; Partially finished basement; Fireplace in the family room
- Laundry & utility: Washer; Dryer; Gas water heater; Laundry in basement
Neighborhood map
What this means for you Summary
Snapshot
- This is a 2-bed/1.0-bath single-family listed at $85k.
Deal economics
- At list price, monthly cash flow is $337 ($4k/yr) — positive.
- The deal already cash-flows at list — no discount required.
- Meets the 1% rule at list price ($1k rent vs $85k).
- Recommended offer: $84k (1.5% below list) — sets the bar for market timing.
- Cap rate 11.1% vs local median 4.4% in Bucyrus — top-decile yield for the area; either an underpriced asset or a hidden risk that comps aren't pricing in. Stress-test before assuming the spread holds.
Location & tenants
- Location reads 78/100 on livability (#158 in OH, #2,388 nationally) — a middle-class / working-renter tenant base. Strengths: cost of living A+, housing A+, health & safety A+; Watch: employment D, amenities F, commute F.
- Bucyrus City (town): math 37% / reading 46% proficiency, ranked #537 of 656 in OH (top 82%) — families likely to look elsewhere, expect single-tenant / working-renter base with shorter leases.
- Zoned schools: Bucyrus Elementary School (math 48% / reading 42%, grade D-, #984 of 1,584 statewide, top 62%, 544 students, 72% FRL); Bucyrus Middle School (math 28% / reading 44%, grade F, #541 of 654 statewide, top 83%, 272 students, 0% FRL); Bucyrus Secondary School (math 32% / reading 62%, grade D-, #435 of 781 statewide, top 59%, 290 students, 99% FRL) — zoned schools at 57% FRL track the district average.
- Market conditions: 80 active listings in the ZIP; 8 units permitted in Crawford County in 2024 (0 in 5+ unit buildings).
Forward outlook
- Local home prices are declining (-3.0%/yr); year-one equity from $588 of loan paydown is wiped out by about $3k of value loss. Plan a longer hold.
- Crawford County population projected at -22% by 2050 — secular population decline; favor cash flow + early exit over multi-decade hold.
- At projected returns (-3.0% appreciation + 3.0% rent growth), your $24k cash investment doubles in ~8 years — after that, you're playing with house money.
Negotiation context
- It's been on market 23 days — a 2% lower offer ($84k) is reasonable based on typical stale-listing flexibility.
- Current owner paid $45k; list at $85k implies a 89% gain — meaningful room to come down on a strong offer.
Questions for the listing agent
- Is there a deadline driving the sale (1031 exchange, divorce, estate, relocation)? That informs how much negotiation room exists.
- What's the average days-on-market for RENTAL listings here right now (not sales)? A rising rental-DOM trend means longer vacancies and softer asking-rent achievability than the comps imply.
- What's the recent tenant-quality profile in this submarket — average credit score on applications, eviction rate, late-payment / NSF rate, and stable-employment percentage? A property-management company in the area should have these aggregated.
- How much new for-sale + rental construction is in the pipeline within 1–3 miles? Heavy new supply typically softens prices + rents 12–24 months out; constrained supply supports both.
Investment metrics
- 1% rule
- 1.33% ✓
- Cap rate
- 11.06%
- Cash-on-cash
- 17.01%
- DSCR
- 1.76
- GRM
- 6.3
CMA / ARV
- ARV (median comp)
- $102,732
- List price
- $85,000
- Delta
- -17.26%
- Verdict
- UNDERPRICED
- Comps
- 20 within 1.0 mi
Show comp detail 12 sales within ~0.75 mi
| Address | Dist | Beds/Ba | Sqft | Sold | Price | $/sf | Match |
|---|---|---|---|---|---|---|---|
| 926 Maple St | 0.21mi | 3/1.0 (+1) | 1,278 (-1%) | 4mo | $100,000 | $78 | 80 |
| 800 High St | 0.42mi | 3/1.5 (+1) | 1,296 (+1%) | 1mo | $132,900 | $103 | 71 |
| 116 W Irving St | 0.06mi | 3/2.0 (+1) | 1,382 (+7%) | 13mo | $123,000 | $89 | 65 |
| 127 Gaius St | 0.27mi | 3/1.0 (+1) | 1,218 (-5%) | 11mo | $174,900 | $144 | 64 |
| 133 Dudley St | 0.08mi | 3/1.5 (+1) | 1,444 (+12%) | 9mo | $82,500 | $57 | 62 |
| 710 High St | 0.45mi | 3/1.5 (+1) | 1,264 (-2%) | 17mo | $154,000 | $122 | 55 |
| 819 High St | 0.39mi | 3/1.5 (+1) | 1,194 (-7%) | 10mo | $95,000 | $80 | 54 |
| 1125 Willard St | 0.21mi | 3/1.0 (+1) | 1,160 (-10%) | 18mo | $107,000 | $92 | 54 |
| 414 River St | 0.60mi | 3/2.0 (+1) | 1,360 (+6%) | 1mo | $187,000 | $138 | 52 |
| 108 Melcher Blvd | 0.27mi | 3/1.0 (+1) | 1,472 (+14%) | 11mo | $189,000 | $128 | 49 |
| 212 N Poplar St | 0.71mi | 2/2.0 | 1,351 (+5%) | 18mo | $52,500 | $39 | 40 |
| 440 Sears St | 0.70mi | 3/1.5 (+1) | 1,104 (-14%) | 10mo | $186,000 | $168 | 28 |
Match score weights: distance 35% · size 25% · config 20% · recency 20%. Top-matched comps best support the ARV.
Projected returns pro-forma
-3.0% appreciation · 3.0% rent growth · sell at horizon
- IRR
- 8.3%
- Equity multiple
- 1.32×
- Total profit
- $7,717
- Equity at exit
- $12,674
- IRR
- 17.5%
- Equity multiple
- 2.44×
- Total profit
- $34,384
- Equity at exit
- $7,349
Cash invested: $23,800 (down + closing). Projections, not guarantees.
Landlord ↔ Tenant lean methodology
- Overall (STATE)
- 73 Landlord-Friendly
- State Ohio
- 73 Landlord-Friendly · R+6
- County
- — inherits STATE
- City
- — inherits STATE
ZIP-level market 44820
- Home prices YoY
- -27.1%
- Active inventory
- 80
- Price-to-rent
- 6.3×
Monthly cashflow live
- Estimated rent
- $1,130 medium interval (Pro) →
- Mortgage (P&I)
- −$446
- Tax from tax record
- −$74 /mo · $887/yr
- Insurance
- −$35
- HOA
- −$0
- Lot rent
- −$0
- Vacancy / Maint / Mgmt
- −$237
- Net cashflow
- $337
Break-even live
Sensitivity live
| Price | -10% $386 | -5% $362 | +0% $337 | +5% $313 | +10% $289 |
|---|---|---|---|---|---|
| Rent | -10% $248 | -5% $293 | +0% $337 | +5% $382 | +10% $427 |
| Rate | -1.0pp $380 | -0.5pp $359 | base $337 | +0.5pp $315 | +1.0pp $293 |
UW: 25.0% down · 7.5% · 30yr · 1.5% tax · 5.0% vac · 8.0% maint · 8.0% mgmt
Financing live
Cash to close
- Down payment
- $21,250
- Closing costs
- $2,550
- Reserves months
- —
- Total cash needed
- —
Loan-product check · same deal, 3 products live
Conventional
25% down · 7.5% · 30yr
- Down + closing
- —
- Monthly P&I
- —
- Monthly cashflow
- —
- DSCR
- —
- Eligible?
- —
Personal DTI + credit; lowest rate.
DSCR
20% down · 8.5% · 30yr
- Down + closing
- —
- Monthly P&I
- —
- Monthly cashflow
- —
- DSCR
- —
- Eligible?
- —
No personal income docs; deal must DSCR.
Hard money
10% down · 12.0% · 12mo
- Down + closing
- —
- Monthly P&I
- —
- Monthly cashflow
- —
- DSCR
- —
- Eligible?
- —
Short-term bridge; refi at stabilization.
Listing history 4 events
-
2026-05-31status $85,000 Pending 23 DOM
-
2026-05-07$90,000 Active 648-char remark
-
2021-08-19soldstatus $45,000
-
2007-10-23soldstatus $35,000
ⓘ Source: listings_history table (triggers on properties + properties_extension) + one-shot
backfill from property_details.listing_events for pre-trigger history.
Tax reassessment forecast OH · Partial reset (capped growth)
- Current annual tax
- $887 · $74/mo
- Projected year-2 tax
- $1,107 · $92/mo
- Expected delta
- +$219/yr (+$18/mo · 24.7%)
ⓘ Screening estimate from a state-policy table — verify with the county assessor before closing.
Climate risk First Street
- Flood 1/10 Low FEMA zone X (unshaded) · 0% chance over 30 yrs
- Wildfire 1/10 Low
- Heat 3/10 Moderate 7 d/yr ≥98°F today · 17 d/yr by 30 yrs out
- Wind 2/10 Low
- Air quality 2/10 Low 1 unhealthy d/yr today · 2 by 30 yrs out
Nearby sold comps map
Loading sold comps map…
Walkable amenities ~0.75 mi
Loading nearby amenities…
Taxation est. · year 1
- Rental income
- $13,558
- − Mortgage interest
- −$4,761
- − Property taxes
- −$887
- − Insurance
- −$425
- − Repairs & maintenance
- −$1,085
- − Management
- −$1,085
- − Depreciation
- −$2,473
- Taxable income
- $2,842
- Est. tax owed @ 24.0%
- −$682
- After-tax cash flow
- $3,367/yr
For passive investors: Depreciation is non-cash, so a rental often shows a tax loss while cash-flowing — sheltering income. Rental losses are passive: they offset passive income freely, and up to $25,000/yr can offset ordinary (W-2) income if you actively participate and your MAGI is under $100k (phasing out to $0 by $150k); unused losses carry forward. On sale, claimed depreciation is recaptured at up to 25%, and gains may owe capital-gains tax (a 1031 exchange can defer both). Figures are a year-1 estimate at your 24.0% rate — not tax advice; consult a CPA.
Schools (NCES district)
- District
- Bucyrus City
- NCES district ID
- 3904368
- Math proficiency
- 37% ▼ -15.00%
- Reading proficiency
- 46% ▼ -5.00%
- Median HH income
- $36,819
- Composite
- 34.45/100
- National rank
- #5196
- State rank
- #537 of 656 in OH
Livability — Bucyrus
- Score
- 78/100
- State rank
- #158
- US rank
- #2388
Category grades
Schools grade is shown separately in the Schools card above.
Census & demographics
- Census place
- Bucyrus, OH
- County
- Crawford · 26,873 people
- City population
- 17,265
- Population (ZIP)
- 17,265
- Household income
- $56,942
- Rent vs Own
- Severe rent burden
- 8.2
Population outlook (Crawford County) Hauer SSP2
- Today (2025)
- 39,421 people
- By 2030
- 37,656 · -4.5%
- By 2040
- 34,043 · -13.6%
- By 2050
- 30,617 · -22.3%
- By 2075
- 23,652 · -40.0%
- By 2100
- 17,786 · -54.9%
Race, ethnicity, and origin ACS 2023
- Neighborhood character
- Predominantly White (93%)
- Race & ethnicity
- White 93% Two or more races 3% Hispanic / Latino 2% Asian 1% Black 1%
- Common ancestry
- Iranian 2% Lithuanian 2% Slovak 1%
- Foreign-born
- 1%
- Languages at home
- 97% English-only · Other Asian/Pacific 1% Spanish 1%
Political lean MEDSL · Crawford
- 2024 margin
- Solid R (+53.0) · D 23.1% · R 76.1%
- 2008→2024 swing
- -33.9pp toward R · 2008: -19.0pp · 2024: -53.0pp
- All cycles
- 2024: R+53.0 2020: R+50.9 2016: R+46.8 2012: R+22.7 2008: R+19.0
Not yet ingested
- Civics
- —
Market trends
- HPI YoY
- ▼ -65.64%
- Current HPI
- 176.3548
- Rent YoY
- —
- Metro
- —
- State GDP YoY
- ▲ 1.98%
- F500 in state
- 48
Industry mix (Fortune 500 HQ in OH)
| Industry | F500 HQs | Revenue |
|---|---|---|
| Insurance | 3 | $145B |
|
||
| Industrial Machinery | 3 | $49B |
|
||
| Financial Services | 3 | $24B |
|
||
| Consumer Goods | 2 | $93B |
|
||
| Aerospace / Defense | 2 | $47B |
|
||
| Utilities | 2 | $33B |
|
||
Price history
+142.9% since first listed5 events — show timeline
- 2026-05-30 Pending — MARMLS
- 2026-05-26 Price Changed $85,000 MARMLS
- 2026-05-07 Listed $90,000 MARMLS
- 2021-08-19 Sold (Public Records) $45,000 Public Records
- 2007-10-23 Sold (Public Records) $35,000 Public Records
Property tax history
+3.9%/yrLatest (2025): $887 · -1.3% YoY. Source: county tax records.
Cash-flow waterfall
monthlySold comps — $/sqft
last 12 mo · ≤1 miLoading sold comps…