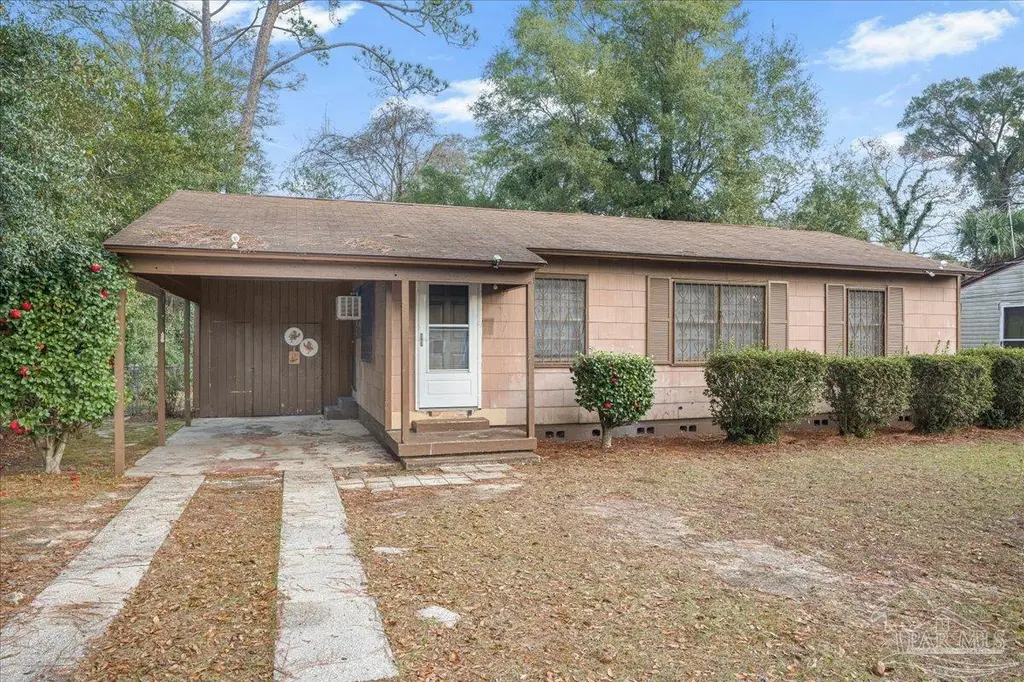
3218 6th Ave · Pensacola, FL
Flood risk 1/10 · Minimal
- FEMA flood zone
- X (unshaded)
- Chance of flooding over 30 yrs
- 0.0%
- Est. flood insurance / yr
- $507 – $1,088
Fire risk 1/10 · Minimal
- Est. fire insurance / yr
- $947 – $1,759
Heat risk 10/10 · Severe
- Hot days now (above 105°F)
- 7 days/yr
- Hot days in 30 yrs
- 22 days/yr
Wind risk 9/10 · Severe
- Chance of severe wind over 30 yrs
- 99.0%
Air-quality risk 2/10 · Minimal
- Unhealthy air days now
- 0 days/yr
- Unhealthy air days in 30 yrs
- 1 days/yr
Risk factors via First Street. Map © Google.
Why this score? — see what drove the B+ grade
The composite is a weighted blend of 9 inputs, each scored 0–100. Each bar is that input's sub-score; the figure is the points it added to the 100-point composite (weight × sub-score).
- Cash flow +30.0/30.0
- ARV discount +15.0/15.0
- DSCR +10.0/10.0
- 1% rule +8.6/10.0
- Livability +4.2/5.0
- Schools +3.6/10.0
- Rent growth +3.3/5.0
- Condition / age +2.5/5.0
- Appreciation +0.0/10.0
$115,000
🖨 Deal sheet (PDF) 📄 Offer letter ✓ Due diligence
Listing remarks MLS
Investor Opportunity. This property is conveniently located near downtown pensacola, I-110, and the Cordova mall area. Priced to sell.
Key facts
- Near i-110
- Conveniently located
- 8,712 sq ft lot
Tags
Neighborhood map
What this means for you Summary
Snapshot
- This is a 2-bed/1.0-bath single-family listed at $115k.
Deal economics
- At list price, monthly cash flow is $474 ($6k/yr) — positive.
- The deal already cash-flows at list — no discount required.
- Meets the 1% rule at list price ($2k rent vs $115k).
- Recommended offer: $101k (12.0% below list) — sets the bar for market timing.
Location & tenants
- Location reads 83/100 on livability (#53 in FL, #924 nationally) — a professional / high-income tenant draw. Strengths: commute A+, cost of living A+, housing A+.
- Escambia (suburban): math 40% / reading 45% proficiency, ranked #56 of 73 in FL (top 77%) — families likely to look elsewhere, expect single-tenant / working-renter base with shorter leases.
- Zoned schools: O. J. Semmes Elementary School (math 22% / reading 17%, grade F, #2,105 of 2,144 statewide, top 98%, 302 students, 91% FRL); Ferry Pass Middle School (math 34% / reading 33%, grade F, #428 of 571 statewide, top 76%, 1,014 students, 64% FRL); Washington Senior High School (math 25% / reading 40%, grade F, #411 of 667 statewide, top 62%, 1,733 students, 51% FRL).
- Zoned-school proficiency averages 28% at this address vs 42% district-wide (-14 pts) — the specific schools serving this property underperform the Escambia average; the district grade overstates school quality for this exact location.
- Market conditions: Rents rising (+3.4%/yr); 240 active listings in the ZIP; 8 comparable units currently listed for rent nearby; rentals at typical pace (median 25d on market — plan ~3-4 weeks tenant-placement turnaround); 1,479 units permitted in Escambia County in 2024 (0 in 5+ unit buildings).
Forward outlook
- Local home prices are declining (-3.0%/yr); year-one equity from $795 of loan paydown is wiped out by about $3k of value loss. Plan a longer hold.
- Escambia County population projected at +13% by 2050 — modest demand growth; plan on rents tracking national, not racing it.
- At projected returns (-3.0% appreciation + 3.4% rent growth), your $32k cash investment doubles in ~7 years — after that, you're playing with house money.
Negotiation context
- It's been on market 160 days — a 12% lower offer ($101k) is reasonable based on typical stale-listing flexibility.
- 2 sale attempts since 6y ago with the ask held roughly flat each time — persistent listings suggest the price (not the market) is what's stuck; bring a comps-based counter.
- Current owner paid $65k; list at $115k implies a 77% gain — meaningful room to come down on a strong offer.
Risks & watch-outs
- Watch-outs: built in 1956 — expect roof / HVAC / electrical / plumbing capex.
- Climate carrying-cost: severe wind risk, 99% chance of damaging wind over 30y; extreme-heat days projected 7→22/yr by 2055 (HVAC capex compounding) — expect insurance premiums to compound above CPI over the hold.
Questions for the listing agent
- It's been on market 160 days. Have you received any prior offers? Is the seller open to a 12% concession, seller financing, or rate buy-down credit?
- Built in 1956 — when were the roof, HVAC, electrical panel, plumbing, and water heater last replaced?
- Why hasn't it sold? Are there any deal-killer items the seller is aware of (foundation, flood, title, zoning, code violations)?
- Is there a deadline driving the sale (1031 exchange, divorce, estate, relocation)? That informs how much negotiation room exists.
- What's the average days-on-market for RENTAL listings here right now (not sales)? A rising rental-DOM trend means longer vacancies and softer asking-rent achievability than the comps imply.
- What's the recent tenant-quality profile in this submarket — average credit score on applications, eviction rate, late-payment / NSF rate, and stable-employment percentage? A property-management company in the area should have these aggregated.
- How much new for-sale + rental construction is in the pipeline within 1–3 miles? Heavy new supply typically softens prices + rents 12–24 months out; constrained supply supports both.
Investment metrics
- 1% rule
- 1.36% ✓
- Cap rate
- 11.24%
- Cash-on-cash
- 17.68%
- DSCR
- 1.79
- GRM
- 6.1
CMA / ARV
- ARV (median comp)
- $146,686
- List price
- $115,000
- Delta
- -21.60%
- Verdict
- UNDERPRICED
- Comps
- 20 within 1.0 mi
Show comp detail 9 sales within ~0.75 mi
| Address | Dist | Beds/Ba | Sqft | Sold | Price | $/sf | Match |
|---|---|---|---|---|---|---|---|
| 3001 Torres Ave | 0.34mi | 3/1.0 (+1) | 912 (+3%) | 6mo | $130,000 | $143 | 69 |
| 3219 N Tarragona St | 0.36mi | 2/2.0 | 937 (+6%) | 12mo | $184,990 | $197 | 60 |
| 3344 Marcus Dr | 0.54mi | 2/1.0 | 816 (-8%) | 2mo | $68,000 | $83 | 59 |
| 3317 Marcus Dr | 0.61mi | 2/1.0 | 930 (+5%) | 19mo | $105,000 | $113 | 48 |
| 1316 1/2 E Baars St | 0.60mi | 3/1.0 (+1) | 989 (+11%) | 1mo | $300,000 | $303 | 47 |
| 123 Berkley Dr | 0.64mi | 3/1.0 (+1) | 912 (+3%) | 23mo | $185,000 | $203 | 42 |
| 2504 N Davis Hwy | 0.71mi | 3/1.5 (+1) | 977 (+10%) | 6mo | $173,500 | $178 | 38 |
| 719 Woodland Dr | 0.70mi | 3/1.0 (+1) | 1,012 (+14%) | 5mo | $215,000 | $212 | 35 |
| 3915 N 10th Ave | 0.52mi | 3/1.0 (+1) | 1,014 (+14%) | 18mo | $180,700 | $178 | 32 |
Match score weights: distance 35% · size 25% · config 20% · recency 20%. Top-matched comps best support the ARV.
Projected returns pro-forma
-3.0% appreciation · 3.39% rent growth · sell at horizon
- IRR
- 9.6%
- Equity multiple
- 1.38×
- Total profit
- $12,196
- Equity at exit
- $17,147
- IRR
- 19.0%
- Equity multiple
- 2.62×
- Total profit
- $52,084
- Equity at exit
- $9,943
Cash invested: $32,200 (down + closing). Projections, not guarantees.
Landlord ↔ Tenant lean methodology
- Overall (STATE)
- 87 Strongly Landlord-Friendly
- State Florida
- 87 Strongly Landlord-Friendly · R+3
- County
- — inherits STATE
- City
- — inherits STATE
ZIP-level market 32503
- Rents YoY
- 3.4%
- Active inventory
- 240
- Price-to-rent
- 6.1×
Monthly cashflow live
- Estimated rent
- $1,564 high interval (Pro) →
- Mortgage (P&I)
- −$603
- Tax from tax record
- −$110 /mo · $1,326/yr
- Insurance
- −$48
- HOA
- −$0
- Vacancy / Maint / Mgmt
- −$329
- Net cashflow
- $474
Break-even live
Sensitivity live
| Price | -10% $539 | -5% $507 | +0% $474 | +5% $442 | +10% $409 |
|---|---|---|---|---|---|
| Rent | -10% $351 | -5% $413 | +0% $474 | +5% $536 | +10% $598 |
| Rate | -1.0pp $532 | -0.5pp $504 | base $474 | +0.5pp $445 | +1.0pp $414 |
UW: 25.0% down · 7.5% · 30yr · 1.5% tax · 5.0% vac · 8.0% maint · 8.0% mgmt
Financing live
Cash to close
- Down payment
- $28,750
- Closing costs
- $3,450
- Reserves months
- —
- Total cash needed
- —
Loan-product check · same deal, 3 products live
Conventional
25% down · 7.5% · 30yr
- Down + closing
- —
- Monthly P&I
- —
- Monthly cashflow
- —
- DSCR
- —
- Eligible?
- —
Personal DTI + credit; lowest rate.
DSCR
20% down · 8.5% · 30yr
- Down + closing
- —
- Monthly P&I
- —
- Monthly cashflow
- —
- DSCR
- —
- Eligible?
- —
No personal income docs; deal must DSCR.
Hard money
10% down · 12.0% · 12mo
- Down + closing
- —
- Monthly P&I
- —
- Monthly cashflow
- —
- DSCR
- —
- Eligible?
- —
Short-term bridge; refi at stabilization.
Rent comps 8 comps
| Address | Beds | Baths | Sqft | Rent | $/sqft | DOM | Units | Dist |
|---|---|---|---|---|---|---|---|---|
| 3131 N 10th Ave Pensacola, FL | 3.0 | 1.5 | 1085 | $1,700 | $1.57 | 25d | 1 | 0.36mi |
| 2310 N Baylen St Pensacola, FL | 2.0 | 1.0 | 660 | $1,350 | $2.05 | 25d | 1 | 1.00mi |
| 2115 N 12th Ave Pensacola, FL | 2.0 | 1.5 | 950 | $1,800 | $1.89 | 15d | 1 | 1.01mi |
| 2008 N 8th Ave Pensacola, FL | 3.0 | 2.0 | 1058 | $1,250 | $1.18 | 15d | 1 | 1.03mi |
| 531 Ditmar St Unit B Pensacola, FL | 2.0 | 1.0 | 1094 | $1,450 | $1.33 | 25d | 1 | 1.12mi |
| 721 W Jordan St Pensacola, FL | 3.0 | 2.0 | 1030 | $1,895 | $1.84 | 25d | 1 | 1.31mi |
| 538 Royce St Unit 1A Pensacola, FL | 2.0 | 1.0 | 1000 | $1,425 | $1.43 | 25d | 1 | 1.39mi |
| 1705 N 17th Ave Pensacola, FL | 1.0 | 1.0 | 600 | $1,095 | $1.82 | 25d | 1 | 1.48mi |
Listing history 19 events
-
2026-06-21days on market $115,000 Active 160 DOM
-
2026-06-18days on market $115,000 Active 157 DOM
-
2026-06-17days on market $115,000 Active 156 DOM
-
2026-06-16days on market $115,000 Active 155 DOM
-
2026-06-15days on market $115,000 Active 154 DOM
-
2026-06-14days on market $115,000 Active 152 DOM
-
2026-06-10days on market $115,000 Active 149 DOM
-
2026-06-09days on market $115,000 Active 148 DOM
-
2026-06-08days on market $115,000 Active 147 DOM
-
2026-06-07days on market $115,000 Active 146 DOM
-
2026-06-03days on market $115,000 Active 142 DOM
-
2026-06-02days on market $115,000 Active 141 DOM
-
2026-06-01days on market $115,000 Active 140 DOM
-
2026-05-31days on market $115,000 Active 139 DOM
-
2026-05-31days on market $115,000 Active 138 DOM
-
2026-01-12$115,000 Active 134-char remark
Show marketing remark (134 chars)
Investor Opportunity. This property is conveniently located near downtown pensacola, I-110, and the Cordova mall area. Priced to sell.
-
2021-01-11soldstatus $65,000 173-char remark
Show marketing remark (173 chars)
PRICE ADJUSTMENT DOWN $$5K ~ Cute 3 bedroom / 1 bath home with hardwood floors. Window Units Only. Great investment rental. "AS IS" Huge backyard. Won't last long.
-
2020-12-01$80,000 173-char remark
Show marketing remark (173 chars)
PRICE ADJUSTMENT DOWN $$5K ~ Cute 3 bedroom / 1 bath home with hardwood floors. Window Units Only. Great investment rental. "AS IS" Huge backyard. Won't last long.
-
1969-01-01soldstatus $13,000
ⓘ Source: listings_history table (triggers on properties + properties_extension) + one-shot
backfill from property_details.listing_events for pre-trigger history.
Tax reassessment forecast FL · Resets to sale price
- Current annual tax
- $1,326 · $110/mo
- Projected year-2 tax
- $1,326 · $110/mo
- Expected delta
- $0/yr ($0/mo · 0.0%)
ⓘ Screening estimate from a state-policy table — verify with the county assessor before closing.
Climate risk First Street
- Flood 1/10 Low FEMA zone X (unshaded) · 0% chance over 30 yrs
- Wildfire 1/10 Low
- Heat 10/10 Extreme 7 d/yr ≥105°F today · 22 d/yr by 30 yrs out
- Wind 9/10 Extreme 99% chance of damaging wind over 30 yrs
- Air quality 2/10 Low 0 unhealthy d/yr today · 1 by 30 yrs out
Nearby sold comps map
Loading sold comps map…
Walkable amenities ~0.75 mi
Loading nearby amenities…
Taxation est. · year 1
- Rental income
- $18,772
- − Mortgage interest
- −$6,442
- − Property taxes
- −$1,326
- − Insurance
- −$575
- − Repairs & maintenance
- −$1,502
- − Management
- −$1,502
- − Depreciation
- −$3,345
- Taxable income
- $4,080
- Est. tax owed @ 24.0%
- −$979
- After-tax cash flow
- $4,713/yr
For passive investors: Depreciation is non-cash, so a rental often shows a tax loss while cash-flowing — sheltering income. Rental losses are passive: they offset passive income freely, and up to $25,000/yr can offset ordinary (W-2) income if you actively participate and your MAGI is under $100k (phasing out to $0 by $150k); unused losses carry forward. On sale, claimed depreciation is recaptured at up to 25%, and gains may owe capital-gains tax (a 1031 exchange can defer both). Figures are a year-1 estimate at your 24.0% rate — not tax advice; consult a CPA.
Schools (NCES district)
- District
- Escambia
- NCES district ID
- 1200510
- Math proficiency
- 40% ▼ -9.00%
- Reading proficiency
- 45% ▼ -4.00%
- Median HH income
- $44,649
- Composite
- 36.04/100
- National rank
- #4773
- State rank
- #56 of 73 in FL
Livability — Pensacola
- Score
- 83/100
- State rank
- #53
- US rank
- #924
Category grades
Schools grade is shown separately in the Schools card above.
Census & demographics
- Census place
- Pensacola, FL
- County
- Escambia County · 301,722 people
- City population
- 237,636
- Metro
- Pensacola-Ferry Pass-Brent, FL
- Population (ZIP)
- 33,559
- Household income
- $71,411
- Rent vs Own
- Severe rent burden
- 948.0
Population outlook (Escambia County) Hauer SSP2
- Today (2025)
- 334,637 people
- By 2030
- 345,779 · +3.3%
- By 2040
- 364,828 · +9.0%
- By 2050
- 378,514 · +13.1%
- By 2075
- 403,220 · +20.5%
- By 2100
- 386,125 · +15.4%
Race, ethnicity, and origin ACS 2023
- Neighborhood character
- Predominantly White (68%)
- Race & ethnicity
- White 68% Black 20% Two or more races 6% Hispanic / Latino 5% Asian 2%
- Common ancestry
- Lithuanian 3% Italian 2% Romanian 2%
- Foreign-born
- 5% · Canada, China
- Languages at home
- 93% English-only · Spanish 3% Arabic 1% Tagalog/Filipino 1%
Political lean MEDSL · Escambia
- 2024 margin
- R (+19.5) · D 39.7% · R 59.2% · Other 1.1%
- 2008→2024 swing
- -0.2pp no change · 2008: -19.3pp · 2024: -19.5pp
- All cycles
- 2024: R+19.5 2020: R+15.1 2016: R+20.6 2012: R+20.6 2008: R+19.3
Not yet ingested
- Civics
- —
Market trends
- HPI YoY
- ▼ -300.02%
- Current HPI
- 294.4873
- Rent YoY
- ▲ 3.39%
- Metro
- Pensacola-Ferry Pass-Brent, FL
- State GDP YoY
- ▲ 3.28%
- F500 in state
- 36
Industry mix (Fortune 500 HQ in FL)
| Industry | F500 HQs | Revenue |
|---|---|---|
| Industrial Technology | 2 | $29B |
|
||
| Insurance | 2 | $17B |
|
||
| Retail | 1 | $60B |
|
||
| Technology Distribution | 1 | $58B |
|
||
| Homebuilding | 1 | $35B |
|
||
| Technology Manufacturing | 1 | $35B |
|
||
Price history
+784.6% since first listed4 events — show timeline
- 2026-01-12 Listed $115,000 PARMLS
- 2021-01-11 Sold (MLS) $65,000 PARMLS
- 2020-12-01 Listed $80,000 PARMLS
- 1969-01-01 Sold (Public Records) $13,000 Public Records
Property tax history
+6.8%/yrLatest (2025): $1,326 · +5.4% YoY. Source: county tax records.
Cash-flow waterfall
monthlySold comps — $/sqft
last 12 mo · ≤1 miLoading sold comps…