 Duplex
79 - 81 W Enterprise St · Glen Lyon, PA
Flood risk 1/10 · Minimal
- FEMA flood zone
- X (unshaded)
- Chance of flooding over 30 yrs
- 0.0%
- Est. flood insurance / yr
- $507 – $1,088
Fire risk 4/10 · Minor
- Est. fire insurance / yr
- $511 – $949
Heat risk 4/10 · Minor
- Hot days now (above 94°F)
- 8 days/yr
- Hot days in 30 yrs
- 17 days/yr
Wind risk 3/10 · Minor
- Chance of severe wind over 30 yrs
- 4.0%
Air-quality risk 2/10 · Minimal
- Unhealthy air days now
- 1 days/yr
- Unhealthy air days in 30 yrs
- 2 days/yr
Risk factors via First Street. Map © Google.
Why this score? — see what drove the C- grade
The composite is a weighted blend of 9 inputs, each scored 0–100. Each bar is that input's sub-score; the figure is the points it added to the 100-point composite (weight × sub-score).
- Cash flow +16.7/30.0
- Appreciation +7.8/10.0
- ARV discount +7.5/15.0
- DSCR +5.2/10.0
- 1% rule +3.6/10.0
- Livability +3.1/5.0
- Rent growth +2.5/5.0
- Condition / age +2.5/5.0
- Schools +2.0/10.0
$245,000
🖨 Deal sheet (PDF) 📄 Offer letter ✓ Due diligence
Multi-family units
County records classify this as Multi-Family (2-4 Unit). Listing-text estimate: 2 units. confirmed
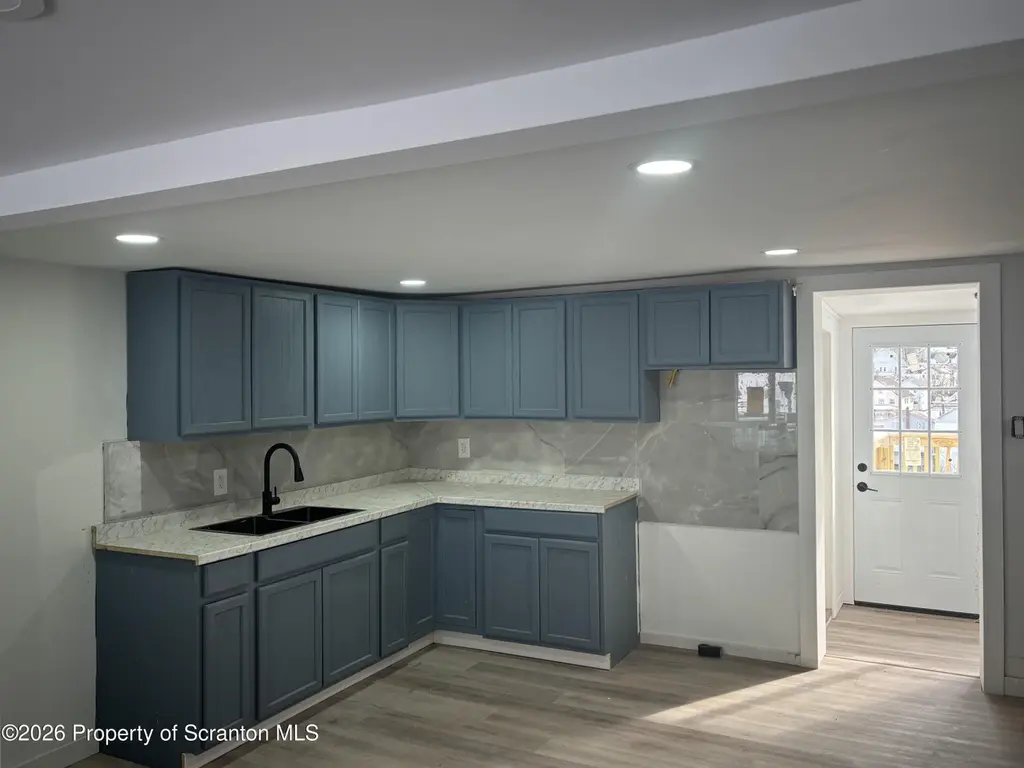
Listing remarks
Discover this freshly renovated multi-family home located in the quiet, desirable neighborhood of Glen Lyon. Whether you're looking to live in one unit and rent out the other or expand your investment portfolio, this property delivers comfort, value, and strong rental potential. Unit 1 2 bedrooms 1.5 baths Private deck with stunning views Unit 2 3 bedrooms 1.5 baths Separate deck overlooking scenic surroundings Both units have been thoughtfully updated, offering modern finishes, spacious layouts, and outdoor spaces ideal for relaxing or entertaining. This is a must-see opportunity--schedule your showing today!
Key facts
- Private deck
- Spacious layouts
- Stunning views
Tags
Property features AI
Finance
- Financial info: Two-unit property (both units furnished); Total living area reported as 1,900
- HOA & community: No community features listed
Exterior
- Parking: Driveway; Off-street parking; Private parking; 2 parking spaces
- Utilities: Public water; Public sewer; Electricity available with 200+ amp service
- Home design: Multi-family residential income property; Attached property with one common wall; Bi-level layout; Updated/remodeled; Built in 1980 (estimated)
- Construction: Aluminum siding; Combination foundation with concrete perimeter
- Exterior features: Balcony; Private yard; Back yard; Cleared lot; Shingle roof
Interior
- Kitchen: Kitchens in both units; Electric water heater
- Bedrooms: Total of 5 bedrooms; Unit 79: 2 bedrooms; Unit 81: 3 bedrooms
- Flooring: Vinyl flooring
- Bathrooms: 4 bathrooms total (2 full, 2 half); Unit 79: 2 bathrooms; Unit 81: 2 bathrooms
- Heating & cooling: Central air; Ductless heating; Zoned heating
- Interior features: Eat-in kitchen; Open floor plan; Recessed lighting; Finished attic; Wood window frames; Unfurnished
- Laundry & utility: Washer hookup; Electric dryer hookup
Neighborhood map
What this means for you Summary
Snapshot
- This is a 1×2.0bd/1.5ba + 1×3.0bd/1.5ba units multifamily listed at $245k.
Deal economics
- At list price, monthly cash flow is $153 ($2k/yr) — positive. Per door: $77/mo.
- The deal already cash-flows at list — no discount required.
- To meet the 1% rule (rent ≥ 1% of price), the offer needs to be $211k (14.0% below list).
- Recommended offer: $211k (14.0% below list) — sets the bar for 1% rule.
Location & tenants
- Location reads 61/100 on livability (#1,432 in PA) — a middle-class / working-renter tenant base. Strengths: crime A+, cost of living A+, housing B+; Watch: amenities F, commute F, employment D-.
- Greater Nanticoke Area SD (suburban): math 14% / reading 34% proficiency, ranked #479 of 539 in PA (top 89%) — low school quality limits family demand, transient renter base, plan for 1-2y turnover.
- Zoned schools: Gna El Ctr (math 15% / reading 36%, grade F, #1,172 of 1,518 statewide, top 77%, 505 students, 100% FRL); Greater Nanticoke Area Ed Ctr (math 4% / reading 32%, grade F, #453 of 512 statewide, top 89%, 539 students, 100% FRL); Greater Nanticoke Area Shs (math 52%, 714 students, 89% FRL) — zoned schools average 96% FRL vs 52% district-wide (44 pts higher); higher-poverty schools than district average — tighter screening recommended.
- Market conditions: 20 active listings in the ZIP; 3 comparable units currently listed for rent nearby; rentals at typical pace (median 16d on market — plan ~3-4 weeks tenant-placement turnaround); 349 units permitted in Luzerne County in 2024 (16 in 5+ unit buildings).
Forward outlook
- In year one you build about $15k of equity ($2k loan paydown + $14k appreciation (5.6% local appreciation)).
- Luzerne County population projected at +4% by 2050 — modest demand growth; plan on rents tracking national, not racing it.
- At projected returns (5.6% appreciation + 3.0% rent growth), your $69k cash investment doubles in ~4 years — after that, you're playing with house money.
- By year 3, paydown + projected appreciation supports a ~$38k cash-out refi (75% LTV) — recoverable capital for the next deal without selling this one.
Negotiation context
- It's been on market 18 days — a 2% lower offer ($241k) is reasonable based on typical stale-listing flexibility.
- Current owner paid $40k; list at $245k implies a 512% gain — meaningful room to come down on a strong offer.
Questions for the listing agent
- Can we see the unit-by-unit rent roll, current vacancy, and any below-market leases? What's the average tenancy length?
- What capital expenditures (roof, boiler, parking lot, exteriors) have been made in the last 5 years, and what's planned in the next 2?
- Is there a deadline driving the sale (1031 exchange, divorce, estate, relocation)? That informs how much negotiation room exists.
- Schools are F-rated, which usually means shorter tenancies and higher turnover. Who's the typical renter profile here, and what's been the actual vacancy rate?
- What's the average days-on-market for RENTAL listings here right now (not sales)? A rising rental-DOM trend means longer vacancies and softer asking-rent achievability than the comps imply.
- What's the recent tenant-quality profile in this submarket — average credit score on applications, eviction rate, late-payment / NSF rate, and stable-employment percentage? A property-management company in the area should have these aggregated.
- How much new apartment / multifamily construction is in the pipeline within 1–3 miles? Heavy new supply (>2% of stock underway) typically softens rents 12–24 months out; light construction supports rent growth.
Investment metrics
- 1% rule
- 0.86% ✗
- Cap rate
- 7.04%
- Cash-on-cash
- 2.68%
- DSCR
- 1.12
- GRM
- 9.7
CMA / ARV
- ARV (median comp)
- $130,765
- List price
- $245,000
- Delta
- 87.36%
- Verdict
- OVERPRICED
- Comps
- 12 within 1.0 mi
Show comp detail 3 sales within ~0.75 mi
| Address | Dist | Beds/Ba | Sqft | Sold | Price | $/sf | Match |
|---|---|---|---|---|---|---|---|
| 51 Newport St | 0.23mi | 5/2.0 (+1) | 1,822 (-4%) | 1mo | $65,000 | $36 | 74 |
| 72 74 Ridge St | 0.49mi | 4/2.0 | 1,914 (+1%) | 20mo | $105,000 | $55 | 54 |
| 76 78 Coal St | 0.43mi | 4/2.0 | 2,140 (+13%) | 21mo | $75,000 | $35 | 36 |
Match score weights: distance 35% · size 25% · config 20% · recency 20%. Top-matched comps best support the ARV.
Projected returns pro-forma
5.58% appreciation · 3.0% rent growth · sell at horizon
- IRR
- 16.5%
- Equity multiple
- 2.08×
- Total profit
- $74,339
- Equity at exit
- $147,555
- IRR
- 16.6%
- Equity multiple
- 4.10×
- Total profit
- $212,628
- Equity at exit
- $262,178
Cash invested: $68,600 (down + closing). Projections, not guarantees.
Landlord ↔ Tenant lean methodology
- Overall (STATE)
- 62 Landlord-Friendly
- State Pennsylvania
- 62 Landlord-Friendly · EVEN
- County
- — inherits STATE
- City
- — inherits STATE
ZIP-level market 18617
- Home prices YoY
- 2.0%
- Active inventory
- 20
- Price-to-rent
- 19.6×
Monthly cashflow live
- Estimated rent
- $2,108 medium interval (Pro) →
- Mortgage (P&I)
- −$1,285
- Tax from tax record
- −$125 /mo · $1,503/yr
- Insurance
- −$102
- HOA
- −$0
- Vacancy / Maint / Mgmt
- −$443
- Net cashflow
- $153
Break-even live
Sensitivity live
| Price | -10% $292 | -5% $223 | +0% $153 | +5% $84 | +10% $14 |
|---|---|---|---|---|---|
| Rent | -10% $-13 | -5% $70 | +0% $153 | +5% $236 | +10% $320 |
| Rate | -1.0pp $277 | -0.5pp $215 | base $153 | +0.5pp $90 | +1.0pp $25 |
2-unit breakdown (identical units grouped — click to expand)
| Units | Beds | Baths | Est. rent |
|---|---|---|---|
| 1× unit | 2.0 | 1.5 | $1,043 |
| 1× unit | 3.0 | 1.5 | $1,066 |
| Total (2 units) | $2,108 | ||
UW: 25.0% down · 7.5% · 30yr · 1.5% tax · 5.0% vac · 8.0% maint · 8.0% mgmt
Financing live
Cash to close
- Down payment
- $61,250
- Closing costs
- $7,350
- Reserves months
- —
- Total cash needed
- —
Loan-product check · same deal, 3 products live
Conventional
25% down · 7.5% · 30yr
- Down + closing
- —
- Monthly P&I
- —
- Monthly cashflow
- —
- DSCR
- —
- Eligible?
- —
Personal DTI + credit; lowest rate.
DSCR
20% down · 8.5% · 30yr
- Down + closing
- —
- Monthly P&I
- —
- Monthly cashflow
- —
- DSCR
- —
- Eligible?
- —
No personal income docs; deal must DSCR.
Hard money
10% down · 12.0% · 12mo
- Down + closing
- —
- Monthly P&I
- —
- Monthly cashflow
- —
- DSCR
- —
- Eligible?
- —
Short-term bridge; refi at stabilization.
Rent comps 3 comps
| Address | Beds | Baths | Sqft | Rent | $/sqft | DOM | Units | Dist |
|---|---|---|---|---|---|---|---|---|
| 17 W Main St Glen Lyon, PA | 4.0 | 1.0 | 2000 | $1,650 | $0.82 | 15d | 1 | 0.23mi |
| 34 Arch St Glen Lyon, PA | 3.0 | 2.0 | 1600 | $1,250 | $0.78 | 15d | 1 | 0.44mi |
| 34 Arch St Unit 1 Glen Lyon, PA | 3.0 | 2.0 | 1600 | $1,250 | $0.78 | 46d | 1 | 0.44mi |
Listing history 2 events
-
2026-05-01$245,000 Active 623-char remark
-
2025-04-02soldstatus $40,000
ⓘ Source: listings_history table (triggers on properties + properties_extension) + one-shot
backfill from property_details.listing_events for pre-trigger history.
Tax reassessment forecast PA · Partial reset (capped growth)
- Current annual tax
- $1,503 · $125/mo
- Projected year-2 tax
- $2,687 · $224/mo
- Expected delta
- +$1,184/yr (+$99/mo · 78.8%)
ⓘ Screening estimate from a state-policy table — verify with the county assessor before closing.
Climate risk First Street
- Flood 1/10 Low FEMA zone X (unshaded) · 0% chance over 30 yrs
- Wildfire 4/10 Moderate
- Heat 4/10 Moderate 8 d/yr ≥94°F today · 17 d/yr by 30 yrs out
- Wind 3/10 Moderate 4% chance of damaging wind over 30 yrs
- Air quality 2/10 Low 1 unhealthy d/yr today · 2 by 30 yrs out
Nearby sold comps map
Loading sold comps map…
Walkable amenities ~0.75 mi
Loading nearby amenities…
Taxation est. · year 1
- Rental income
- $25,296
- − Mortgage interest
- −$13,724
- − Property taxes
- −$1,503
- − Insurance
- −$1,225
- − Repairs & maintenance
- −$2,024
- − Management
- −$2,024
- − Depreciation
- −$7,127
- Taxable loss
- −$2,331
- Est. tax savings @ 24.0%
- +$559
- After-tax cash flow
- $2,397/yr
For passive investors: Depreciation is non-cash, so a rental often shows a tax loss while cash-flowing — sheltering income. Rental losses are passive: they offset passive income freely, and up to $25,000/yr can offset ordinary (W-2) income if you actively participate and your MAGI is under $100k (phasing out to $0 by $150k); unused losses carry forward. On sale, claimed depreciation is recaptured at up to 25%, and gains may owe capital-gains tax (a 1031 exchange can defer both). Figures are a year-1 estimate at your 24.0% rate — not tax advice; consult a CPA.
Schools (NCES district)
- District
- Greater Nanticoke Area SD
- NCES district ID
- 4216290
- Math proficiency
- 14% ▼ -8.00%
- Reading proficiency
- 34% ▼ -14.00%
- Median HH income
- $38,990
- Composite
- 20.1/100
- National rank
- #8647
- State rank
- #479 of 539 in PA
Livability — Glen Lyon
- Score
- 61/100
- State rank
- #1432
- US rank
- #18270
Category grades
Schools grade is shown separately in the Schools card above.
Census & demographics
- Census place
- Glen Lyon, PA
- City population
- 1,616
- Population (ZIP)
- 1,616
Population outlook (Luzerne County) Hauer SSP2
- Today (2025)
- 319,505 people
- By 2030
- 319,943 · +0.1%
- By 2040
- 322,643 · +1.0%
- By 2050
- 330,817 · +3.5%
- By 2075
- 379,145 · +18.7%
- By 2100
- 431,908 · +35.2%
Race, ethnicity, and origin ACS 2023
- Neighborhood character
- Predominantly White (81%)
- Race & ethnicity
- White 81% Two or more races 10% Black 6% Asian 3% Hispanic / Latino 1%
- Common ancestry
- Romanian 45% Scotch-Irish 6% Iranian 1%
- Foreign-born
- 1% · Canada
- Languages at home
- 98% English-only · Other Indo-European 1% Spanish 1%
Political lean MEDSL · Luzerne
- 2024 margin
- R (+19.2) · D 40.0% · R 59.2%
- 2008→2024 swing
- -27.6pp toward R · 2008: 8.4pp · 2024: -19.2pp
- All cycles
- 2024: R+19.2 2020: R+14.4 2016: R+19.6 2012: D+4.8 2008: D+8.4
Not yet ingested
- Civics
- —
Market trends
- HPI YoY
- ▲ 5.58%
- Current HPI
- 278.0674
- Rent YoY
- —
- Metro
- —
- State GDP YoY
- ▲ 1.68%
- F500 in state
- 34
Industry mix (Fortune 500 HQ in PA)
| Industry | F500 HQs | Revenue |
|---|---|---|
| Healthcare | 2 | $309B |
|
||
| Insurance | 2 | $27B |
|
||
| Telecommunications / Media | 1 | $124B |
|
||
| Industrial Distribution | 1 | $22B |
|
||
| Financial Services | 1 | $20B |
|
||
| Chemicals / Materials | 1 | $18B |
|
||
Price history
+512.5% since first listed3 events — show timeline
- 2026-05-19 Pending — GSBR as distributed by MLS GRID
- 2026-05-01 Listed $245,000 GSBR as distributed by MLS GRID
- 2025-04-02 Sold (Public Records) $40,000 Public Records
Property tax history
+3.1%/yrLatest (2026): $1,503 · +9.9% YoY. Source: county tax records.
Cash-flow waterfall
monthlySold comps — $/sqft
last 12 mo · ≤1 miLoading sold comps…