49 Meadowview Dr · Centre, PA
Flood risk 1/10 · Minimal
- FEMA flood zone
- X (unshaded)
- Chance of flooding over 30 yrs
- 0.0%
- Est. flood insurance / yr
- $507 – $1,088
Fire risk 3/10 · Minor
- Est. fire insurance / yr
- $511 – $949
Heat risk 4/10 · Minor
- Hot days now (above 99°F)
- 7 days/yr
- Hot days in 30 yrs
- 16 days/yr
Wind risk 2/10 · Minimal
- Chance of severe wind over 30 yrs
- 3.0%
Air-quality risk 2/10 · Minimal
- Unhealthy air days now
- 1 days/yr
- Unhealthy air days in 30 yrs
- 1 days/yr
Risk factors via First Street. Map © Google.
Why this score? — see what drove the B- grade
The composite is a weighted blend of 9 inputs, each scored 0–100. Each bar is that input's sub-score; the figure is the points it added to the 100-point composite (weight × sub-score).
- Cash flow +30.0/30.0
- 1% rule +10.0/10.0
- DSCR +10.0/10.0
- ARV discount +7.5/15.0
- Schools +4.2/10.0
- Rent growth +2.5/5.0
- Livability +2.5/5.0
- Condition / age +2.5/5.0
- Appreciation +0.0/10.0
$90,000
🖨 Deal sheet 📄 Offer letter ✓ Due diligence
Listing remarks
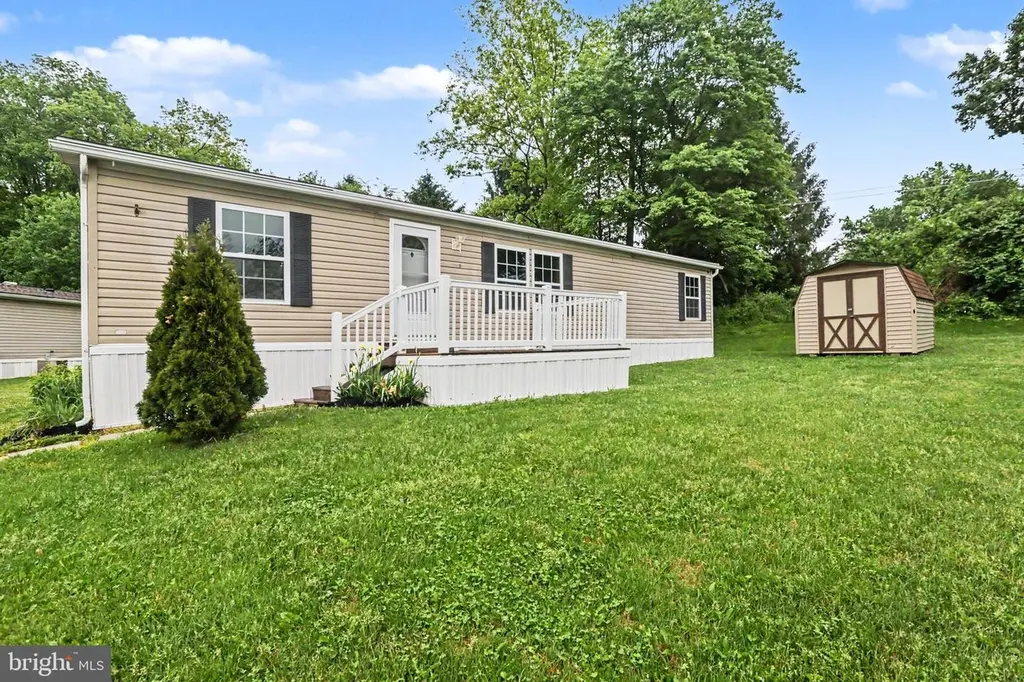
Some homes just feel easy to settle into—and 49 Meadowview Dr has that kind of quiet, comfortable charm. This 1998 Stone mobile home sits in a peaceful New Bloomfield setting with mature trees, a spacious yard, and a rear deck that gives you a perfect place to slow down and enjoy the view. Inside, the home offers a practical and welcoming layout with an open living area, large windows, warm wood-tone trim, and a cozy fireplace that anchors the main living space. The kitchen provides plenty of cabinet storage, included appliances, and convenient access to the laundry/utility area and rear entrance. Outside, you’ll appreciate the off-street parking, storage shed, and yard space th
Key facts
- Spacious yard
- Large windows
- Open living area
Tags
Property features AI
Finance
- Other: Listing indicates ground rent income/expense applies
- Financial info: Monthly ground rent $450; Annual tax information available
Exterior
- Parking: Driveway parking (3 spaces); Total of 3 garage and parking spaces
- Utilities: Community water; Private sewer
- Home design: Manufactured property; Modular/Manufactured construction; Manufactured/Stone make; Effective renovation year 2026
- Construction: Above-grade living area; Finished above-grade area approximately 1,568
- Exterior features: Not in a federal flood zone; Ground rent applies (monthly payment)
Interior
- Bedrooms: Three bedrooms on the main level
- Bathrooms: Two full bathrooms on the main level
- Heating & cooling: 90% forced air heating; Propane (leased) heating fuel; Central air conditioning (electric); Electric hot water
- Interior features: Estimated living area; One fireplace
Neighborhood map
What this means for you Summary
Snapshot
- This is a 3-bed/2.0-bath manufactured listed at $90k.
Deal economics
- At list price, monthly cash flow is $954 ($11k/yr) — positive.
- The deal already cash-flows at list — no discount required.
- Meets the 1% rule at list price ($2k rent vs $90k).
- Recommended offer: $89k (1.5% below list) — sets the bar for market timing.
Location & tenants
- Location reads: area grade B — affects rentability + tenant quality, not the cash-flow math above.
- West Perry SD (rural): math 37% / reading 60% proficiency, ranked #189 of 539 in PA (top 35%) — families likely to look elsewhere, expect single-tenant / working-renter base with shorter leases.
- Zoned schools: Carroll El Sch (math 37% / reading 57%, grade D-, #737 of 1,518 statewide, top 52%, 331 students, 46% FRL); West Perry Ms (math 23% / reading 61%, grade D-, #221 of 512 statewide, top 45%, 496 students, 52% FRL); West Perry Shs (math 72% / reading 87%, grade A-, #19 of 437 statewide, top 4%, 686 students, 38% FRL).
- Market conditions: 19 active listings in the ZIP; 107 units permitted in Perry County in 2024 (0 in 5+ unit buildings).
Forward outlook
- Local home prices are declining (-3.0%/yr); year-one equity from $622 of loan paydown is wiped out by about $3k of value loss. Plan a longer hold.
- Perry County population projected at -19% by 2050 — secular population decline; favor cash flow + early exit over multi-decade hold.
- At projected returns (-3.0% appreciation + 3.0% rent growth), your $25k cash investment doubles in ~3 years — after that, you're playing with house money.
Negotiation context
- It's been on market 23 days — a 2% lower offer ($89k) is reasonable based on typical stale-listing flexibility.
Questions for the listing agent
- Is there a deadline driving the sale (1031 exchange, divorce, estate, relocation)? That informs how much negotiation room exists.
- What's the average days-on-market for RENTAL listings here right now (not sales)? A rising rental-DOM trend means longer vacancies and softer asking-rent achievability than the comps imply.
- What's the recent tenant-quality profile in this submarket — average credit score on applications, eviction rate, late-payment / NSF rate, and stable-employment percentage? A property-management company in the area should have these aggregated.
- How much new for-sale + rental construction is in the pipeline within 1–3 miles? Heavy new supply typically softens prices + rents 12–24 months out; constrained supply supports both.
Investment metrics
- 1% rule
- 2.16% ✓
- Cap rate
- 19.01%
- Cash-on-cash
- 45.41%
- DSCR
- 3.02
- GRM
- 3.9
CMA / ARV
No comps found within radius.
Projected returns pro-forma
-3.0% appreciation · 3.0% rent growth · sell at horizon
- IRR
- 42.5%
- Equity multiple
- 2.83×
- Total profit
- $46,159
- Equity at exit
- $13,419
- IRR
- 48.6%
- Equity multiple
- 5.70×
- Total profit
- $118,430
- Equity at exit
- $7,782
Cash invested: $25,200 (down + closing). Projections, not guarantees.
Landlord ↔ Tenant lean methodology
- Overall (STATE)
- 62 Landlord-Friendly
- State Pennsylvania
- 62 Landlord-Friendly · EVEN
- County
- — inherits STATE
- City
- — inherits STATE
ZIP-level market 17068
- Home prices YoY
- -14.6%
- Active inventory
- 19
- Price-to-rent
- 3.9×
Monthly cashflow live
- Estimated rent
- $1,948 medium interval (Pro) →
- Mortgage (P&I)
- −$472
- Tax from tax record
- −$75 /mo · $906/yr
- Insurance
- −$38
- HOA
- −$0
- Vacancy / Maint / Mgmt
- −$409
- Net cashflow
- $954
Break-even live
UW: 25.0% down · 7.5% · 30yr · 1.5% tax · 5.0% vac · 8.0% maint · 8.0% mgmt
Financing live
Cash to close
- Down payment
- $22,500
- Closing costs
- $2,700
- Reserves months
- —
- Total cash needed
- —
Loan-product check · same deal, 3 products live
Conventional
25% down · 7.5% · 30yr
- Down + closing
- —
- Monthly P&I
- —
- Monthly cashflow
- —
- DSCR
- —
- Eligible?
- —
Personal DTI + credit; lowest rate.
DSCR
20% down · 8.5% · 30yr
- Down + closing
- —
- Monthly P&I
- —
- Monthly cashflow
- —
- DSCR
- —
- Eligible?
- —
No personal income docs; deal must DSCR.
Hard money
10% down · 12.0% · 12mo
- Down + closing
- —
- Monthly P&I
- —
- Monthly cashflow
- —
- DSCR
- —
- Eligible?
- —
Short-term bridge; refi at stabilization.
Listing history 16 events
-
2026-06-18days on market $90,000 Active 23 DOM
-
2026-06-17days on market $90,000 Active 22 DOM
-
2026-06-16days on market $90,000 Active 21 DOM
-
2026-06-15days on market $90,000 Active 20 DOM
-
2026-06-14days on market $90,000 Active 18 DOM
-
2026-06-13days on market $90,000 Active 17 DOM
-
2026-06-10days on market $90,000 Active 15 DOM
-
2026-06-09days on market $90,000 Active 14 DOM
-
2026-06-08days on market $90,000 Active 13 DOM
-
2026-06-07days on market $90,000 Active 12 DOM
-
2026-06-03days on market $90,000 Active 8 DOM
-
2026-06-02days on market $90,000 Active 7 DOM
-
2026-06-01days on market $90,000 Active 6 DOM
-
2026-05-31days on market $90,000 Active 5 DOM
-
2026-05-31days on market $90,000 Active 4 DOM
-
2026-05-26$90,000 Active
ⓘ Source: listings_history table (triggers on properties + properties_extension) + one-shot
backfill from property_details.listing_events for pre-trigger history.
Tax reassessment forecast PA · Partial reset (capped growth)
- Current annual tax
- $906 · $75/mo
- Projected year-2 tax
- $1,164 · $97/mo
- Expected delta
- +$258/yr (+$22/mo · 28.5%)
ⓘ Screening estimate from a state-policy table — verify with the county assessor before closing.
Climate risk First Street
- Flood 1/10 Low FEMA zone X (unshaded) · 0% chance over 30 yrs
- Wildfire 3/10 Moderate
- Heat 4/10 Moderate 7 d/yr ≥99°F today · 16 d/yr by 30 yrs out
- Wind 2/10 Low 3% chance of damaging wind over 30 yrs
- Air quality 2/10 Low 1 unhealthy d/yr today · 1 by 30 yrs out
Nearby sold comps map
Loading sold comps map…
Walkable amenities ~0.75 mi
Loading nearby amenities…
Taxation est. · year 1
- Rental income
- $23,370
- − Mortgage interest
- −$5,041
- − Property taxes
- −$906
- − Insurance
- −$450
- − Repairs & maintenance
- −$1,870
- − Management
- −$1,870
- − Depreciation
- −$2,618
- Taxable income
- $10,616
- Est. tax owed @ 24.0%
- −$2,548
- After-tax cash flow
- $8,896/yr
For passive investors: Depreciation is non-cash, so a rental often shows a tax loss while cash-flowing — sheltering income. Rental losses are passive: they offset passive income freely, and up to $25,000/yr can offset ordinary (W-2) income if you actively participate and your MAGI is under $100k (phasing out to $0 by $150k); unused losses carry forward. On sale, claimed depreciation is recaptured at up to 25%, and gains may owe capital-gains tax (a 1031 exchange can defer both). Figures are a year-1 estimate at your 24.0% rate — not tax advice; consult a CPA.
Schools (NCES district)
- District
- West Perry SD
- NCES district ID
- 4225740
- Math proficiency
- 37% ▼ -6.00%
- Reading proficiency
- 60% ▼ -1.00%
- Median HH income
- $55,647
- Composite
- 41.99/100
- National rank
- #3338
- State rank
- #189 of 539 in PA
Livability — Centre
No livability data for this city. (Only ~50 U.S. cities are tracked.)
Census & demographics
- Population (ZIP)
- 4,384
Population outlook (Perry County) Hauer SSP2
- Today (2025)
- 44,250 people
- By 2030
- 42,862 · -3.1%
- By 2040
- 39,574 · -10.6%
- By 2050
- 36,001 · -18.6%
- By 2075
- 27,991 · -36.7%
- By 2100
- 20,936 · -52.7%
Race, ethnicity, and origin ACS 2023
- Neighborhood character
- Predominantly White (90%)
- Race & ethnicity
- White 90% Two or more races 7% Hispanic / Latino 3% Black 1%
- Common ancestry
- Polish 5% Romanian 3% Iranian 3%
- Foreign-born
- 1% · Canada
- Languages at home
- 96% English-only · Spanish 2% German/W. Germanic 1%
Political lean MEDSL · Perry
- 2024 margin
- Solid R (+49.3) · D 24.8% · R 74.1% · Other 1.0%
- 2008→2024 swing
- -15.6pp toward R · 2008: -33.7pp · 2024: -49.3pp
- All cycles
- 2024: R+49.3 2020: R+50.1 2016: R+51.9 2012: R+38.8 2008: R+33.7
Not yet ingested
- Civics
- —
Market trends
- HPI YoY
- ▼ -27.07%
- Current HPI
- 157.819
- Rent YoY
- —
- Metro
- —
- State GDP YoY
- ▲ 1.68%
- F500 in state
- 34
Industry mix (Fortune 500 HQ in PA)
| Industry | F500 HQs | Revenue |
|---|---|---|
| Healthcare | 2 | $309B |
|
||
| Insurance | 2 | $27B |
|
||
| Telecommunications / Media | 1 | $124B |
|
||
| Industrial Distribution | 1 | $22B |
|
||
| Financial Services | 1 | $20B |
|
||
| Chemicals / Materials | 1 | $18B |
|
||
Price history
1 event — show timeline
- 2026-05-26 Listed $90,000 BRIGHT MLS
Property tax history
+2.0%/yrLatest (2026): $906 · -8.9% YoY. Source: county tax records.
Cash-flow waterfall
monthlySold comps — $/sqft
last 12 mo · ≤1 miLoading sold comps…