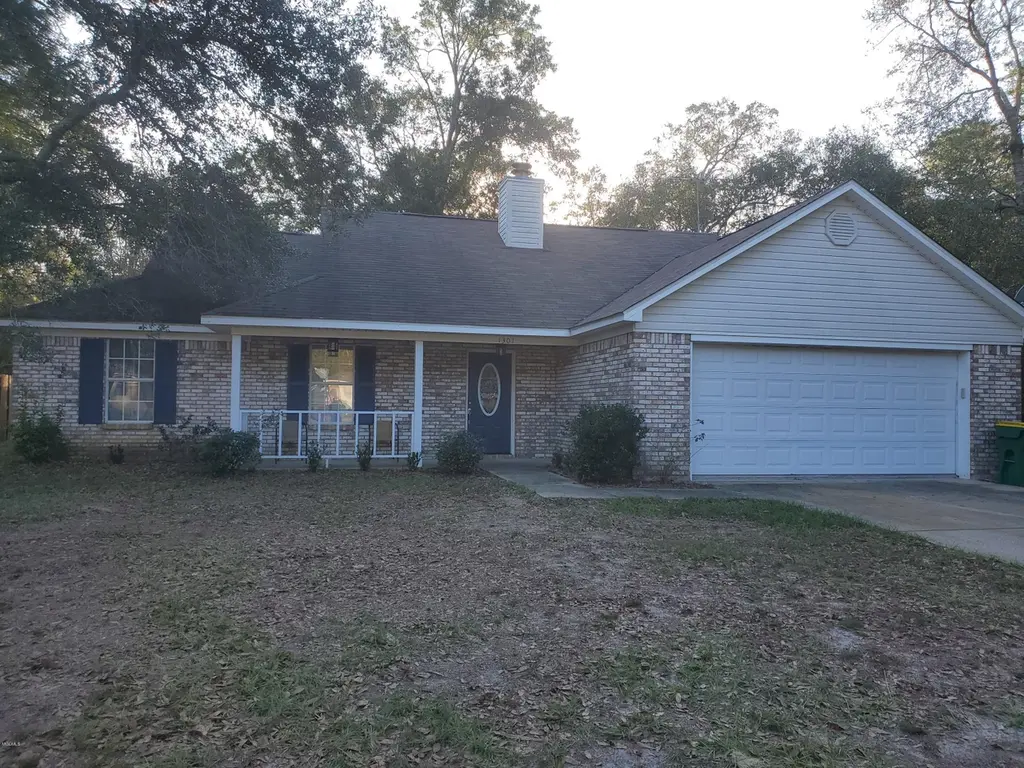
1301 Spruce St · Gautier, MS
Flood risk 7/10 · Major
- FEMA flood zone
- AE
- Chance of flooding over 30 yrs
- 0.9%
- Est. flood insurance / yr
- $1,737 – $8,500
Fire risk 3/10 · Minor
- Est. fire insurance / yr
- $1,241 – $2,305
Heat risk 10/10 · Severe
- Hot days now (above 106°F)
- 7 days/yr
- Hot days in 30 yrs
- 23 days/yr
Wind risk 9/10 · Severe
- Chance of severe wind over 30 yrs
- 99.0%
Air-quality risk 2/10 · Minimal
- Unhealthy air days now
- 1 days/yr
- Unhealthy air days in 30 yrs
- 2 days/yr
Risk factors via First Street. Map © Google.
Why this score? — see what drove the B grade
The composite is a weighted blend of 9 inputs, each scored 0–100. Each bar is that input's sub-score; the figure is the points it added to the 100-point composite (weight × sub-score).
- Cash flow +28.5/30.0
- ARV discount +15.0/15.0
- DSCR +10.0/10.0
- 1% rule +6.9/10.0
- Schools +5.3/10.0
- Livability +3.3/5.0
- Rent growth +2.8/5.0
- Condition / age +2.5/5.0
- Appreciation +0.0/10.0
$155,000
🖨 Deal sheet (PDF) 📄 Offer letter ✓ Due diligence
Listing remarks MLS
Great starter home. This lovely 3 bedroom 2 bath brick home has been updated in 2018. Granite counter tops in kitchen and baths. Close to new high school. Minutes away from downtown Ocean Springs shopping. Great area for someone who loves beaches and boating.
Key facts
- 0.26 acre lot
- 2 garage spots
- Built 1998
Property features AI
Finance
- Other: Property located at 1301 Spruce Street, Ocean Springs, MS
Exterior
- Parking: Attached concrete 2-car garage; Two total parking spaces
- Utilities: Public water; Public sewer; Electricity available; Cable available
- Home design: Single-family house; One level
- Construction: Brick veneer construction; Composition roof; Slab foundation; Built (year per public records)
- Exterior features: Full fencing; See remarks for additional exterior details
Interior
- Kitchen: Electric range; Microwave; Refrigerator
- Bedrooms: Primary bedroom on the main level; Additional bedrooms on the main level
- Flooring: Wood floors
- Bathrooms: Two full bathrooms
- Heating & cooling: Central heating; Central air conditioning
- Interior features: Ceiling fans; Walk-in closets; Fireplace in the living room; Five total rooms
Neighborhood map
What this means for you Summary
Snapshot
- This is a 3-bed/2.0-bath single-family listed at $155k.
Deal economics
- At list price, monthly cash flow is $80 ($960/yr) — positive.
- The deal already cash-flows at list — no discount required.
- Meets the 1% rule at list price ($2k rent vs $155k).
- Cap rate 10.2% vs local median 4.2% in Gautier — top-decile yield for the area; either an underpriced asset or a hidden risk that comps aren't pricing in. Stress-test before assuming the spread holds.
Location & tenants
- Location reads 66/100 on livability (#89 in MS) — a middle-class / working-renter tenant base. Strengths: cost of living A+, housing A+; Watch: health & safety D+, employment D, amenities F.
- Ocean Springs School District (suburban): math 64% / reading 59% proficiency, ranked #1 of 130 in MS (top 1%) — acceptable for families but not a draw, mixed tenant base, ~2y average lease.
- Zoned schools: Pecan Park Elementary School (math 62% / reading 57%, grade B-, #27 of 375 statewide, top 8%, 530 students, 99% FRL); Ocean Springs Middle School (math 66% / reading 61%, grade B+, #3 of 179 statewide, top 2%, 967 students, 100% FRL); Ocean Springs High School (math 77% / reading 64%, grade B+, #1 of 197 statewide, top 0%, 1,899 students, 100% FRL) — zoned schools average 100% FRL vs 33% district-wide (67 pts higher); higher-poverty schools than district average — tighter screening recommended.
- Market conditions: Rents rising (+1.3%/yr); 723 active listings in the ZIP; 5 comparable units currently listed for rent nearby; rentals at typical pace (median 16d on market — plan ~3-4 weeks tenant-placement turnaround); 40% of comp listings sitting > 30 days — soft ceiling on asking rent; solid renter incomes; 516 units permitted in Jackson County in 2024 (6 in 5+ unit buildings).
Forward outlook
- Local home prices are declining (-3.0%/yr); year-one equity from $1k of loan paydown is wiped out by about $5k of value loss. Plan a longer hold.
Negotiation context
- Only 14 days on market — expect competitive offers; lowballing is unlikely to land.
- 3 sale attempts since 10y ago with the ask held roughly flat each time — persistent listings suggest the price (not the market) is what's stuck; bring a comps-based counter.
Risks & watch-outs
- Watch-outs: flood insurance adds $427/mo.
- Climate carrying-cost: in FEMA flood zone AE (mandatory federal flood insurance); severe wind risk, 99% chance of damaging wind over 30y; extreme-heat days projected 7→23/yr by 2055 (HVAC capex compounding) — expect insurance premiums to compound above CPI over the hold.
Questions for the listing agent
- What's the actual annual flood-insurance premium (NFIP or private), and is the property in a SFHA with mandatory coverage?
- Is there a deadline driving the sale (1031 exchange, divorce, estate, relocation)? That informs how much negotiation room exists.
- Schools are D-rated, which usually means shorter tenancies and higher turnover. Who's the typical renter profile here, and what's been the actual vacancy rate?
- What's the average days-on-market for RENTAL listings here right now (not sales)? A rising rental-DOM trend means longer vacancies and softer asking-rent achievability than the comps imply.
- What's the recent tenant-quality profile in this submarket — average credit score on applications, eviction rate, late-payment / NSF rate, and stable-employment percentage? A property-management company in the area should have these aggregated.
- How much new for-sale + rental construction is in the pipeline within 1–3 miles? Heavy new supply typically softens prices + rents 12–24 months out; constrained supply supports both.
Investment metrics
- 1% rule
- 1.19% ✓
- Cap rate
- 10.21%
- Cash-on-cash
- 14.01%
- DSCR
- 1.62
- GRM
- 7.0
CMA / ARV
- ARV (on-the-fly)
- $228,483
- Comps found
- 12
Show comp detail 12 sales within ~0.75 mi
| Address | Dist | Beds/Ba | Sqft | Sold | Price | $/sf | Match |
|---|---|---|---|---|---|---|---|
| 1129 Pine St | 0.26mi | 3/2.0 | 1,432 (-0%) | 1mo | $245,000 | $171 | 87 |
| 1321 Willow St | 0.15mi | 3/2.0 | 1,534 (+7%) | 9mo | $190,000 | $124 | 74 |
| 1321 Oak St | 0.14mi | 3/2.0 | 1,252 (-13%) | 6mo | $199,000 | $159 | 67 |
| 1116 Oak St | 0.41mi | 3/2.0 | 1,560 (+9%) | 5mo | $244,900 | $157 | 62 |
| 1812 Burnt Oak Dr | 0.72mi | 3/2.0 | 1,435 (-0%) | 10mo | $199,900 | $139 | 58 |
| 1508 Brown St | 0.29mi | 2/2.0 (-1) | 1,295 (-10%) | 8mo | $199,900 | $154 | 58 |
| 797 Peach St | 0.71mi | 2/2.0 (-1) | 1,414 (-2%) | 2mo | $289,000 | $204 | 58 |
| 1026 Ash St | 0.59mi | 3/2.0 | 1,540 (+7%) | 6mo | $207,500 | $135 | 55 |
| 6929 Red Bud Ln | 0.69mi | 4/2.0 (+1) | 1,416 (-2%) | 8mo | $189,900 | $134 | 54 |
| 716 Plum St | 0.73mi | 3/2.0 | 1,335 (-7%) | 8mo | $229,000 | $172 | 48 |
| 74 Tantallon Dr | 0.55mi | 3/2.0 | 1,625 (+13%) | 9mo | $269,900 | $166 | 45 |
| 790 Peach St | 0.72mi | 3/2.0 | 1,558 (+8%) | 11mo | $249,999 | $160 | 44 |
Match score weights: distance 35% · size 25% · config 20% · recency 20%. Top-matched comps best support the ARV.
Projected returns pro-forma
-3.0% appreciation · 1.31% rent growth · sell at horizon
- IRR
- -15.1%
- Equity multiple
- 0.47×
- Total profit
- $-22,888
- Equity at exit
- $23,111
- IRR
- -10.3%
- Equity multiple
- 0.43×
- Total profit
- $-24,718
- Equity at exit
- $13,402
Cash invested: $43,400 (down + closing). Projections, not guarantees.
Landlord ↔ Tenant lean methodology
- Overall (STATE)
- 90 Strongly Landlord-Friendly
- State Mississippi
- 90 Strongly Landlord-Friendly · R+11
- County
- — inherits STATE
- City
- — inherits STATE
ZIP-level market 39564
- Home prices YoY
- -26.8%
- Rents YoY
- 1.3%
- Active inventory
- 723
- Price-to-rent
- 7.0×
Monthly cashflow live
- Estimated rent
- $1,843 high interval (Pro) →
- Mortgage (P&I)
- −$813
- Tax from tax record
- −$72 /mo · $860/yr
- Insurance
- −$65
- Flood insurance flood zone
- −$427 /mo · $5,118/yr
- HOA
- −$0
- Vacancy / Maint / Mgmt
- −$387
- Net cashflow
- $80
Break-even live
Sensitivity live
| Price | -10% $168 | -5% $124 | +0% $80 | +5% $36 | +10% $-8 |
|---|---|---|---|---|---|
| Rent | -10% $-66 | -5% $7 | +0% $80 | +5% $153 | +10% $226 |
| Rate | -1.0pp $158 | -0.5pp $119 | base $80 | +0.5pp $40 | +1.0pp $-1 |
UW: 25.0% down · 7.5% · 30yr · 1.5% tax · 5.0% vac · 8.0% maint · 8.0% mgmt
Financing live
Cash to close
- Down payment
- $38,750
- Closing costs
- $4,650
- Reserves months
- —
- Total cash needed
- —
Loan-product check · same deal, 3 products live
Conventional
25% down · 7.5% · 30yr
- Down + closing
- —
- Monthly P&I
- —
- Monthly cashflow
- —
- DSCR
- —
- Eligible?
- —
Personal DTI + credit; lowest rate.
DSCR
20% down · 8.5% · 30yr
- Down + closing
- —
- Monthly P&I
- —
- Monthly cashflow
- —
- DSCR
- —
- Eligible?
- —
No personal income docs; deal must DSCR.
Hard money
10% down · 12.0% · 12mo
- Down + closing
- —
- Monthly P&I
- —
- Monthly cashflow
- —
- DSCR
- —
- Eligible?
- —
Short-term bridge; refi at stabilization.
Rent comps 5 comps
| Address | Beds | Baths | Sqft | Rent | $/sqft | DOM | Units | Dist |
|---|---|---|---|---|---|---|---|---|
| 1105 Spruce St Ocean Springs, MS | 3.0 | 2.0 | 1130 | $1,550 | $1.37 | 15d | 1 | 0.23mi |
| 1608 Hunt St Ocean Springs, MS | 3.0 | 2.0 | 1550 | $1,700 | $1.10 | 45d | 1 | 0.33mi |
| 413 Sturnidae Cv Ocean Springs, MS | 3.0 | 2.0 | 1676 | $1,900 | $1.13 | 46d | 1 | 0.76mi |
| 8001 Westwood Cir Ocean Springs, MS | 3.0–5.0 | 2.0–3.0 | 1996 | $2,000 | $1.00 | 15d | 1 | 1.38mi |
| 1632 Emerald Lakes Dr Ocean Springs, MS | 3.0–4.0 | 2.0 | 1585 | $1,975 | $1.25 | 15d | 1 | 1.38mi |
Listing history 7 events
-
2026-04-16status Pending
-
2026-04-02$155,000 Active
-
2021-03-31soldstatus
-
2021-02-26soldstatus 262-char remark
Show marketing remark (262 chars)
Great starter home. This lovely 3 bedroom 2 bath brick home has been updated in 2018. Granite counter tops in kitchen and baths. Close to new high school. Minutes away from downtown Ocean Springs shopping. Great area for someone who loves beaches and boating.
-
2020-12-05$140,000 262-char remark
Show marketing remark (262 chars)
Great starter home. This lovely 3 bedroom 2 bath brick home has been updated in 2018. Granite counter tops in kitchen and baths. Close to new high school. Minutes away from downtown Ocean Springs shopping. Great area for someone who loves beaches and boating.
-
2017-09-27soldstatus 182-char remark
Show marketing remark (182 chars)
Great beginnings start here! This lovely 3 bedroom, 2 bath home has 1,437 square feet of space, beautiful new floors and new cabinets. Seller is looking at all offers so bring yours.
-
2016-11-26$114,900 182-char remark
Show marketing remark (182 chars)
Great beginnings start here! This lovely 3 bedroom, 2 bath home has 1,437 square feet of space, beautiful new floors and new cabinets. Seller is looking at all offers so bring yours.
ⓘ Source: listings_history table (triggers on properties + properties_extension) + one-shot
backfill from property_details.listing_events for pre-trigger history.
Tax reassessment forecast MS · Resets to sale price
- Current annual tax
- $860 · $72/mo
- Projected year-2 tax
- $1,225 · $102/mo
- Expected delta
- +$365/yr (+$30/mo · 42.4%)
ⓘ Screening estimate from a state-policy table — verify with the county assessor before closing.
Climate risk First Street
- Flood 7/10 Severe FEMA zone AE · 90% chance over 30 yrs
- Wildfire 3/10 Moderate
- Heat 10/10 Extreme 7 d/yr ≥106°F today · 23 d/yr by 30 yrs out
- Wind 9/10 Extreme 99% chance of damaging wind over 30 yrs
- Air quality 2/10 Low 1 unhealthy d/yr today · 2 by 30 yrs out
Nearby sold comps map
Loading sold comps map…
Walkable amenities ~0.75 mi
Loading nearby amenities…
Taxation est. · year 1
- Rental income
- $22,110
- − Mortgage interest
- −$8,682
- − Property taxes
- −$860
- − Insurance
- −$5,894
- − Repairs & maintenance
- −$1,769
- − Management
- −$1,769
- − Depreciation
- −$4,509
- Taxable loss
- −$1,372
- Est. tax savings @ 24.0%
- +$329
- After-tax cash flow
- $1,289/yr
For passive investors: Depreciation is non-cash, so a rental often shows a tax loss while cash-flowing — sheltering income. Rental losses are passive: they offset passive income freely, and up to $25,000/yr can offset ordinary (W-2) income if you actively participate and your MAGI is under $100k (phasing out to $0 by $150k); unused losses carry forward. On sale, claimed depreciation is recaptured at up to 25%, and gains may owe capital-gains tax (a 1031 exchange can defer both). Figures are a year-1 estimate at your 24.0% rate — not tax advice; consult a CPA.
Schools (NCES district)
- District
- Ocean Springs School District
- NCES district ID
- 2803360
- Math proficiency
- 64% ▼ -3.00%
- Reading proficiency
- 59% ▲ 1.00%
- Median HH income
- $60,485
- Composite
- 53.35/100
- National rank
- #1477
- State rank
- #1 of 130 in MS
Livability — Gautier
- Score
- 66/100
- State rank
- #89
- US rank
- #11250
Category grades
Schools grade is shown separately in the Schools card above.
Census & demographics
- County
- Jackson County · 82,196 people
- City population
- 17,225
- Metro
- Gulfport-Biloxi, MS
- Population (ZIP)
- 43,240
- Household income
- $78,596
- Rent vs Own
- Severe rent burden
- 734.0
Population outlook (Jackson County) Hauer SSP2
- Today (2025)
- 146,926 people
- By 2030
- 148,442 · +1.0%
- By 2040
- 149,631 · +1.8%
- By 2050
- 148,723 · +1.2%
- By 2075
- 147,845 · +0.6%
- By 2100
- 144,510 · -1.6%
Race, ethnicity, and origin ACS 2023
- Neighborhood character
- Predominantly White (74%)
- Race & ethnicity
- White 74% Black 10% Hispanic / Latino 8% Two or more races 7% Asian 4%
- Hispanic origin (detail)
- Mexican 3% Puerto Rican 2%
- Common ancestry
- Lithuanian 5% Slovak 4% Romanian 2%
- Foreign-born
- 5% · Canada, South Korea, Vietnam
- Languages at home
- 93% English-only · Spanish 3% Vietnamese 2% Tagalog/Filipino 1%
Political lean MEDSL · Jackson
- 2024 margin
- Solid R (+39.9) · D 29.5% · R 69.4% · Other 1.1%
- 2008→2024 swing
- -6.4pp toward R · 2008: -33.5pp · 2024: -39.9pp
- All cycles
- 2024: R+39.9 2020: R+34.6 2016: R+39.9 2012: R+36.1 2008: R+33.5
Not yet ingested
- Civics
- —
Market trends
- HPI YoY
- ▼ -74.77%
- Current HPI
- 204.2244
- Rent YoY
- ▲ 1.31%
- Metro
- Gulfport-Biloxi, MS
- State GDP YoY
- —
- F500 in state
- 0
Price history
+34.9% since first listed7 events — show timeline
- 2026-04-16 Pending — MLSU
- 2026-04-02 Listed $155,000 MLSU
- 2021-03-31 Sold (Public Records) — Public Records
- 2021-02-26 Sold (MLS) — MLSU
- 2020-12-05 Listed $140,000 MLSU
- 2017-09-27 Sold (MLS) — MLSU
- 2016-11-26 Listed $114,900 MLSU
Property tax history
-3.9%/yrLatest (2024): $860 · -51.1% YoY. Source: county tax records.
Cash-flow waterfall
monthlySold comps — $/sqft
last 12 mo · ≤1 miLoading sold comps…