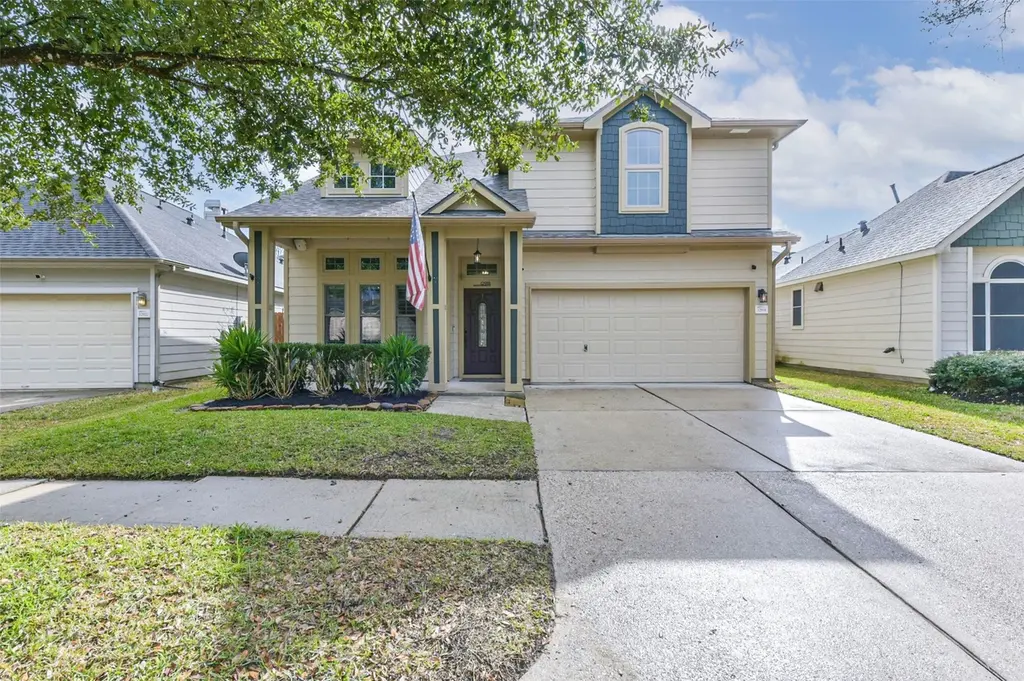
12918 Redbud Shores Ln · Houston, TX
Flood risk 1/10 · Minimal
- FEMA flood zone
- X (unshaded)
- Chance of flooding over 30 yrs
- 0.0%
- Est. flood insurance / yr
- $507 – $1,088
Fire risk 1/10 · Minimal
- Est. fire insurance / yr
- $1,222 – $2,270
Heat risk 9/10 · Severe
- Hot days now (above 111°F)
- 7 days/yr
- Hot days in 30 yrs
- 24 days/yr
Wind risk 9/10 · Severe
- Chance of severe wind over 30 yrs
- 99.0%
Air-quality risk 3/10 · Minor
- Unhealthy air days now
- 3 days/yr
- Unhealthy air days in 30 yrs
- 3 days/yr
Risk factors via First Street. Map © Google.
Why this score? — see what drove the D- grade
The composite is a weighted blend of 9 inputs, each scored 0–100. Each bar is that input's sub-score; the figure is the points it added to the 100-point composite (weight × sub-score).
- Cash flow +13.1/30.0
- 1% rule +4.7/10.0
- Appreciation +4.2/10.0
- DSCR +3.9/10.0
- Schools +3.9/10.0
- Livability +3.7/5.0
- Rent growth +2.7/5.0
- Condition / age +2.5/5.0
- ARV discount +0.3/15.0
$329,000
🖨 Deal sheet (PDF) 📄 Offer letter ✓ Due diligence
Listing remarks
Welcome to the "Upgrades-Only" house! A meticulous 4-bedroom home with a HOME OFFICE, formal dining, and upstairs GAME ROOM, delivering turnkey living experience designed for today’s discerning buyer. Ideally located near Beltway 8 & minutes from the new 234-acre Lilly Manufacturing campus under development in Generation Park! High end flooring—no carpet anywhere—paired with custom millwork, PLANTATION SHUTTERS, and automated ELECTRIC SHADES. The chef-inspired kitchen features CUSTOM CABINETRY with specialty storage, a five-burner GAS RANGE w/ DOUBLE OVENS, built-in ICE MACHINE, R. O. system, & a smart LG refrigerator that conveys. The primary suite of
Key facts
- Custom cabinetry
- Plantation shutters
- Electric shades
Tags
Property features AI
Finance
- HOA & community: Community association (Crest Management Association); Annual association fee; Association amenities: clubhouse, fitness center, park, pool, trails; Association fee covers clubhouse, common areas, and recreation facilities; Community features include community pool, curbs, and gutters
Exterior
- Parking: Attached garage with 2 spaces; Driveway; Garage door opener
- Security: Prewired for security; Smoke detectors
- Utilities: Public water; Public sewer
- Home design: Residential property; Slab foundation; Composition roof; Built in 2006
- Construction: Brick construction
- Exterior features: Deck; Patio; Fence (back yard); Tennis court(s); Subdivision setting; Concrete road access
Interior
- Kitchen: Dishwasher; Gas cooktop; Gas oven; Disposal; Ice maker; Microwave; Refrigerator; Granite counters; Breakfast bar; Pantry
- Bedrooms: Total rooms: 9
- Flooring: Bamboo; Carpet; Tile; Wood
- Bathrooms: 2 full bathrooms; 1 half bathroom
- Heating & cooling: Central heating (gas); Central electric air conditioning; Has heating and cooling
- Interior features: Breakfast bar; Double vanity; Granite counters; Kitchen/family room combo; Primary bedroom with bath; Pots & pan drawers; Pantry; Self-closing cabinet doors and drawers; Soaking tub; Separate shower; Tub/shower combination; Vanity; Ceiling fans; Living/dining room; Programmable thermostat; Reverse osmosis water filtration; Low emissivity windows; ENERGY STAR qualified appliances
- Laundry & utility: Washer hookup; Gas dryer hookup
Neighborhood map
What this means for you Summary
Snapshot
- This is a 4-bed/2.5-bath single-family listed at $329k.
Deal economics
- At list price, monthly cash flow is $-11 ($-138/yr) — negative.
- To cash-flow at today's rent, offer at most $327k (0.6% below list).
- To meet the 1% rule (rent ≥ 1% of price), the offer needs to be $321k (2.5% below list).
- Recommended offer: $321k (2.5% below list) — sets the bar for 1% rule.
- Cap rate 6.3% vs local median 3.2% in Houston — top-decile yield for the area; either an underpriced asset or a hidden risk that comps aren't pricing in. Stress-test before assuming the spread holds.
Location & tenants
- Location reads 74/100 on livability (#184 in TX, #4,771 nationally) — a middle-class / working-renter tenant base. Strengths: amenities A+, cost of living A+, housing A+; Watch: crime F.
- Humble ISD (urban): math 38% / reading 44% proficiency, ranked #262 of 826 in TX (top 32%) — families likely to look elsewhere, expect single-tenant / working-renter base with shorter leases.
- Zoned schools: Lakeshore El (math 26% / reading 33%, grade F, #2,525 of 4,322 statewide, top 62%, 862 students, 48% FRL); Woodcreek Middle (math 46% / reading 49%, grade C-, #408 of 1,662 statewide, top 25%, 1,145 students, 36% FRL); Humble H S (math 15% / reading 31%, grade F, #1,348 of 1,632 statewide, top 83%, 2,867 students, 77% FRL) — zoned schools average 54% FRL vs 32% district-wide (22 pts higher); higher-poverty schools than district average — tighter screening recommended.
- Market conditions: Rents flat; 340 active listings in the ZIP; 10 comparable units currently listed for rent nearby; rentals at typical pace (median 26d on market — plan ~3-4 weeks tenant-placement turnaround); solid renter incomes; 29,883 units permitted in Harris County in 2024 (8,621 in 5+ unit buildings).
- This rent runs 41% of the median local income ($95k/yr) — at the standard rent-burdened threshold; future hikes will face affordability resistance.
Forward outlook
- Local home prices are declining (-1.6%/yr); year-one equity from $2k of loan paydown is wiped out by about $5k of value loss. Plan a longer hold.
- Harris County population projected at +47% by 2050 — long-run rental-demand tailwind backs the buy-and-hold thesis.
Negotiation context
- It's been on market 25 days — a 2% lower offer ($324k) is reasonable based on typical stale-listing flexibility.
- 6 sale attempts since 14y ago with the ask held roughly flat each time — persistent listings suggest the price (not the market) is what's stuck; bring a comps-based counter.
Risks & watch-outs
- Climate carrying-cost: severe wind risk, 99% chance of damaging wind over 30y; extreme-heat days projected 7→24/yr by 2055 (HVAC capex compounding) — expect insurance premiums to compound above CPI over the hold.
Questions for the listing agent
- What do current leases actually rent for vs. the listed asking? Can we see a recent rent roll and the last 12 months of T-12 income?
- What does the HOA fee cover, when was the last increase, and are there any pending special assessments or reserve-fund shortfalls?
- Is there a deadline driving the sale (1031 exchange, divorce, estate, relocation)? That informs how much negotiation room exists.
- Schools are D-rated, which usually means shorter tenancies and higher turnover. Who's the typical renter profile here, and what's been the actual vacancy rate?
- Crime grade is F in this area — have there been break-ins, vandalism, or insurance claims at this property in the last 3 years? What carrier currently insures it and at what premium?
- The area grade is low — what's the realistic commute time and amenity access for the typical tenant pool here? Any planned neighborhood developments (good or bad) we should know about?
- What's the average days-on-market for RENTAL listings here right now (not sales)? A rising rental-DOM trend means longer vacancies and softer asking-rent achievability than the comps imply.
- What's the recent tenant-quality profile in this submarket — average credit score on applications, eviction rate, late-payment / NSF rate, and stable-employment percentage? A property-management company in the area should have these aggregated.
- How much new for-sale + rental construction is in the pipeline within 1–3 miles? Heavy new supply typically softens prices + rents 12–24 months out; constrained supply supports both.
Investment metrics
- 1% rule
- 0.97% ✗
- Cap rate
- 6.25%
- Cash-on-cash
- -0.15%
- DSCR
- 0.99
- GRM
- 8.5
CMA / ARV
- ARV (median comp)
- $283,455
- List price
- $329,000
- Delta
- 16.07%
- Verdict
- OVERPRICED
- Comps
- 20 within 1.0 mi
Show comp detail 12 sales within ~0.75 mi
| Address | Dist | Beds/Ba | Sqft | Sold | Price | $/sf | Match |
|---|---|---|---|---|---|---|---|
| 12923 Pecan Shores Dr | 0.07mi | 5/2.5 (+1) | 2,777 (+4%) | 0mo | $319,995 | $115 | 86 |
| 12919 Palm Leaf Ct | 0.03mi | 4/2.5 | 2,863 (+7%) | 3mo | $229,900 | $80 | 85 |
| 13018 Sierra National Dr | 0.33mi | 4/3.0 | 2,474 (-8%) | 4mo | $405,000 | $164 | 66 |
| 12926 Barkley Bend Ln | 0.27mi | 4/2.0 | 2,364 (-12%) | 1mo | $339,900 | $144 | 65 |
| 13014 Barkley Bend Ln | 0.29mi | 4/2.0 | 2,329 (-13%) | 1mo | $330,000 | $142 | 62 |
| 15666 Countesswells Dr | 0.72mi | 4/3.5 | 2,714 (+1%) | 0mo | $420,000 | $155 | 60 |
| 15615 Tindary Meadow Ct | 0.68mi | 3/2.0 (-1) | 2,673 (-0%) | 2mo | $350,000 | $131 | 59 |
| 16631 Polletts Cove Ct | 0.37mi | 3/2.5 (-1) | 2,396 (-11%) | 2mo | $372,500 | $155 | 58 |
| 13202 Clover Creek Point Ln | 0.62mi | 4/3.5 | 2,524 (-6%) | 1mo | $375,000 | $149 | 57 |
| 13103 Six Rivers Dr | 0.38mi | 4/3.0 | 3,043 (+14%) | 1mo | $479,000 | $157 | 57 |
| 16810 Ellicott Rock Dr | 0.71mi | 4/3.0 | 2,540 (-5%) | 4mo | $440,000 | $173 | 52 |
| 13002 Fernbank Forest Dr | 0.56mi | 4/2.0 | 2,372 (-12%) | 4mo | $424,000 | $179 | 49 |
Match score weights: distance 35% · size 25% · config 20% · recency 20%. Top-matched comps best support the ARV.
Projected returns pro-forma
-1.59% appreciation · 0.92% rent growth · sell at horizon
- IRR
- -10.9%
- Equity multiple
- 0.56×
- Total profit
- $-40,467
- Equity at exit
- $70,264
- IRR
- -6.1%
- Equity multiple
- 0.53×
- Total profit
- $-43,023
- Equity at exit
- $66,239
Cash invested: $92,120 (down + closing). Projections, not guarantees.
Landlord ↔ Tenant lean methodology
- Overall (STATE)
- 87 Strongly Landlord-Friendly
- State Texas
- 87 Strongly Landlord-Friendly · R+5
- County
- — inherits STATE
- City
- — inherits STATE
ZIP-level market 77044
- Home prices YoY
- -0.7%
- Rents YoY
- 0.9%
- Active inventory
- 340
- Price-to-rent
- 8.5×
Monthly cashflow live
- Estimated rent
- $3,208 high interval (Pro) →
- Mortgage (P&I)
- −$1,725
- Tax from tax record
- −$606 /mo · $7,273/yr
- Insurance
- −$137
- HOA
- −$77
- Vacancy / Maint / Mgmt
- −$674
- Net cashflow
- $-11
Break-even live
Sensitivity live
| Price | -10% $175 | -5% $82 | +0% $-11 | +5% $-105 | +10% $-198 |
|---|---|---|---|---|---|
| Rent | -10% $-265 | -5% $-138 | +0% $-11 | +5% $115 | +10% $242 |
| Rate | -1.0pp $154 | -0.5pp $72 | base $-11 | +0.5pp $-97 | +1.0pp $-183 |
UW: 25.0% down · 7.5% · 30yr · 1.5% tax · 5.0% vac · 8.0% maint · 8.0% mgmt
Financing live
Cash to close
- Down payment
- $82,250
- Closing costs
- $9,870
- Reserves months
- —
- Total cash needed
- —
Loan-product check · same deal, 3 products live
Conventional
25% down · 7.5% · 30yr
- Down + closing
- —
- Monthly P&I
- —
- Monthly cashflow
- —
- DSCR
- —
- Eligible?
- —
Personal DTI + credit; lowest rate.
DSCR
20% down · 8.5% · 30yr
- Down + closing
- —
- Monthly P&I
- —
- Monthly cashflow
- —
- DSCR
- —
- Eligible?
- —
No personal income docs; deal must DSCR.
Hard money
10% down · 12.0% · 12mo
- Down + closing
- —
- Monthly P&I
- —
- Monthly cashflow
- —
- DSCR
- —
- Eligible?
- —
Short-term bridge; refi at stabilization.
Rent comps 10 comps
| Address | Beds | Baths | Sqft | Rent | $/sqft | DOM | Units | Dist |
|---|---|---|---|---|---|---|---|---|
| 16807 Hemlock Grove Dr Humble, TX | 4.0 | 3.0 | 2476 | $3,100 | $1.25 | 45d | 1 | 0.65mi |
| 12731 Arcola Valley Ct Houston, TX | 4.0 | 3.0 | 2663 | $2,676 | $1.00 | 1d | 1 | 0.69mi |
| 15410 Rosehill Summit Ln Houston, TX | 4.0 | 3.0 | 2631 | $5,000 | $1.90 | 3d | 1 | 0.77mi |
| 15614 Countesswells Dr Unit NA Humble, TX | 4.0 | 2.5 | 2620 | $3,350 | $1.28 | 45d | 1 | 0.81mi |
| 15614 Countesswells Dr Humble, TX | 4.0 | 2.5 | 2620 | $3,150 | $1.20 | 4d | 1 | 0.81mi |
| 16614 Spirit Lake Ct Houston, TX | 3.0 | 2.5 | 2374 | $2,395 | $1.01 | 26d | 1 | 0.99mi |
| 16411 Little Pine Creek Dr Humble, TX | 4.0 | 3.0 | 2646 | $2,871 | $1.09 | 1d | 1 | 1.05mi |
| 12643 Jamestown Crossing Ln Humble, TX | 4.0 | 2.0 | 2450 | $4,995 | $2.04 | 26d | 1 | 1.22mi |
| 12323 Crescent Mountain Ln Humble, TX | 3.0 | 2.5 | 2358 | $2,231 | $0.95 | 1d | 1 | 1.45mi |
| 13513 Northline Lake Dr Houston, TX | 3.0 | 3.0 | 2034 | $2,800 | $1.38 | 45d | 1 | 1.46mi |
HOA detail
- Monthly dues
- $77 · $924/yr
- Likely covers
- gaselectric
Listing history 31 events
-
2026-06-21days on market $329,000 Active 25 DOM
-
2026-06-18days on market $329,000 Active 22 DOM
-
2026-06-17days on market $329,000 Active 21 DOM
-
2026-06-16days on market $329,000 Active 20 DOM
-
2026-06-15days on market $329,000 Active 19 DOM
-
2026-06-13days on market $329,000 Active 17 DOM
-
2026-06-13days on market $329,000 Active 16 DOM
-
2026-06-09days on market $329,000 Active 13 DOM
-
2026-06-08days on market $329,000 Active 12 DOM
-
2026-06-07days on market $329,000 Active 11 DOM
-
2026-06-04days on market $329,000 Active 8 DOM
-
2026-06-03days on market $329,000 Active 7 DOM
-
2026-06-02days on market $329,000 Active 6 DOM
-
2026-06-01days on market $329,000 Active 5 DOM
-
2026-05-31days on market $329,000 Active 4 DOM
-
2026-04-14price $329,000 1016-char remark
-
2026-03-18price $335,000 1016-char remark
-
2026-02-05$339,000 Active 1016-char remark
-
2025-01-04historical $1,800
-
2024-12-31$1,800
-
2017-07-30historical
-
2017-07-20price $217,900
-
2017-06-18price $220,000
-
2017-06-10$234,900 Active
-
2016-10-01historical
-
2016-08-31price $239,500
-
2016-08-26price $239,450
-
2016-08-05price $239,500
-
2016-06-26$243,500 Active
-
2012-03-24historical
-
2012-01-10$176,900
ⓘ Source: listings_history table (triggers on properties + properties_extension) + one-shot
backfill from property_details.listing_events for pre-trigger history.
Tax reassessment forecast TX · Resets to sale price
- Current annual tax
- $7,273 · $606/mo
- Projected year-2 tax
- $7,273 · $606/mo
- Expected delta
- $0/yr ($0/mo · 0.0%)
ⓘ Screening estimate from a state-policy table — verify with the county assessor before closing.
Climate risk First Street
- Flood 1/10 Low FEMA zone X (unshaded) · 0% chance over 30 yrs
- Wildfire 1/10 Low
- Heat 9/10 Extreme 7 d/yr ≥111°F today · 24 d/yr by 30 yrs out
- Wind 9/10 Extreme 99% chance of damaging wind over 30 yrs
- Air quality 3/10 Moderate 3 unhealthy d/yr today · 3 by 30 yrs out
Nearby sold comps map
Loading sold comps map…
Walkable amenities ~0.75 mi
Loading nearby amenities…
Taxation est. · year 1
- Rental income
- $38,492
- − Mortgage interest
- −$18,429
- − Property taxes
- −$7,273
- − Insurance
- −$1,645
- − Repairs & maintenance
- −$3,079
- − Management
- −$3,079
- − HOA
- −$924
- − Depreciation
- −$9,571
- Taxable loss
- −$5,509
- Est. tax savings @ 24.0%
- +$1,322
- After-tax cash flow
- $1,185/yr
For passive investors: Depreciation is non-cash, so a rental often shows a tax loss while cash-flowing — sheltering income. Rental losses are passive: they offset passive income freely, and up to $25,000/yr can offset ordinary (W-2) income if you actively participate and your MAGI is under $100k (phasing out to $0 by $150k); unused losses carry forward. On sale, claimed depreciation is recaptured at up to 25%, and gains may owe capital-gains tax (a 1031 exchange can defer both). Figures are a year-1 estimate at your 24.0% rate — not tax advice; consult a CPA.
Schools (NCES district)
- District
- Humble ISD
- NCES district ID
- 4823910
- Math proficiency
- 38% ▼ -11.00%
- Reading proficiency
- 44% ▼ -7.00%
- Median HH income
- $83,946
- Composite
- 38.55/100
- National rank
- #4171
- State rank
- #262 of 826 in TX
Livability — Houston
- Score
- 74/100
- State rank
- #184
- US rank
- #4771
Category grades
Schools grade is shown separately in the Schools card above.
Census & demographics
- Census place
- Houston, TX
- County
- Harris County · 4,702,590 people
- City population
- 3,226,434
- Metro
- Houston-The Woodlands-Sugar Land, TX
- Population (ZIP)
- 58,347
- Household income
- $95,000
- Rent vs Own
- Severe rent burden
- 1332.0
Population outlook (Harris County) Hauer SSP2
- Today (2025)
- 5,571,493 people
- By 2030
- 6,089,821 · +9.3%
- By 2040
- 7,142,806 · +28.2%
- By 2050
- 8,185,864 · +46.9%
- By 2075
- 10,574,329 · +89.8%
- By 2100
- 12,109,958 · +117.4%
Race, ethnicity, and origin ACS 2023
- Neighborhood character
- Diverse neighborhood (Simpson 0.66)
- Race & ethnicity
- Hispanic / Latino 44% Black 32% White 19% Two or more races 18% Native American 2% Asian 1%
- Hispanic origin (detail)
- Mexican 36%
- Common ancestry
- Lithuanian 1% Romanian 1% Iranian 1%
- Foreign-born
- 18% · Canada
- Languages at home
- 61% English-only · Spanish 35% French/Haitian/Cajun 1% Other Indo-European 1%
Political lean MEDSL · Harris
- 2024 margin
- Lean D (+5.5) · D 52.0% · R 46.4% · Other 1.6%
- 2008→2024 swing
- +3.9pp toward D · 2008: 1.6pp · 2024: 5.5pp
- All cycles
- 2024: D+5.5 2020: D+13.3 2016: D+12.4 2012: D+0.1 2008: D+1.6
Not yet ingested
- Civics
- —
Market trends
- HPI YoY
- ▼ -1.59%
- Current HPI
- 215.5736
- Rent YoY
- ▲ 0.92%
- Metro
- Houston-The Woodlands-Sugar Land, TX
- State GDP YoY
- ▲ 3.95%
- F500 in state
- 110
Industry mix (Fortune 500 HQ in TX)
| Industry | F500 HQs | Revenue |
|---|---|---|
| Energy | 16 | $1,198B |
|
||
| Technology | 5 | $198B |
|
||
| Engineering / Construction | 4 | $72B |
|
||
| Energy Services | 3 | $60B |
|
||
| Utilities | 3 | $41B |
|
||
| Healthcare | 2 | $330B |
|
||
Price history
+86.0% since first listed18 events — show timeline
- 2026-05-26 Listing Removed — HARMLS
- 2026-05-26 Listed $329,000 HARMLS
- 2026-04-14 Price Changed $329,000 HARMLS
- 2026-03-18 Price Changed $335,000 HARMLS
- 2026-02-05 Listed $339,000 HARMLS
- 2025-01-04 Rental Removed $1,800 RENTSPREE
- 2024-12-31 Listed for Rent $1,800 RENTSPREE
- 2017-07-30 Listing Removed — HARMLS
- 2017-07-20 Price Changed $217,900 HARMLS
- 2017-06-18 Price Changed $220,000 HARMLS
- 2017-06-10 Listed $234,900 HARMLS
- 2016-10-01 Listing Removed — HARMLS
- 2016-08-31 Price Changed $239,500 HARMLS
- 2016-08-26 Price Changed $239,450 HARMLS
- 2016-08-05 Price Changed $239,500 HARMLS
- 2016-06-26 Listed $243,500 HARMLS
- 2012-03-24 Listing Removed — HARMLS
- 2012-01-10 Listed $176,900 HARMLS
Property tax history
+1.2%/yrLatest (2025): $7,273 · +10.8% YoY. Source: county tax records.
Cash-flow waterfall
monthlySold comps — $/sqft
last 12 mo · ≤1 miLoading sold comps…