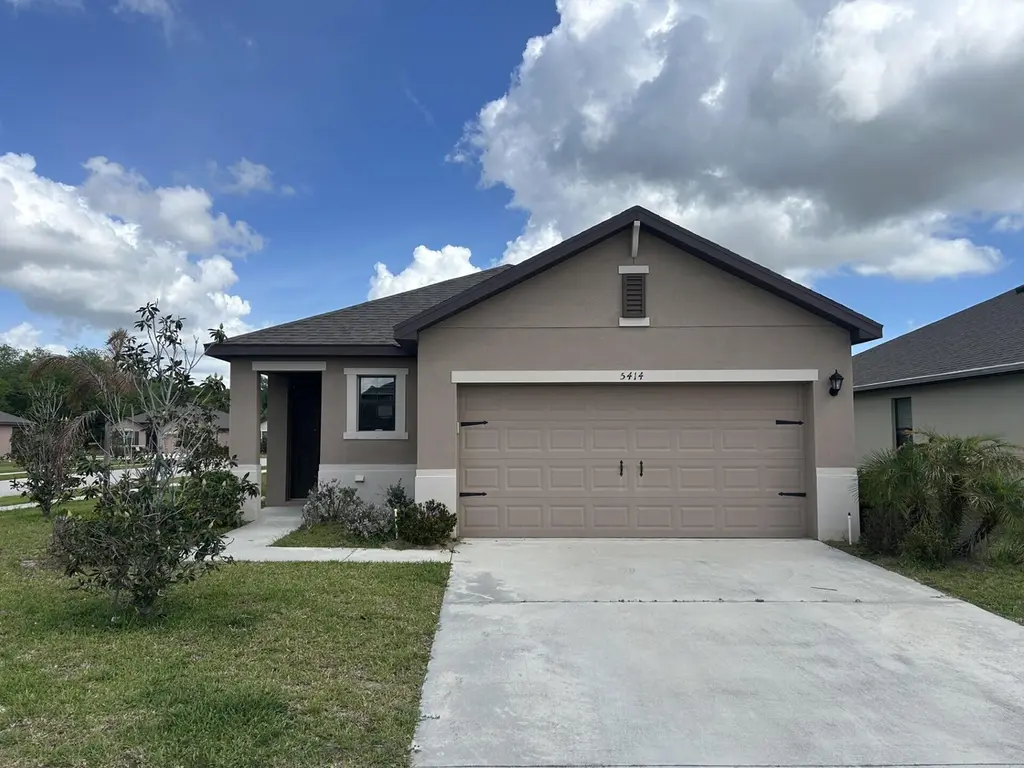
5414 Delight Dr · Fort Pierce, FL
Flood risk 1/10 · Minimal
- FEMA flood zone
- X (shaded)
- Chance of flooding over 30 yrs
- 0.0%
- Est. flood insurance / yr
- $507 – $1,088
Fire risk 2/10 · Minimal
- Est. fire insurance / yr
- $947 – $1,759
Heat risk 10/10 · Severe
- Hot days now (above 106°F)
- 6 days/yr
- Hot days in 30 yrs
- 19 days/yr
Wind risk 10/10 · Severe
- Chance of severe wind over 30 yrs
- 99.0%
Air-quality risk 2/10 · Minimal
- Unhealthy air days now
- 0 days/yr
- Unhealthy air days in 30 yrs
- 1 days/yr
Risk factors via First Street. Map © Google.
Why this score? — see what drove the D grade
The composite is a weighted blend of 9 inputs, each scored 0–100. Each bar is that input's sub-score; the figure is the points it added to the 100-point composite (weight × sub-score).
- Cash flow +12.1/30.0
- ARV discount +10.8/15.0
- 1% rule +4.1/10.0
- Livability +3.8/5.0
- Schools +3.7/10.0
- DSCR +3.6/10.0
- Rent growth +2.5/5.0
- Condition / age +2.5/5.0
- Appreciation +0.0/10.0
$275,500
🖨 Deal sheet (PDF) 📄 Offer letter ✓ Due diligence
Listing remarks
Discover this 3 bed, 2 bath CBS home on a desirable corner lot! This well-designed one-story residence offers a spacious open-concept layout with a split floor plan for optimal privacy. The granite kitchen, complete with stainless steel appliances, overlooks the living area and covered patio, making it ideal for both daily living and entertaining . The private owner's suite is tucked at the back with its own ensuite bathroom. Two additional bedrooms share the second full bath. Enjoy durable vinyl flooring throughout the main areas, inside laundry, and solid CBS construction for lasting peace of mind . The corner lot provides extra yard space, better light, and added privacy from multiple si
Key facts
- Covered patio
- Granite kitchen
- Ensuite bathroom
Tags
Property features AI
Finance
- Other: Pets allowed (dogs OK)
- HOA & community: Community clubhouse; Community pool; Sidewalks; HOA/association dues (paid quarterly)
Exterior
- Parking: Attached 2-car garage; Driveway (2 covered spaces); Total 4 parking spaces
- Utilities: Public water; Public sewer; Electricity connected; Water connected; Sewer connected
- Home design: Single family residence; One story; Faces south; Resale condition
- Construction: Concrete block with stucco construction; Shingle roof; Built as one-story
- Exterior features: Not waterfront
Interior
- Kitchen: Dishwasher; Microwave; Refrigerator
- Bedrooms: 3 bedrooms on main level
- Flooring: Carpet; Vinyl
- Bathrooms: 2 full bathrooms
- Heating & cooling: Central electric heating; Central electric cooling
- Interior features: Split bedroom layout
- Laundry & utility: Laundry inside
Neighborhood map
What this means for you Summary
Snapshot
- This is a 3-bed/2.0-bath single-family listed at $276k.
Deal economics
- At list price, monthly cash flow is $-58 ($-697/yr) — negative.
- To cash-flow at today's rent, offer at most $265k (3.7% below list).
- To meet the 1% rule (rent ≥ 1% of price), the offer needs to be $252k (8.6% below list).
- Recommended offer: $252k (8.6% below list) — sets the bar for 1% rule.
- Cap rate 6.0% vs local median 3.5% in Fort Pierce — top-decile yield for the area; either an underpriced asset or a hidden risk that comps aren't pricing in. Stress-test before assuming the spread holds.
Location & tenants
- Location reads 76/100 on livability (#226 in FL, #3,360 nationally) — a middle-class / working-renter tenant base. Strengths: commute A+, cost of living A+, housing A+; Watch: crime D+, amenities F, employment F.
- St. Lucie (urban): math 40% / reading 48% proficiency, ranked #51 of 73 in FL (top 70%) — families likely to look elsewhere, expect single-tenant / working-renter base with shorter leases.
- Zoned schools: Manatee Academy K-8 (math 53% / reading 51%, grade C-, #990 of 2,144 statewide, top 48%, 1,664 students, 65% FRL); Southern Oaks Middle School (math 39% / reading 43%, grade F, #353 of 571 statewide, top 63%, 894 students, 76% FRL); Fort Pierce Central High School (math 15% / reading 45%, grade F, #441 of 667 statewide, top 67%, 3,091 students, 62% FRL).
- Market conditions: 151 active listings in the ZIP; 12 comparable units currently listed for rent nearby; rentals at typical pace (median 26d on market — plan ~3-4 weeks tenant-placement turnaround); 4,868 units permitted in St. Lucie County in 2024 (268 in 5+ unit buildings).
- At $2,518/mo this rent would consume 58% of the median local household income ($52k/yr) (locally 625% of renters already pay >50% of income on rent) — very limited rent-growth headroom before tenants either downsize or default.
Forward outlook
- Local home prices are declining (-3.0%/yr); year-one equity from $2k of loan paydown is wiped out by about $8k of value loss. Plan a longer hold.
- St. Lucie County population projected at +20% by 2050 — long-run rental-demand tailwind backs the buy-and-hold thesis.
Negotiation context
- It's been on market 69 days — a 6% lower offer ($259k) is reasonable based on typical stale-listing flexibility.
- 5 sale attempts since 4y ago; this cycle's ask has dropped $24k (8%) from the opening price — seller is motivated, your offer sets the floor, not the list.
Risks & watch-outs
- Climate carrying-cost: severe wind risk, 99% chance of damaging wind over 30y; extreme-heat days projected 6→19/yr by 2055 (HVAC capex compounding) — expect insurance premiums to compound above CPI over the hold.
Questions for the listing agent
- What do current leases actually rent for vs. the listed asking? Can we see a recent rent roll and the last 12 months of T-12 income?
- It's been on market 69 days. Have you received any prior offers? Is the seller open to a 9% concession, seller financing, or rate buy-down credit?
- What does the HOA fee cover, when was the last increase, and are there any pending special assessments or reserve-fund shortfalls?
- Why hasn't it sold? Are there any deal-killer items the seller is aware of (foundation, flood, title, zoning, code violations)?
- Is there a deadline driving the sale (1031 exchange, divorce, estate, relocation)? That informs how much negotiation room exists.
- Schools are D-rated, which usually means shorter tenancies and higher turnover. Who's the typical renter profile here, and what's been the actual vacancy rate?
- Crime grade is D in this area — have there been break-ins, vandalism, or insurance claims at this property in the last 3 years? What carrier currently insures it and at what premium?
- The area grade is low — what's the realistic commute time and amenity access for the typical tenant pool here? Any planned neighborhood developments (good or bad) we should know about?
- What's the average days-on-market for RENTAL listings here right now (not sales)? A rising rental-DOM trend means longer vacancies and softer asking-rent achievability than the comps imply.
- What's the recent tenant-quality profile in this submarket — average credit score on applications, eviction rate, late-payment / NSF rate, and stable-employment percentage? A property-management company in the area should have these aggregated.
- How much new for-sale + rental construction is in the pipeline within 1–3 miles? Heavy new supply typically softens prices + rents 12–24 months out; constrained supply supports both.
Investment metrics
- 1% rule
- 0.91% ✗
- Cap rate
- 6.04%
- Cash-on-cash
- -0.90%
- DSCR
- 0.96
- GRM
- 9.1
CMA / ARV
- ARV (on-the-fly)
- $297,142
- Comps found
- 3
Show comp detail 3 sales within ~0.75 mi
| Address | Dist | Beds/Ba | Sqft | Sold | Price | $/sf | Match |
|---|---|---|---|---|---|---|---|
| 679 Carlyle Way | 0.43mi | 3/2.0 | 1,487 (+1%) | 15mo | $285,000 | $192 | 66 |
| 699 Carlyle Way | 0.51mi | 3/2.0 | 1,487 (+1%) | 16mo | $299,990 | $202 | 61 |
| 1514 Merriment Way | 0.43mi | 3/2.0 | 1,401 (-5%) | 23mo | $357,900 | $255 | 53 |
Match score weights: distance 35% · size 25% · config 20% · recency 20%. Top-matched comps best support the ARV.
Projected returns pro-forma
-3.0% appreciation · 3.0% rent growth · sell at horizon
- IRR
- -17.7%
- Equity multiple
- 0.37×
- Total profit
- $-48,218
- Equity at exit
- $41,078
- IRR
- -9.8%
- Equity multiple
- 0.40×
- Total profit
- $-46,240
- Equity at exit
- $23,820
Cash invested: $77,140 (down + closing). Projections, not guarantees.
Landlord ↔ Tenant lean methodology
- Overall (STATE)
- 87 Strongly Landlord-Friendly
- State Florida
- 87 Strongly Landlord-Friendly · R+3
- County
- — inherits STATE
- City
- — inherits STATE
ZIP-level market 34947
- Home prices YoY
- -8.6%
- Active inventory
- 151
- Price-to-rent
- 9.1×
Monthly cashflow live
- Estimated rent
- $2,518 high interval (Pro) →
- Mortgage (P&I)
- −$1,445
- Tax from tax record
- −$441 /mo · $5,290/yr
- Insurance
- −$115
- HOA
- −$47
- Vacancy / Maint / Mgmt
- −$529
- Net cashflow
- $-58
Break-even live
Sensitivity live
| Price | -10% $98 | -5% $20 | +0% $-58 | +5% $-136 | +10% $-214 |
|---|---|---|---|---|---|
| Rent | -10% $-257 | -5% $-158 | +0% $-58 | +5% $41 | +10% $141 |
| Rate | -1.0pp $81 | -0.5pp $12 | base $-58 | +0.5pp $-129 | +1.0pp $-202 |
UW: 25.0% down · 7.5% · 30yr · 1.5% tax · 5.0% vac · 8.0% maint · 8.0% mgmt
Financing live
Cash to close
- Down payment
- $68,875
- Closing costs
- $8,265
- Reserves months
- —
- Total cash needed
- —
Loan-product check · same deal, 3 products live
Conventional
25% down · 7.5% · 30yr
- Down + closing
- —
- Monthly P&I
- —
- Monthly cashflow
- —
- DSCR
- —
- Eligible?
- —
Personal DTI + credit; lowest rate.
DSCR
20% down · 8.5% · 30yr
- Down + closing
- —
- Monthly P&I
- —
- Monthly cashflow
- —
- DSCR
- —
- Eligible?
- —
No personal income docs; deal must DSCR.
Hard money
10% down · 12.0% · 12mo
- Down + closing
- —
- Monthly P&I
- —
- Monthly cashflow
- —
- DSCR
- —
- Eligible?
- —
Short-term bridge; refi at stabilization.
Rent comps 12 comps
| Address | Beds | Baths | Sqft | Rent | $/sqft | DOM | Units | Dist |
|---|---|---|---|---|---|---|---|---|
| 5517 Amusement Ave Fort Pierce, FL | 3.0 | 2.0 | 1716 | $2,600 | $1.52 | 25d | 1 | 0.09mi |
| 5335 Entertainment Way Fort Pierce, FL | 3.0 | 2.0 | 1224 | $2,500 | $2.04 | 25d | 1 | 0.11mi |
| 5318 Imagination Dr Fort Pierce, FL | 3.0 | 2.0 | 1542 | $2,500 | $1.62 | 25d | 1 | 0.30mi |
| 793 Worlington Ln Fort Pierce, FL | 3.0 | 2.0 | 1560 | $2,750 | $1.76 | 25d | 1 | 0.38mi |
| 1618 Merriment Way Fort Pierce, FL | 3.0 | 2.0 | 1538 | $2,200 | $1.43 | 25d | 1 | 0.51mi |
| 4213 Longmour Ln Fort Pierce, FL | 3.0 | 2.0 | 1640 | $2,400 | $1.46 | 25d | 1 | 0.57mi |
| 4209 Longmour Ln Fort Pierce, FL | 3.0 | 2.0 | 1640 | $2,400 | $1.46 | 25d | 1 | 0.59mi |
| 1810 Celebration Dr Fort Pierce, FL | 4.0 | 2.0 | 1767 | $2,700 | $1.53 | 25d | 1 | 0.64mi |
| 1817 Party Pl Fort Pierce, FL | 3.0 | 2.0 | 1389 | $2,250 | $1.62 | 25d | 1 | 0.67mi |
| 100 Corner Dr Fort Pierce, FL | 1.0–3.0 | 1.0–2.0 | 926 | $1,487 | $1.60 | 16d | 32 | 0.89mi |
| 1200 Treasure Cay Dr Fort Pierce, FL | 1.0–2.0 | 1.0–2.0 | 995 | $1,619 | $1.63 | 16d | 10 | 1.11mi |
| 3208 Louisiana Ave Apt 3 Fort Pierce, FL | 3.0 | 1.0 | 1050 | $1,500 | $1.43 | 25d | 1 | 1.39mi |
HOA detail
- Monthly dues
- $47 · $564/yr
Listing history 33 events
-
2026-06-21days on market $275,500 Active 69 DOM
-
2026-06-18days on market $275,500 Active 66 DOM
-
2026-06-17days on market $275,500 Active 65 DOM
-
2026-06-16pricedays on market $275,500 Active 64 DOM
-
2026-06-15days on market $289,900 Active 63 DOM
-
2026-06-14days on market $289,900 Active 61 DOM
-
2026-06-13days on market $289,900 Active 60 DOM
-
2026-06-10days on market $289,900 Active 58 DOM
-
2026-06-09days on market $289,900 Active 57 DOM
-
2026-06-08days on market $289,900 Active 56 DOM
-
2026-06-07days on market $289,900 Active 55 DOM
-
2026-06-05days on market $289,900 Active 52 DOM
-
2026-06-03days on market $289,900 Active 51 DOM
-
2026-06-02days on market $289,900 Active 50 DOM
-
2026-06-01days on market $289,900 Active 49 DOM
-
2026-05-31days on market $289,900 Active 48 DOM
-
2026-05-30days on market $289,900 Active 47 DOM
-
2026-05-15price $289,900
-
2026-04-13$299,500 Active
-
2025-02-21historical
-
2024-11-03price $329,000
-
2024-09-18$335,000 Active
-
2024-09-15historical
-
2024-08-22price $334,000
-
2024-07-08price $335,000
-
2024-06-13price $349,999
-
2024-04-30$365,000 Active
-
2024-04-26historical
-
2022-06-29soldstatus $291,265
-
2022-06-29$291,265
-
2022-06-23soldstatus $291,265 Closed
-
2022-01-05status Pending
-
2022-01-04$291,265 Active
ⓘ Source: listings_history table (triggers on properties + properties_extension) + one-shot
backfill from property_details.listing_events for pre-trigger history.
Tax reassessment forecast FL · Resets to sale price
- Current annual tax
- $5,290 · $441/mo
- Projected year-2 tax
- $5,290 · $441/mo
- Expected delta
- $0/yr ($0/mo · 0.0%)
ⓘ Screening estimate from a state-policy table — verify with the county assessor before closing.
Climate risk First Street
- Flood 1/10 Low FEMA zone X (shaded) · 0% chance over 30 yrs
- Wildfire 2/10 Low
- Heat 10/10 Extreme 6 d/yr ≥106°F today · 19 d/yr by 30 yrs out
- Wind 10/10 Extreme 99% chance of damaging wind over 30 yrs
- Air quality 2/10 Low 0 unhealthy d/yr today · 1 by 30 yrs out
Nearby sold comps map
Loading sold comps map…
Walkable amenities ~0.75 mi
Loading nearby amenities…
Taxation est. · year 1
- Rental income
- $30,217
- − Mortgage interest
- −$15,432
- − Property taxes
- −$5,290
- − Insurance
- −$1,378
- − Repairs & maintenance
- −$2,417
- − Management
- −$2,417
- − HOA
- −$564
- − Depreciation
- −$8,015
- Taxable loss
- −$5,296
- Est. tax savings @ 24.0%
- +$1,271
- After-tax cash flow
- $574/yr
For passive investors: Depreciation is non-cash, so a rental often shows a tax loss while cash-flowing — sheltering income. Rental losses are passive: they offset passive income freely, and up to $25,000/yr can offset ordinary (W-2) income if you actively participate and your MAGI is under $100k (phasing out to $0 by $150k); unused losses carry forward. On sale, claimed depreciation is recaptured at up to 25%, and gains may owe capital-gains tax (a 1031 exchange can defer both). Figures are a year-1 estimate at your 24.0% rate — not tax advice; consult a CPA.
Schools (NCES district)
- District
- St. Lucie
- NCES district ID
- 1201770
- Math proficiency
- 40% ▼ -11.00%
- Reading proficiency
- 48% ▼ -4.00%
- Median HH income
- $44,737
- Composite
- 37.28/100
- National rank
- #4449
- State rank
- #51 of 73 in FL
Livability — Fort Pierce
- Score
- 76/100
- State rank
- #226
- US rank
- #3360
Category grades
Schools grade is shown separately in the Schools card above.
Census & demographics
- Census place
- Fort Pierce, FL
- County
- Saint Lucie County · 337,150 people
- City population
- 78,556
- Metro
- Port St. Lucie, FL
- Population (ZIP)
- 12,804
- Household income
- $51,811
- Rent vs Own
- Severe rent burden
- 625.0
Population outlook (St. Lucie County) Hauer SSP2
- Today (2025)
- 338,016 people
- By 2030
- 355,687 · +5.2%
- By 2040
- 385,521 · +14.1%
- By 2050
- 406,106 · +20.1%
- By 2075
- 441,054 · +30.5%
- By 2100
- 436,885 · +29.2%
Race, ethnicity, and origin ACS 2023
- Neighborhood character
- Diverse neighborhood (Simpson 0.65)
- Race & ethnicity
- Black 52% Hispanic / Latino 22% White 17% Two or more races 10% Asian 5% Native American 1%
- Hispanic origin (detail)
- Mexican 12% Puerto Rican 3% Cuban 1%
- Common ancestry
- Hispanic 8% Italian 2% Romanian 1%
- Foreign-born
- 16% · Canada
- Languages at home
- 73% English-only · Spanish 17% French/Haitian/Cajun 7% Other Indo-European 2%
Political lean MEDSL · St. Lucie
- 2024 margin
- Lean R (+9.1) · D 45.1% · R 54.2%
- 2008→2024 swing
- -21.2pp toward R · 2008: 12.1pp · 2024: -9.1pp
- All cycles
- 2024: R+9.1 2020: R+1.6 2016: R+2.5 2012: D+7.9 2008: D+12.1
Not yet ingested
- Civics
- —
Market trends
- HPI YoY
- ▼ -33.68%
- Current HPI
- 356.2528
- Rent YoY
- —
- Metro
- Port St. Lucie, FL
- State GDP YoY
- ▲ 3.28%
- F500 in state
- 36
Industry mix (Fortune 500 HQ in FL)
| Industry | F500 HQs | Revenue |
|---|---|---|
| Industrial Technology | 2 | $29B |
|
||
| Insurance | 2 | $17B |
|
||
| Retail | 1 | $60B |
|
||
| Technology Distribution | 1 | $58B |
|
||
| Homebuilding | 1 | $35B |
|
||
| Technology Manufacturing | 1 | $35B |
|
||
Price history
-0.5% since first listed16 events — show timeline
- 2026-05-15 Price Changed $289,900 Beaches MLS
- 2026-04-13 Listed $299,500 Beaches MLS
- 2025-02-21 Listing Removed — Beaches MLS
- 2024-11-03 Price Changed $329,000 Beaches MLS
- 2024-09-18 Listed $335,000 Beaches MLS
- 2024-09-15 Listing Removed — Beaches MLS
- 2024-08-22 Price Changed $334,000 Beaches MLS
- 2024-07-08 Price Changed $335,000 Beaches MLS
- 2024-06-13 Price Changed $349,999 Beaches MLS
- 2024-04-30 Listed $365,000 Beaches MLS
- 2024-04-26 Coming Soon — Beaches MLS
- 2022-06-29 Listed $291,265 Beaches MLS
- 2022-06-29 Sold (MLS) $291,265 Beaches MLS
- 2022-06-23 Sold (MLS) $291,265 Beaches MLS
- 2022-01-05 Pending — Beaches MLS
- 2022-01-04 Listed $291,265 Beaches MLS
Property tax history
+37.0%/yrLatest (2025): $5,290 · +3.6% YoY. Source: county tax records.
Cash-flow waterfall
monthlySold comps — $/sqft
last 12 mo · ≤1 miLoading sold comps…