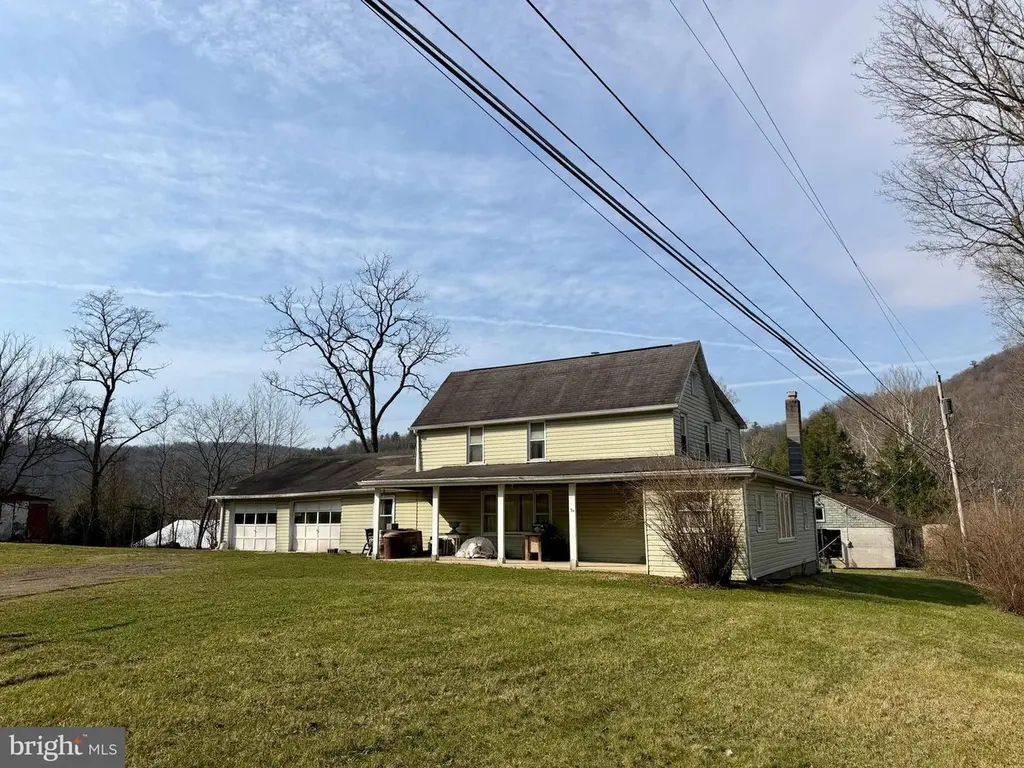
110 Lucas Rd · Boggs, PA
Flood risk 1/10 · Minimal
- FEMA flood zone
- X (unshaded)
- Chance of flooding over 30 yrs
- 0.0%
- Est. flood insurance / yr
- $473 – $860
Fire risk 3/10 · Minor
- Est. fire insurance / yr
- $511 – $949
Heat risk 3/10 · Minor
- Hot days now (above 95°F)
- 7 days/yr
- Hot days in 30 yrs
- 17 days/yr
Wind risk 2/10 · Minimal
- Chance of severe wind over 30 yrs
- —
Air-quality risk 2/10 · Minimal
- Unhealthy air days now
- 0 days/yr
- Unhealthy air days in 30 yrs
- 1 days/yr
Risk factors via First Street. Map © Google.
Why this score? — see what drove the D grade
The composite is a weighted blend of 9 inputs, each scored 0–100. Each bar is that input's sub-score; the figure is the points it added to the 100-point composite (weight × sub-score).
- Cash flow +15.0/30.0
- ARV discount +7.5/15.0
- DSCR +4.6/10.0
- 1% rule +4.5/10.0
- Schools +4.2/10.0
- Rent growth +2.5/5.0
- Livability +2.5/5.0
- Condition / age +2.5/5.0
- Appreciation +0.0/10.0
$170,000
🖨 Deal sheet (PDF) 📄 Offer letter ✓ Due diligence
Listing remarks
Welcome to 110 Lucas Road—a place where opportunity meets possibility and where your vision can truly come to life. Nestled on approximately one acre in Central Pennsylvania, this spacious two-story home offers over 2,000 square feet of living space just waiting for your personal touch. Inside, you’ll find a flexible layout with 3/4 bedrooms and two full bathrooms, including the convenience of 1/2 bedrooms and bath on the main floor and the additional bedrooms and a bath upstairs. The attached two-car garage adds everyday practicality, while the generous lot invites gardening, outdoor enjoyment, or simply soaking in the surroundings. While the home is in need of updates and care
Key facts
- Generous lot
- Flexible layout
- One acre
Tags
Neighborhood map
What this means for you Summary
Snapshot
- This is a 3-bed/1.0-bath other listed at $170k.
Deal economics
- At list price, monthly cash flow is $53 ($632/yr) — positive.
- The deal already cash-flows at list — no discount required.
- To meet the 1% rule (rent ≥ 1% of price), the offer needs to be $161k (5.5% below list).
- Recommended offer: $161k (5.5% below list) — sets the bar for 1% rule.
Location & tenants
- Location reads: area grade D — affects rentability + tenant quality, not the cash-flow math above.
- Bald Eagle Area SD (rural): math 46% / reading 51% proficiency, ranked #199 of 539 in PA (top 37%) — families likely to look elsewhere, expect single-tenant / working-renter base with shorter leases.
- Market conditions: 198 active listings in the ZIP; solid renter incomes; 399 units permitted in Centre County in 2024 (44 in 5+ unit buildings).
Forward outlook
- Local home prices are declining (-3.0%/yr); year-one equity from $1k of loan paydown is wiped out by about $5k of value loss. Plan a longer hold.
- Centre County population projected at +16% by 2050 — long-run rental-demand tailwind backs the buy-and-hold thesis.
Negotiation context
- It's been on market 21 days — a 2% lower offer ($167k) is reasonable based on typical stale-listing flexibility.
Risks & watch-outs
- Watch-outs: built in 1938 — expect roof / HVAC / electrical / plumbing capex.
Questions for the listing agent
- Built in 1938 — when were the roof, HVAC, electrical panel, plumbing, and water heater last replaced?
- Is there a deadline driving the sale (1031 exchange, divorce, estate, relocation)? That informs how much negotiation room exists.
- The area grade is low — what's the realistic commute time and amenity access for the typical tenant pool here? Any planned neighborhood developments (good or bad) we should know about?
- What's the average days-on-market for RENTAL listings here right now (not sales)? A rising rental-DOM trend means longer vacancies and softer asking-rent achievability than the comps imply.
- What's the recent tenant-quality profile in this submarket — average credit score on applications, eviction rate, late-payment / NSF rate, and stable-employment percentage? A property-management company in the area should have these aggregated.
- How much new for-sale + rental construction is in the pipeline within 1–3 miles? Heavy new supply typically softens prices + rents 12–24 months out; constrained supply supports both.
Investment metrics
- 1% rule
- 0.95% ✗
- Cap rate
- 6.66%
- Cash-on-cash
- 1.33%
- DSCR
- 1.06
- GRM
- 8.8
CMA / ARV
No comps found within radius.
Projected returns pro-forma
-3.0% appreciation · 3.0% rent growth · sell at horizon
- IRR
- -14.1%
- Equity multiple
- 0.49×
- Total profit
- $-24,145
- Equity at exit
- $25,348
- IRR
- -5.3%
- Equity multiple
- 0.65×
- Total profit
- $-16,505
- Equity at exit
- $14,698
Cash invested: $47,600 (down + closing). Projections, not guarantees.
Landlord ↔ Tenant lean methodology
- Overall (STATE)
- 62 Landlord-Friendly
- State Pennsylvania
- 62 Landlord-Friendly · EVEN
- County
- — inherits STATE
- City
- — inherits STATE
ZIP-level market 16823
- Active inventory
- 198
- Price-to-rent
- 8.8×
Monthly cashflow live
- Estimated rent
- $1,607 medium interval (Pro) →
- Mortgage (P&I)
- −$891
- Tax from tax record
- −$254 /mo · $3,053/yr
- Insurance
- −$71
- HOA
- −$0
- Vacancy / Maint / Mgmt
- −$337
- Net cashflow
- $53
Break-even live
Sensitivity live
| Price | -10% $149 | -5% $101 | +0% $53 | +5% $5 | +10% $-44 |
|---|---|---|---|---|---|
| Rent | -10% $-74 | -5% $-11 | +0% $53 | +5% $116 | +10% $180 |
| Rate | -1.0pp $138 | -0.5pp $96 | base $53 | +0.5pp $9 | +1.0pp $-36 |
UW: 25.0% down · 7.5% · 30yr · 1.5% tax · 5.0% vac · 8.0% maint · 8.0% mgmt
Financing live
Cash to close
- Down payment
- $42,500
- Closing costs
- $5,100
- Reserves months
- —
- Total cash needed
- —
Loan-product check · same deal, 3 products live
Conventional
25% down · 7.5% · 30yr
- Down + closing
- —
- Monthly P&I
- —
- Monthly cashflow
- —
- DSCR
- —
- Eligible?
- —
Personal DTI + credit; lowest rate.
DSCR
20% down · 8.5% · 30yr
- Down + closing
- —
- Monthly P&I
- —
- Monthly cashflow
- —
- DSCR
- —
- Eligible?
- —
No personal income docs; deal must DSCR.
Hard money
10% down · 12.0% · 12mo
- Down + closing
- —
- Monthly P&I
- —
- Monthly cashflow
- —
- DSCR
- —
- Eligible?
- —
Short-term bridge; refi at stabilization.
Listing history 2 events
-
2026-04-17status Pending
-
2026-03-27$170,000 Active
ⓘ Source: listings_history table (triggers on properties + properties_extension) + one-shot
backfill from property_details.listing_events for pre-trigger history.
Tax reassessment forecast PA · Partial reset (capped growth)
- Current annual tax
- $3,053 · $254/mo
- Projected year-2 tax
- $3,053 · $254/mo
- Expected delta
- $0/yr ($0/mo · 0.0%)
ⓘ Screening estimate from a state-policy table — verify with the county assessor before closing.
Climate risk First Street
- Flood 1/10 Low FEMA zone X (unshaded) · 0% chance over 30 yrs
- Wildfire 3/10 Moderate
- Heat 3/10 Moderate 7 d/yr ≥95°F today · 17 d/yr by 30 yrs out
- Wind 2/10 Low
- Air quality 2/10 Low 0 unhealthy d/yr today · 1 by 30 yrs out
Nearby sold comps map
Loading sold comps map…
Walkable amenities ~0.75 mi
Loading nearby amenities…
Taxation est. · year 1
- Rental income
- $19,281
- − Mortgage interest
- −$9,523
- − Property taxes
- −$3,053
- − Insurance
- −$850
- − Repairs & maintenance
- −$1,543
- − Management
- −$1,543
- − Depreciation
- −$4,945
- Taxable loss
- −$2,174
- Est. tax savings @ 24.0%
- +$522
- After-tax cash flow
- $1,154/yr
For passive investors: Depreciation is non-cash, so a rental often shows a tax loss while cash-flowing — sheltering income. Rental losses are passive: they offset passive income freely, and up to $25,000/yr can offset ordinary (W-2) income if you actively participate and your MAGI is under $100k (phasing out to $0 by $150k); unused losses carry forward. On sale, claimed depreciation is recaptured at up to 25%, and gains may owe capital-gains tax (a 1031 exchange can defer both). Figures are a year-1 estimate at your 24.0% rate — not tax advice; consult a CPA.
Schools (NCES district)
- District
- Bald Eagle Area SD
- NCES district ID
- 4202910
- Math proficiency
- 46% ▼ -12.00%
- Reading proficiency
- 51% ▼ -14.00%
- Median HH income
- $52,604
- Composite
- 41.78/100
- National rank
- #3395
- State rank
- #199 of 539 in PA
Livability — Boggs
No livability data for this city. (Only ~50 U.S. cities are tracked.)
Census & demographics
- Census place
- Runville, PA
- County
- Centre County · 99,000 people
- Metro
- State College, PA
- Population (ZIP)
- 29,126
- Household income
- $76,245
- Rent vs Own
- Severe rent burden
- 855.0
Population outlook (Centre County) Hauer SSP2
- Today (2025)
- 177,113 people
- By 2030
- 185,138 · +4.5%
- By 2040
- 196,009 · +10.7%
- By 2050
- 205,070 · +15.8%
- By 2075
- 217,575 · +22.8%
- By 2100
- 230,649 · +30.2%
Race, ethnicity, and origin ACS 2023
- Neighborhood character
- Predominantly White (86%)
- Race & ethnicity
- White 86% Black 8% Two or more races 4% Hispanic / Latino 3%
- Common ancestry
- Romanian 4% Slovak 3% Serbian 2%
- Foreign-born
- 3% · China, Canada
- Languages at home
- 94% English-only · Spanish 2% German/W. Germanic 1%
Political lean MEDSL · Centre
- 2024 margin
- Toss-up / Even · D 50.9% · R 48.1% · Other 1.0%
- 2008→2024 swing
- -9.0pp toward R · 2008: 11.8pp · 2024: 2.8pp
- All cycles
- 2024: D+2.8 2020: D+4.8 2016: D+1.9 2012: R+0.0 2008: D+11.8
Not yet ingested
- Civics
- —
Market trends
- HPI YoY
- ▼ -142.54%
- Current HPI
- 202.598
- Rent YoY
- —
- Metro
- State College, PA
- State GDP YoY
- ▲ 1.68%
- F500 in state
- 34
Industry mix (Fortune 500 HQ in PA)
| Industry | F500 HQs | Revenue |
|---|---|---|
| Healthcare | 2 | $309B |
|
||
| Insurance | 2 | $27B |
|
||
| Telecommunications / Media | 1 | $124B |
|
||
| Industrial Distribution | 1 | $22B |
|
||
| Financial Services | 1 | $20B |
|
||
| Chemicals / Materials | 1 | $18B |
|
||
Price history
2 events — show timeline
- 2026-04-17 Pending — BRIGHT MLS
- 2026-03-27 Listed $170,000 BRIGHT MLS
Property tax history
+1.4%/yrLatest (2026): $3,053 · +2.0% YoY. Source: county tax records.
Cash-flow waterfall
monthlySold comps — $/sqft
last 12 mo · ≤1 miLoading sold comps…