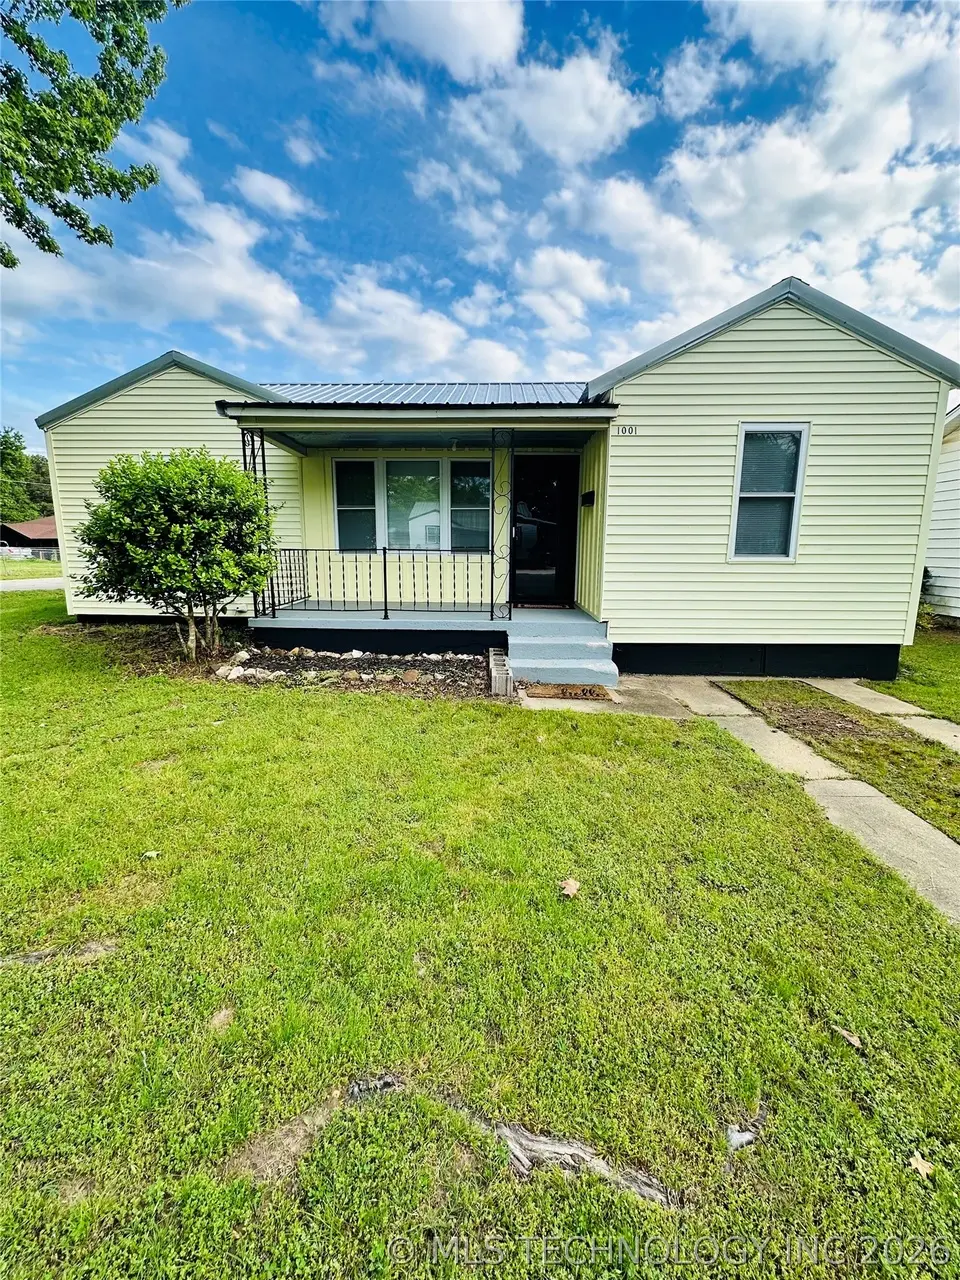
1001 Summit St · Henryetta, OK
Flood risk 1/10 · Minimal
- FEMA flood zone
- X (unshaded)
- Chance of flooding over 30 yrs
- 0.0%
- Est. flood insurance / yr
- $507 – $1,088
Fire risk 8/10 · Major
- Est. fire insurance / yr
- $2,463 – $4,575
Heat risk 6/10 · Moderate
- Hot days now (above 112°F)
- 7 days/yr
- Hot days in 30 yrs
- 19 days/yr
Wind risk 3/10 · Minor
- Chance of severe wind over 30 yrs
- 6.0%
Air-quality risk 2/10 · Minimal
- Unhealthy air days now
- 1 days/yr
- Unhealthy air days in 30 yrs
- 3 days/yr
Risk factors via First Street. Map © Google.
Why this score? — see what drove the D grade
The composite is a weighted blend of 9 inputs, each scored 0–100. Each bar is that input's sub-score; the figure is the points it added to the 100-point composite (weight × sub-score).
- Appreciation +10.0/10.0
- Cash flow +9.8/30.0
- ARV discount +7.5/15.0
- DSCR +2.8/10.0
- Livability +2.7/5.0
- Rent growth +2.5/5.0
- Condition / age +2.5/5.0
- 1% rule +1.6/10.0
- Schools +1.2/10.0
$132,900
🖨 Deal sheet (PDF) 📄 Offer letter ✓ Due diligence
Listing remarks
Adorable home featuring original hardwood floors, updated vinyl windows, and a bright, inviting interior. The kitchen includes laminate countertops, gas range, and ample cabinetry. Exterior offers low-maintenance vinyl siding and a covered front porch and Back porch- perfect for relaxing. Affordable and move in ready! Schedule your showing today!
Key facts
- Ample cabinetry
- Laminate countertops
- Gas range
Tags
Property features AI
Exterior
- Parking: Attached garage; Carport
- Security: Smoke detector(s); No safety shelter
- Utilities: Public water; Public sewer; Electricity available; Natural gas available; Cable available; Phone available
- Home design: Single-story; Faces north; Entry on main level
- Construction: Built by owner (year source: owner); Vinyl siding over wood frame; Metal roof; Slab foundation
- Exterior features: Covered patio and porch; Concrete driveway; Shed(s); Chain link fencing; Corner lot
Interior
- Kitchen: Gas range; Oven; Dishwasher; Gas water heater
- Flooring: Hardwood; Laminate
- Bathrooms: 1 full bathroom; 1 half bathroom
- Heating & cooling: Central heating (gas); Central air conditioning
- Interior features: Ceiling fan(s); Programmable thermostat; Laminate counters; Vinyl windows
- Laundry & utility: Washer hookup; Electric dryer hookup; Gas dryer hookup
Neighborhood map
What this means for you Summary
Snapshot
- This is a 2-bed/2.0-bath single-family listed at $133k.
Deal economics
- At list price, monthly cash flow is $-85 ($-1k/yr) — negative.
- To cash-flow at today's rent, offer at most $118k (11.4% below list).
- To meet the 1% rule (rent ≥ 1% of price), the offer needs to be $88k (33.6% below list).
- Recommended offer: $88k (33.6% below list) — sets the bar for 1% rule.
- Cap rate 5.5% vs local median 4.0% in Henryetta — top-decile yield for the area; either an underpriced asset or a hidden risk that comps aren't pricing in. Stress-test before assuming the spread holds.
Location & tenants
- Location reads 54/100 on livability (#589 in OK) — a working-class tenant base; expect higher turnover. Strengths: cost of living A+, housing A+; Watch: schools F, amenities F, commute F.
- Henryetta (town): math 11% / reading 19% proficiency, ranked #228 of 270 in OK (top 84%) — low school quality limits family demand, transient renter base, plan for 1-2y turnover; 65% free/reduced lunch — lower-income household profile, screen leases tightly.
- Market conditions: 90 active listings in the ZIP; 12 units permitted in Okmulgee County in 2024 (0 in 5+ unit buildings).
Forward outlook
- In year one you build about $14k of equity ($919 loan paydown + $13k appreciation (10.0% local appreciation)).
- Okmulgee County population projected at -13% by 2050 — secular population decline; favor cash flow + early exit over multi-decade hold.
- By year 3, paydown + projected appreciation supports a ~$36k cash-out refi (75% LTV) — recoverable capital for the next deal without selling this one.
Negotiation context
- It's been on market 53 days — a 3% lower offer ($129k) is reasonable based on typical stale-listing flexibility.
- Current owner paid $48k; list at $133k implies a 177% gain — meaningful room to come down on a strong offer.
Risks & watch-outs
- Watch-outs: built in 1949 — expect roof / HVAC / electrical / plumbing capex.
- Climate carrying-cost: severe wildfire risk; extreme-heat days projected 7→19/yr by 2055 (HVAC capex compounding) — expect insurance premiums to compound above CPI over the hold.
Questions for the listing agent
- What do current leases actually rent for vs. the listed asking? Can we see a recent rent roll and the last 12 months of T-12 income?
- It's been on market 53 days. Have you received any prior offers? Is the seller open to a 34% concession, seller financing, or rate buy-down credit?
- Built in 1949 — when were the roof, HVAC, electrical panel, plumbing, and water heater last replaced?
- Is there a deadline driving the sale (1031 exchange, divorce, estate, relocation)? That informs how much negotiation room exists.
- Schools are F-rated, which usually means shorter tenancies and higher turnover. Who's the typical renter profile here, and what's been the actual vacancy rate?
- The area grade is low — what's the realistic commute time and amenity access for the typical tenant pool here? Any planned neighborhood developments (good or bad) we should know about?
- What's the average days-on-market for RENTAL listings here right now (not sales)? A rising rental-DOM trend means longer vacancies and softer asking-rent achievability than the comps imply.
- What's the recent tenant-quality profile in this submarket — average credit score on applications, eviction rate, late-payment / NSF rate, and stable-employment percentage? A property-management company in the area should have these aggregated.
- How much new for-sale + rental construction is in the pipeline within 1–3 miles? Heavy new supply typically softens prices + rents 12–24 months out; constrained supply supports both.
Investment metrics
- 1% rule
- 0.66% ✗
- Cap rate
- 5.52%
- Cash-on-cash
- -2.76%
- DSCR
- 0.88
- GRM
- 12.5
CMA / ARV
- ARV (on-the-fly)
- $79,840
- Comps found
- 9
Show comp detail 9 sales within ~0.75 mi
| Address | Dist | Beds/Ba | Sqft | Sold | Price | $/sf | Match |
|---|---|---|---|---|---|---|---|
| 1006 W Division St | 0.38mi | 2/1.0 | 936 (-6%) | 8mo | $40,000 | $43 | 61 |
| 1004 Summit St | 0.03mi | 3/1.5 (+1) | 1,112 (+11%) | 16mo | $114,500 | $103 | 60 |
| 1403 W Division St | 0.54mi | 3/1.0 (+1) | 984 (-1%) | 6mo | $110,000 | $112 | 58 |
| 903 W Broadway St | 0.64mi | 3/1.0 (+1) | 999 (+0%) | 11mo | $45,000 | $45 | 52 |
| 909 W Moore St | 0.71mi | 2/1.0 | 975 (-2%) | 10mo | $77,900 | $80 | 50 |
| 1107 W Broadway St | 0.64mi | 2/1.0 | 924 (-7%) | 9mo | $41,000 | $44 | 46 |
| 1508 Briarwood Ln | 0.68mi | 3/1.5 (+1) | 1,092 (+9%) | 5mo | $140,000 | $128 | 42 |
| 306 S 9th St | 0.74mi | 2/2.0 | 1,107 (+11%) | 7mo | $105,000 | $95 | 41 |
| 1102 W Division St | 0.39mi | 3/1.0 (+1) | 1,100 (+10%) | 24mo | $28,000 | $25 | 36 |
Match score weights: distance 35% · size 25% · config 20% · recency 20%. Top-matched comps best support the ARV.
Projected returns pro-forma
10.0% appreciation · 3.0% rent growth · sell at horizon
- IRR
- 22.3%
- Equity multiple
- 2.80×
- Total profit
- $66,867
- Equity at exit
- $119,727
- IRR
- 20.0%
- Equity multiple
- 6.40×
- Total profit
- $201,054
- Equity at exit
- $258,195
Cash invested: $37,212 (down + closing). Projections, not guarantees.
Landlord ↔ Tenant lean methodology
- Overall (STATE)
- 83 Strongly Landlord-Friendly
- State Oklahoma
- 83 Strongly Landlord-Friendly · R+20
- County
- — inherits STATE
- City
- — inherits STATE
ZIP-level market 74437
- Home prices YoY
- 23.4%
- Active inventory
- 90
- Price-to-rent
- 12.5×
Monthly cashflow live
- Estimated rent
- $883 medium interval (Pro) →
- Mortgage (P&I)
- −$697
- Tax from tax record
- −$31 /mo · $368/yr
- Insurance
- −$55
- HOA
- −$0
- Vacancy / Maint / Mgmt
- −$185
- Net cashflow
- $-85
Break-even live
Sensitivity live
| Price | -10% $-10 | -5% $-48 | +0% $-85 | +5% $-123 | +10% $-161 |
|---|---|---|---|---|---|
| Rent | -10% $-155 | -5% $-120 | +0% $-85 | +5% $-51 | +10% $-16 |
| Rate | -1.0pp $-19 | -0.5pp $-52 | base $-85 | +0.5pp $-120 | +1.0pp $-155 |
UW: 25.0% down · 7.5% · 30yr · 1.5% tax · 5.0% vac · 8.0% maint · 8.0% mgmt
Financing live
Cash to close
- Down payment
- $33,225
- Closing costs
- $3,987
- Reserves months
- —
- Total cash needed
- —
Loan-product check · same deal, 3 products live
Conventional
25% down · 7.5% · 30yr
- Down + closing
- —
- Monthly P&I
- —
- Monthly cashflow
- —
- DSCR
- —
- Eligible?
- —
Personal DTI + credit; lowest rate.
DSCR
20% down · 8.5% · 30yr
- Down + closing
- —
- Monthly P&I
- —
- Monthly cashflow
- —
- DSCR
- —
- Eligible?
- —
No personal income docs; deal must DSCR.
Hard money
10% down · 12.0% · 12mo
- Down + closing
- —
- Monthly P&I
- —
- Monthly cashflow
- —
- DSCR
- —
- Eligible?
- —
Short-term bridge; refi at stabilization.
Listing history 19 events
-
2026-06-21days on market $132,900 Active 53 DOM
-
2026-06-21days on market $132,900 Active 52 DOM
-
2026-06-18days on market $132,900 Active 50 DOM
-
2026-06-17days on market $132,900 Active 49 DOM
-
2026-06-16days on market $132,900 Active 48 DOM
-
2026-06-16days on market $132,900 Active 47 DOM
-
2026-06-13days on market $132,900 Active 45 DOM
-
2026-06-12days on market $132,900 Active 44 DOM
-
2026-06-09days on market $132,900 Active 41 DOM
-
2026-06-08days on market $132,900 Active 40 DOM
-
2026-06-08days on market $132,900 Active 39 DOM
-
2026-06-05days on market $132,900 Active 37 DOM
-
2026-06-04days on market $132,900 Active 35 DOM
-
2026-06-02days on market $132,900 Active 34 DOM
-
2026-06-01days on market $132,900 Active 33 DOM
-
2026-05-31days on market $132,900 Active 32 DOM
-
2026-04-29$132,900 Active
-
2008-05-27soldstatus $48,000
-
2006-12-21soldstatus $51,000
ⓘ Source: listings_history table (triggers on properties + properties_extension) + one-shot
backfill from property_details.listing_events for pre-trigger history.
Tax reassessment forecast OK · Resets to sale price
- Current annual tax
- $368 · $31/mo
- Projected year-2 tax
- $1,196 · $100/mo
- Expected delta
- +$828/yr (+$69/mo · 225.0%)
ⓘ Screening estimate from a state-policy table — verify with the county assessor before closing.
Climate risk First Street
- Flood 1/10 Low FEMA zone X (unshaded) · 0% chance over 30 yrs
- Wildfire 8/10 Severe
- Heat 6/10 Major 7 d/yr ≥112°F today · 19 d/yr by 30 yrs out
- Wind 3/10 Moderate 6% chance of damaging wind over 30 yrs
- Air quality 2/10 Low 1 unhealthy d/yr today · 3 by 30 yrs out
Nearby sold comps map
Loading sold comps map…
Walkable amenities ~0.75 mi
Loading nearby amenities…
Taxation est. · year 1
- Rental income
- $10,595
- − Mortgage interest
- −$7,444
- − Property taxes
- −$368
- − Insurance
- −$664
- − Repairs & maintenance
- −$848
- − Management
- −$848
- − Depreciation
- −$3,866
- Taxable loss
- −$3,443
- Est. tax savings @ 24.0%
- +$826
- After-tax cash flow
- $-199/yr
For passive investors: Depreciation is non-cash, so a rental often shows a tax loss while cash-flowing — sheltering income. Rental losses are passive: they offset passive income freely, and up to $25,000/yr can offset ordinary (W-2) income if you actively participate and your MAGI is under $100k (phasing out to $0 by $150k); unused losses carry forward. On sale, claimed depreciation is recaptured at up to 25%, and gains may owe capital-gains tax (a 1031 exchange can defer both). Figures are a year-1 estimate at your 24.0% rate — not tax advice; consult a CPA.
Schools (NCES district)
- District
- Henryetta
- NCES district ID
- 4014370
- Math proficiency
- 11% ▼ -15.00%
- Reading proficiency
- 19% ▼ -7.00%
- Median HH income
- $37,050
- Composite
- 12.5/100
- National rank
- #9624
- State rank
- #228 of 270 in OK
Livability — Henryetta
- Score
- 54/100
- State rank
- #589
- US rank
- #24020
Category grades
Schools grade is shown separately in the Schools card above.
Census & demographics
- Census place
- Henryetta, OK
- Population (ZIP)
- 9,058
Population outlook (Okmulgee County) Hauer SSP2
- Today (2025)
- 37,543 people
- By 2030
- 36,528 · -2.7%
- By 2040
- 34,430 · -8.3%
- By 2050
- 32,498 · -13.4%
- By 2075
- 28,814 · -23.3%
- By 2100
- 25,193 · -32.9%
Race, ethnicity, and origin ACS 2023
- Neighborhood character
- Diverse neighborhood (Simpson 0.60)
- Race & ethnicity
- White 63% Native American 18% Two or more races 14% Hispanic / Latino 6% Black 2%
- Hispanic origin (detail)
- Mexican 5%
- Common ancestry
- Lithuanian 2% Slovak 1% Italian 1%
- Foreign-born
- 0% · Canada
- Languages at home
- 97% English-only · Spanish 1%
Political lean MEDSL · Okmulgee
- 2024 margin
- Solid R (+42.7) · D 27.7% · R 70.4% · Other 1.9%
- 2008→2024 swing
- -25.7pp toward R · 2008: -17.0pp · 2024: -42.7pp
- All cycles
- 2024: R+42.7 2020: R+37.1 2016: R+32.7 2012: R+17.5 2008: R+17.0
Not yet ingested
- Civics
- —
Market trends
- HPI YoY
- ▲ 52.61%
- Current HPI
- 277.6291
- Rent YoY
- —
- Metro
- —
- State GDP YoY
- ▲ 1.55%
- F500 in state
- 6
Industry mix (Fortune 500 HQ in OK)
| Industry | F500 HQs | Revenue |
|---|---|---|
| Energy | 3 | $48B |
|
||
Price history
+160.6% since first listed3 events — show timeline
- 2026-04-29 Listed $132,900 MLS Technology, Inc.
- 2008-05-27 Sold (Public Records) $48,000 Public Records
- 2006-12-21 Sold (Public Records) $51,000 Public Records
Property tax history
+7.4%/yrLatest (2025): $368 · +12.9% YoY. Source: county tax records.
Cash-flow waterfall
monthlySold comps — $/sqft
last 12 mo · ≤1 miLoading sold comps…