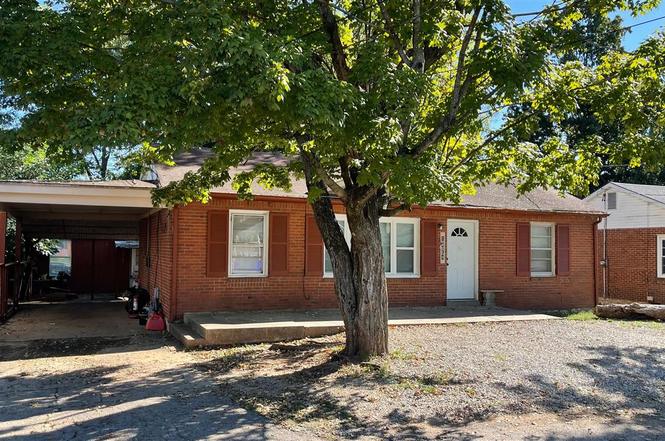
1424 Parkhurst Dr · Bowling Green, KY
Flood risk 1/10 · Minimal
- FEMA flood zone
- X (unshaded)
- Chance of flooding over 30 yrs
- 0.0%
- Est. flood insurance / yr
- $507 – $1,088
Fire risk 1/10 · Minimal
- Est. fire insurance / yr
- $839 – $1,559
Heat risk 5/10 · Moderate
- Hot days now (above 107°F)
- 7 days/yr
- Hot days in 30 yrs
- 19 days/yr
Wind risk 3/10 · Minor
- Chance of severe wind over 30 yrs
- 5.0%
Air-quality risk 1/10 · Minimal
- Unhealthy air days now
- 0 days/yr
- Unhealthy air days in 30 yrs
- 0 days/yr
Risk factors via First Street. Map © Google.
Why this score? — see what drove the F grade
The composite is a weighted blend of 9 inputs, each scored 0–100. Each bar is that input's sub-score; the figure is the points it added to the 100-point composite (weight × sub-score).
- Cash flow +6.8/30.0
- Schools +3.2/10.0
- Livability +3.2/5.0
- Rent growth +2.6/5.0
- Condition / age +2.5/5.0
- DSCR +1.0/10.0
- 1% rule +0.4/10.0
- ARV discount +0.0/15.0
- Appreciation +0.0/10.0
$209,900
🖨 Deal sheet (PDF) 📄 Offer letter ✓ Due diligence
Listing remarks
Motivated Sellers! 3 bed 1 bath home with approximately 1,018 sqft additional building featuring another 3 bed 1 bath, kitchen, dining area and living room. Ideal for extended family or rental income. "Great Investment Opportunity. "
Key facts
- 5,663 sq ft lot
- Garage
- Built 1958
Property features AI
Exterior
- Parking: Attached concrete garage with 1 parking space
- Utilities: Public water; Public sewer; Natural gas available
- Home design: Single family residence; Residential property
- Construction: Brick construction; Shingle roof
- Exterior features: Covered patio/porch; Fenced yard
Interior
- Kitchen: Microwave; Electric range; Oven
- Bedrooms: Bedrooms on main level
- Flooring: Laminate flooring; Tile flooring
- Bathrooms: Two full bathrooms (main level)
- Heating & cooling: Central air; Attic fan; Ceiling fans; Forced air heating (natural gas)
- Interior features: Covered patio/porch; Fenced yard
- Laundry & utility: Dedicated laundry room; Electric water heater
Neighborhood map
What this means for you Summary
Snapshot
- This is a 3-bed/1.0-bath single-family listed at $210k.
Deal economics
- At list price, monthly cash flow is $-330 ($-4k/yr) — negative.
- To cash-flow at today's rent, offer at most $152k (27.8% below list).
- To meet the 1% rule (rent ≥ 1% of price), the offer needs to be $114k (45.7% below list).
- Recommended offer: $114k (45.7% below list) — sets the bar for 1% rule.
- Cap rate 4.4% vs local median 3.2% in Bowling Green — top-decile yield for the area; either an underpriced asset or a hidden risk that comps aren't pricing in. Stress-test before assuming the spread holds.
Location & tenants
- Location reads 65/100 on livability (#255 in KY) — a middle-class / working-renter tenant base. Strengths: cost of living A+, housing A+; Watch: crime C-, amenities F, commute F.
- Bowling Green Independent (urban): math 37% / reading 41% proficiency, ranked #44 of 165 in KY (top 27%) — families likely to look elsewhere, expect single-tenant / working-renter base with shorter leases.
- Zoned schools: Dishman Mcginnis Elementary School (math 24% / reading 22%, grade F, #520 of 676 statewide, top 77%, 430 students, 96% FRL); Bowling Green Junior High (math 37% / reading 46%, grade F, #51 of 217 statewide, top 24%, 963 students, 65% FRL); Bowling Green High School (math 39% / reading 39%, grade F, #51 of 254 statewide, top 21%, 1,294 students, 58% FRL) — zoned schools average 73% FRL vs 53% district-wide (20 pts higher); higher-poverty schools than district average — tighter screening recommended.
- Market conditions: Rents flat; 639 active listings in the ZIP; 29 comparable units currently listed for rent nearby; rentals at typical pace (median 16d on market — plan ~3-4 weeks tenant-placement turnaround); 2,286 units permitted in Warren County in 2024 (1,410 in 5+ unit buildings).
Forward outlook
- Local home prices are declining (-3.0%/yr); year-one equity from $1k of loan paydown is wiped out by about $6k of value loss. Plan a longer hold.
- Warren County population projected at +41% by 2050 — long-run rental-demand tailwind backs the buy-and-hold thesis.
Negotiation context
- It's been on market 256 days — a 12% lower offer ($185k) is reasonable based on typical stale-listing flexibility.
- Current owner paid $160k; 31% above their basis — modest negotiation headroom, anchor on the comps not their cost.
Risks & watch-outs
- Watch-outs: built in 1958 — expect roof / HVAC / electrical / plumbing capex.
- Climate carrying-cost: extreme-heat days projected 7→19/yr by 2055 (HVAC capex compounding) — expect insurance premiums to compound above CPI over the hold.
Questions for the listing agent
- What do current leases actually rent for vs. the listed asking? Can we see a recent rent roll and the last 12 months of T-12 income?
- It's been on market 256 days. Have you received any prior offers? Is the seller open to a 46% concession, seller financing, or rate buy-down credit?
- Built in 1958 — when were the roof, HVAC, electrical panel, plumbing, and water heater last replaced?
- Why hasn't it sold? Are there any deal-killer items the seller is aware of (foundation, flood, title, zoning, code violations)?
- Is there a deadline driving the sale (1031 exchange, divorce, estate, relocation)? That informs how much negotiation room exists.
- Schools are D-rated, which usually means shorter tenancies and higher turnover. Who's the typical renter profile here, and what's been the actual vacancy rate?
- The area grade is low — what's the realistic commute time and amenity access for the typical tenant pool here? Any planned neighborhood developments (good or bad) we should know about?
- What's the average days-on-market for RENTAL listings here right now (not sales)? A rising rental-DOM trend means longer vacancies and softer asking-rent achievability than the comps imply.
- What's the recent tenant-quality profile in this submarket — average credit score on applications, eviction rate, late-payment / NSF rate, and stable-employment percentage? A property-management company in the area should have these aggregated.
- How much new for-sale + rental construction is in the pipeline within 1–3 miles? Heavy new supply typically softens prices + rents 12–24 months out; constrained supply supports both.
Investment metrics
- 1% rule
- 0.54% ✗
- Cap rate
- 4.40%
- Cash-on-cash
- -6.75%
- DSCR
- 0.70
- GRM
- 15.3
CMA / ARV
- ARV (on-the-fly)
- $140,400
- Comps found
- 12
Show comp detail 12 sales within ~0.75 mi
| Address | Dist | Beds/Ba | Sqft | Sold | Price | $/sf | Match |
|---|---|---|---|---|---|---|---|
| 1571 Virginia Dr | 0.28mi | 2/1.0 (-1) | 960 (+3%) | 5mo | $144,000 | $150 | 73 |
| 720 Glen Lily Rd | 0.33mi | 2/2.0 (-1) | 950 (+2%) | 5mo | $145,000 | $153 | 69 |
| 1640 Sharon Dr | 0.43mi | 3/2.0 | 945 (+1%) | 6mo | $145,500 | $154 | 69 |
| 1700 Johnson Dr | 0.67mi | 3/1.0 | 936 (0%) | 2mo | $105,000 | $112 | 67 |
| 1717 Media Dr | 0.51mi | 3/1.0 | 888 (-5%) | 2mo | $140,000 | $158 | 66 |
| 168 Butler Way | 0.44mi | 3/1.0 | 1,002 (+7%) | 5mo | $111,000 | $111 | 64 |
| 1409 Collegeview Dr | 0.17mi | 2/1.0 (-1) | 812 (-13%) | 2mo | $105,000 | $129 | 64 |
| 1560 Virginia Dr | 0.27mi | 2/1.0 (-1) | 832 (-11%) | 0mo | $132,500 | $159 | 64 |
| 345 Cherry Way | 0.50mi | 3/1.0 | 870 (-7%) | 3mo | $105,000 | $121 | 62 |
| 531 Dennis Way | 0.51mi | 3/1.0 | 864 (-8%) | 3mo | $117,500 | $136 | 61 |
| 1205 Westmeade Dr | 0.42mi | 3/1.0 | 1,053 (+12%) | 1mo | $160,000 | $152 | 59 |
| 1729 S Sunrise Dr | 0.56mi | 2/1.0 (-1) | 810 (-14%) | 0mo | $112,450 | $139 | 46 |
Match score weights: distance 35% · size 25% · config 20% · recency 20%. Top-matched comps best support the ARV.
Projected returns pro-forma
-3.0% appreciation · 0.28% rent growth · sell at horizon
- IRR
- -30.5%
- Equity multiple
- 0.01×
- Total profit
- $-58,211
- Equity at exit
- $31,297
- IRR
- -46.3%
- Equity multiple
- -0.53×
- Total profit
- $-90,066
- Equity at exit
- $18,148
Cash invested: $58,772 (down + closing). Projections, not guarantees.
Landlord ↔ Tenant lean methodology
- Overall (STATE)
- 83 Strongly Landlord-Friendly
- State Kentucky
- 83 Strongly Landlord-Friendly · R+16
- County
- — inherits STATE
- City
- — inherits STATE
ZIP-level market 42101
- Home prices YoY
- -20.9%
- Rents YoY
- 0.3%
- Active inventory
- 639
- Price-to-rent
- 15.3×
Monthly cashflow live
- Estimated rent
- $1,140 high interval (Pro) →
- Mortgage (P&I)
- −$1,101
- Tax from tax record
- −$43 /mo · $513/yr
- Insurance
- −$87
- HOA
- −$0
- Lot rent
- −$0
- Vacancy / Maint / Mgmt
- −$239
- Net cashflow
- $-330
Break-even live
Sensitivity live
| Price | -10% $-212 | -5% $-271 | +0% $-330 | +5% $-390 | +10% $-449 |
|---|---|---|---|---|---|
| Rent | -10% $-420 | -5% $-375 | +0% $-330 | +5% $-285 | +10% $-240 |
| Rate | -1.0pp $-225 | -0.5pp $-277 | base $-330 | +0.5pp $-385 | +1.0pp $-440 |
UW: 25.0% down · 7.5% · 30yr · 1.5% tax · 5.0% vac · 8.0% maint · 8.0% mgmt
Financing live
Cash to close
- Down payment
- $52,475
- Closing costs
- $6,297
- Reserves months
- —
- Total cash needed
- —
Loan-product check · same deal, 3 products live
Conventional
25% down · 7.5% · 30yr
- Down + closing
- —
- Monthly P&I
- —
- Monthly cashflow
- —
- DSCR
- —
- Eligible?
- —
Personal DTI + credit; lowest rate.
DSCR
20% down · 8.5% · 30yr
- Down + closing
- —
- Monthly P&I
- —
- Monthly cashflow
- —
- DSCR
- —
- Eligible?
- —
No personal income docs; deal must DSCR.
Hard money
10% down · 12.0% · 12mo
- Down + closing
- —
- Monthly P&I
- —
- Monthly cashflow
- —
- DSCR
- —
- Eligible?
- —
Short-term bridge; refi at stabilization.
Rent comps 29 comps
| Address | Beds | Baths | Sqft | Rent | $/sqft | DOM | Units | Dist |
|---|---|---|---|---|---|---|---|---|
| 1456 Longview Dr Bowling Green, KY | 2.0 | 1.0 | 826 | $950 | $1.15 | 23d | 1 | 0.05mi |
| 1625 Catherine Dr Unit A Bowling Green, KY | 2.0 | 1.0 | 850 | $800 | $0.94 | 15d | 1 | 0.35mi |
| 400 Gayle Way Bowling Green, KY | 2.0 | 1.0 | 864 | $1,250 | $1.45 | 23d | 1 | 0.39mi |
| 1733 Holly Dr Bowling Green, KY | 3.0 | 1.0 | 864 | $1,210 | $1.40 | 23d | 1 | 0.57mi |
| 1700 Johnson Dr Bowling Green, KY | 3.0 | 1.0 | 936 | $1,250 | $1.34 | 15d | 1 | 0.64mi |
| 501 Eric Ave Unit D29 Bowling Green, KY | 2.0 | 1.0 | 864 | $795 | $0.92 | 15d | 1 | 0.66mi |
| 630 Woodford Ave Unit 2 Bowling Green, KY | 2.0 | 1.0 | 650 | $850 | $1.31 | 15d | 1 | 0.85mi |
| 1059 Fair St Unit 1 Bowling Green, KY | 3.0 | 1.0 | 1002 | $800 | $0.80 | 23d | 1 | 1.00mi |
| 1044 Fair St Bowling Green, KY | 2.0 | 1.5 | 983 | $925 | $0.94 | 15d | 1 | 1.04mi |
| 100 Amy Ave #2 Bowling Green, KY | 2.0 | 1.5 | 900 | $850 | $0.94 | 15d | 1 | 1.20mi |
| 2119 Rock Creek Dr Unit A Bowling Green, KY | 2.0 | 1.0 | 880 | $875 | $0.99 | 46d | 1 | 1.24mi |
| 804 West Town Ct Bowling Green, KY | 3.0 | 1.0 | 1000 | $1,250 | $1.25 | 15d | 1 | 1.25mi |
| 2120 Creason St Apt 323 Bowling Green, KY | 2.0 | 2.0 | 1099 | $1,210 | $1.10 | 15d | 1 | 1.28mi |
| 2120 Creason St Apt 324 Bowling Green, KY | 2.0 | 2.0 | 1099 | $1,210 | $1.10 | 23d | 1 | 1.28mi |
| 261 Audley Ave Bowling Green, KY | 2.0 | 2.5 | 944 | $1,095 | $1.16 | 46d | 1 | 1.29mi |
| 171 Devin Close Ct Bowling Green, KY | 3.0 | 1.5 | 1000 | $1,400 | $1.40 | 23d | 1 | 1.31mi |
| 424 Jennings Ct Unit 2 Bowling Green, KY | 2.0 | 1.5 | 1100 | $800 | $0.73 | 23d | 1 | 1.32mi |
| 1607 U.S. 31 West Byp Unit 1720-A03 Bowling Green, KY | 2.0 | 2.0 | 929 | $1,025 | $1.10 | 23d | 1 | 1.35mi |
| 2244 Hickory St Bowling Green, KY | 2.0 | 2.0 | 1000 | $2,300 | $2.30 | 15d | 2 | 1.36mi |
| — , KY | 2.0 | 2.0 | 1100 | $1,250 | $1.14 | 15d | 1 | 1.36mi |
| 314 Audley Ave Bowling Green, KY | 2.0 | 2.0 | 980 | $950 | $0.97 | 15d | 1 | 1.40mi |
| 1530 Kenton St Bowling Green, KY | 3.0 | 1.0 | 975 | $1,300 | $1.33 | 15d | 1 | 1.41mi |
| 179 Walnut Creek Dr Bowling Green, KY | 1.0–3.0 | 1.0–2.0 | 1001 | $1,200 | $1.20 | 15d | 11 | 1.46mi |
| 179 Walnut Creek Dr Unit 215 Bowling Green, KY | 2.0 | 1.0 | 950 | $1,000 | $1.05 | 23d | 1 | 1.46mi |
| 2146 Prospector Ct Apt 2512 Bowling Green, KY | 2.0 | 2.0 | 980 | $995 | $1.02 | 15d | 1 | 1.46mi |
| 2212 Hickory St Bowling Green, KY | 2.0 | 2.0 | 1000 | $2,300 | $2.30 | 15d | 1 | 1.47mi |
| 2220 Hickory St Apt 223 Bowling Green, KY | 2.0 | 2.0 | 1000 | $1,100 | $1.10 | 46d | 1 | 1.48mi |
| 2220 Hickory St Apt 221 Bowling Green, KY | 2.0 | 2.0 | 1000 | $2,300 | $2.30 | 46d | 1 | 1.48mi |
| 2151 Prospector Ct Apt 2022 Bowling Green, KY | 2.0 | 2.0 | 980 | $1,100 | $1.12 | 15d | 1 | 1.49mi |
Listing history 23 events
-
2026-06-23days on market $209,900 Active 256 DOM
-
2026-06-21days on market $209,900 Active 255 DOM
-
2026-06-19days on market $209,900 Active 253 DOM
-
2026-06-18days on market $209,900 Active 252 DOM
-
2026-06-17days on market $209,900 Active 251 DOM
-
2026-06-16days on market $209,900 Active 250 DOM
-
2026-06-15days on market $209,900 Active 249 DOM
-
2026-06-14days on market $209,900 Active 247 DOM
-
2026-06-13days on market $209,900 Active 246 DOM
-
2026-06-10days on market $209,900 Active 244 DOM
-
2026-06-09days on market $209,900 Active 243 DOM
-
2026-06-08days on market $209,900 Active 242 DOM
-
2026-06-07days on market $209,900 Active 241 DOM
-
2026-06-02days on market $209,900 Active 236 DOM
-
2026-06-01days on market $209,900 Active 235 DOM
-
2026-05-31days on market $209,900 Active 234 DOM
-
2026-05-30days on market $209,900 Active 233 DOM
-
2026-04-14price $209,900
-
2026-03-06price $219,000
-
2026-01-15price $229,000
-
2025-12-08price $235,000
-
2025-10-08$295,000 Active
-
2023-06-20soldstatus $160,000
ⓘ Source: listings_history table (triggers on properties + properties_extension) + one-shot
backfill from property_details.listing_events for pre-trigger history.
Tax reassessment forecast KY · Resets to sale price
- Current annual tax
- $513 · $43/mo
- Projected year-2 tax
- $1,805 · $150/mo
- Expected delta
- +$1,292/yr (+$108/mo · 252.0%)
ⓘ Screening estimate from a state-policy table — verify with the county assessor before closing.
Climate risk First Street
- Flood 1/10 Low FEMA zone X (unshaded) · 0% chance over 30 yrs
- Wildfire 1/10 Low
- Heat 5/10 Major 7 d/yr ≥107°F today · 19 d/yr by 30 yrs out
- Wind 3/10 Moderate 5% chance of damaging wind over 30 yrs
- Air quality 1/10 Low 0 unhealthy d/yr today · 0 by 30 yrs out
Nearby sold comps map
Loading sold comps map…
Walkable amenities ~0.75 mi
Loading nearby amenities…
Taxation est. · year 1
- Rental income
- $13,679
- − Mortgage interest
- −$11,758
- − Property taxes
- −$513
- − Insurance
- −$1,050
- − Repairs & maintenance
- −$1,094
- − Management
- −$1,094
- − Depreciation
- −$6,106
- Taxable loss
- −$7,936
- Est. tax savings @ 24.0%
- +$1,905
- After-tax cash flow
- $-2,060/yr
For passive investors: Depreciation is non-cash, so a rental often shows a tax loss while cash-flowing — sheltering income. Rental losses are passive: they offset passive income freely, and up to $25,000/yr can offset ordinary (W-2) income if you actively participate and your MAGI is under $100k (phasing out to $0 by $150k); unused losses carry forward. On sale, claimed depreciation is recaptured at up to 25%, and gains may owe capital-gains tax (a 1031 exchange can defer both). Figures are a year-1 estimate at your 24.0% rate — not tax advice; consult a CPA.
Schools (NCES district)
- District
- Bowling Green Independent
- NCES district ID
- 2100570
- Math proficiency
- 37% ▼ -11.00%
- Reading proficiency
- 41% ▼ -15.00%
- Median HH income
- $31,181
- Composite
- 31.86/100
- National rank
- #5870
- State rank
- #44 of 165 in KY
Livability — Bowling Green
- Score
- 65/100
- State rank
- #255
- US rank
- #12782
Category grades
Schools grade is shown separately in the Schools card above.
Census & demographics
- Census place
- Bowling Green, KY
- County
- Warren County · 129,408 people
- City population
- 129,408
- Metro
- Bowling Green, KY
- Population (ZIP)
- 65,421
- Household income
- $48,217
- Rent vs Own
- Severe rent burden
- 3855.0
Population outlook (Warren County) Hauer SSP2
- Today (2025)
- 144,620 people
- By 2030
- 155,977 · +7.9%
- By 2040
- 179,381 · +24.0%
- By 2050
- 203,713 · +40.9%
- By 2075
- 267,291 · +84.8%
- By 2100
- 314,019 · +117.1%
Race, ethnicity, and origin ACS 2023
- Neighborhood character
- Predominantly White (68%)
- Race & ethnicity
- White 68% Black 13% Hispanic / Latino 10% Two or more races 7% Asian 3%
- Hispanic origin (detail)
- Mexican 6%
- Common ancestry
- Slovak 2% American 1% Italian 1%
- Foreign-born
- 10% · Canada, Philippines
- Languages at home
- 84% English-only · Spanish 8% Other Asian/Pacific 2% Russian/Polish/Slavic 2%
Political lean MEDSL · Warren
- 2024 margin
- Strong R (+24.3) · D 37.0% · R 61.3% · Other 1.6%
- 2008→2024 swing
- -5.4pp toward R · 2008: -18.9pp · 2024: -24.3pp
- All cycles
- 2024: R+24.3 2020: R+16.8 2016: R+24.2 2012: R+21.8 2008: R+18.9
Not yet ingested
- Civics
- —
Market trends
- HPI YoY
- ▼ -73.34%
- Current HPI
- 277.6554
- Rent YoY
- ▲ 0.28%
- Metro
- Bowling Green, KY
- State GDP YoY
- ▲ 1.81%
- F500 in state
- 4
Industry mix (Fortune 500 HQ in KY)
| Industry | F500 HQs | Revenue |
|---|---|---|
| Healthcare | 1 | $118B |
|
||
| Food / Beverage | 1 | $7B |
|
||
Price history
+31.2% since first listed6 events — show timeline
- 2026-04-14 Price Changed $209,900 RASKMLS
- 2026-03-06 Price Changed $219,000 RASKMLS
- 2026-01-15 Price Changed $229,000 RASKMLS
- 2025-12-08 Price Changed $235,000 RASKMLS
- 2025-10-08 Listed $295,000 RASKMLS
- 2023-06-20 Sold (Public Records) $160,000 Public Records
Property tax history
+6.0%/yrLatest (2025): $513 · -2.4% YoY. Source: county tax records.
Cash-flow waterfall
monthlySold comps — $/sqft
last 12 mo · ≤1 miLoading sold comps…