3308 7th St · Tuscaloosa, AL
Flood risk 1/10 · Minimal
- FEMA flood zone
- X (unshaded)
- Chance of flooding over 30 yrs
- 0.0%
- Est. flood insurance / yr
- $507 – $1,088
Fire risk 2/10 · Minimal
- Est. fire insurance / yr
- $916 – $1,700
Heat risk 7/10 · Major
- Hot days now (above 108°F)
- 7 days/yr
- Hot days in 30 yrs
- 20 days/yr
Wind risk 6/10 · Moderate
- Chance of severe wind over 30 yrs
- 59.0%
Air-quality risk 1/10 · Minimal
- Unhealthy air days now
- 0 days/yr
- Unhealthy air days in 30 yrs
- 0 days/yr
Risk factors via First Street. Map © Google.
Why this score? — see what drove the D+ grade
The composite is a weighted blend of 9 inputs, each scored 0–100. Each bar is that input's sub-score; the figure is the points it added to the 100-point composite (weight × sub-score).
- Cash flow +15.0/30.0
- ARV discount +7.5/15.0
- 1% rule +5.0/10.0
- DSCR +5.0/10.0
- Rent growth +4.1/5.0
- Livability +3.9/5.0
- Schools +2.5/10.0
- Condition / age +2.5/5.0
- Appreciation +0.0/10.0
$33,900
🖨 Deal sheet (PDF) 📄 Offer letter ✓ Due diligence
Listing remarks MLS
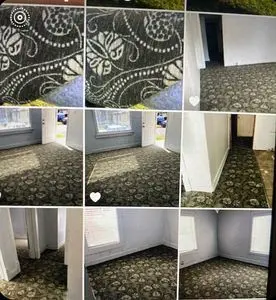
Amazing investment opportunity! Come check out this spacious 3 bed, 2 bath home! Lots of potential! Was previously rented out.
Key facts
- Huge backyard
- Built 1940
- Listed 26 days
Tags
Neighborhood map
What this means for you Summary
Snapshot
- This is a 2-bed/2.0-bath single-family listed at $34k.
Deal economics
- At list price, monthly cash flow is $849 ($10k/yr) — positive.
- The deal already cash-flows at list — no discount required.
- Meets the 1% rule at list price ($1k rent vs $34k).
- Recommended offer: $33k (1.5% below list) — sets the bar for market timing.
- Cap rate 36.4% vs local median 3.4% in Tuscaloosa — top-decile yield for the area; either an underpriced asset or a hidden risk that comps aren't pricing in. Stress-test before assuming the spread holds.
Location & tenants
- Location reads 77/100 on livability (#9 in AL, #2,909 nationally) — a middle-class / working-renter tenant base. Strengths: amenities A+, health & safety A+, cost of living A; Watch: crime F, employment D-.
- Tuscaloosa City (urban): math 19% / reading 40% proficiency, ranked #74 of 129 in AL (top 57%) — low school quality limits family demand, transient renter base, plan for 1-2y turnover.
- Zoned schools: Verner Elementary School (math 49% / reading 75%, grade B, #53 of 627 statewide, top 9%, 629 students, 19% FRL); Northridge Middle School (math 29% / reading 57%, grade D-, #48 of 257 statewide, top 19%, 740 students, 39% FRL); Northridge High School (math 40% / reading 42%, grade F, #31 of 305 statewide, top 10%, 1,145 students, 35% FRL) — zoned schools average 31% FRL vs 59% district-wide (28 pts lower); this property's tenant base skews higher-income than the district average.
- Zoned-school proficiency averages 49% at this address vs 30% district-wide (+19 pts) — the actual schools serving this property are materially stronger than the Tuscaloosa City average implies; a family-tenant draw the district grade alone would hide.
- Market conditions: Rents rising fast (+6.3%/yr); 307 active listings in the ZIP; 8 comparable units currently listed for rent nearby; rentals at typical pace (median 23d on market — plan ~3-4 weeks tenant-placement turnaround); lower-income renter base — watch delinquency; 622 units permitted in Tuscaloosa County in 2024 (69 in 5+ unit buildings).
Forward outlook
- Local home prices are declining (-3.0%/yr); year-one equity from $234 of loan paydown is wiped out by about $1k of value loss. Plan a longer hold.
- Tuscaloosa County population projected at +26% by 2050 — long-run rental-demand tailwind backs the buy-and-hold thesis.
- At projected returns (-3.0% appreciation + 6.3% rent growth), your $9k cash investment doubles in ~2 years — after that, you're playing with house money.
Negotiation context
- It's been on market 26 days — a 2% lower offer ($33k) is reasonable based on typical stale-listing flexibility.
- 3 sale attempts since 4y ago with the ask held roughly flat each time — persistent listings suggest the price (not the market) is what's stuck; bring a comps-based counter.
Risks & watch-outs
- Watch-outs: property tax is 2.8% of price; built in 1940 — expect roof / HVAC / electrical / plumbing capex.
- Climate carrying-cost: major wind risk, 59% chance of damaging wind over 30y; extreme-heat days projected 7→20/yr by 2055 (HVAC capex compounding) — expect insurance premiums to compound above CPI over the hold.
Questions for the listing agent
- Built in 1940 — when were the roof, HVAC, electrical panel, plumbing, and water heater last replaced?
- Property tax is high relative to price — has the assessment been appealed recently, and will the sale trigger a re-assessment?
- Is there a deadline driving the sale (1031 exchange, divorce, estate, relocation)? That informs how much negotiation room exists.
- Crime grade is F in this area — have there been break-ins, vandalism, or insurance claims at this property in the last 3 years? What carrier currently insures it and at what premium?
- The area grade is low — what's the realistic commute time and amenity access for the typical tenant pool here? Any planned neighborhood developments (good or bad) we should know about?
- What's the average days-on-market for RENTAL listings here right now (not sales)? A rising rental-DOM trend means longer vacancies and softer asking-rent achievability than the comps imply.
- What's the recent tenant-quality profile in this submarket — average credit score on applications, eviction rate, late-payment / NSF rate, and stable-employment percentage? A property-management company in the area should have these aggregated.
- How much new for-sale + rental construction is in the pipeline within 1–3 miles? Heavy new supply typically softens prices + rents 12–24 months out; constrained supply supports both.
Investment metrics
- 1% rule
- 4.19% ✓
- Cap rate
- 36.36%
- Cash-on-cash
- 107.39%
- DSCR
- 5.78
- GRM
- 2.0
CMA / ARV
- ARV (on-the-fly)
- $181,151
- Comps found
- 6
Show comp detail 6 sales within ~0.75 mi
| Address | Dist | Beds/Ba | Sqft | Sold | Price | $/sf | Match |
|---|---|---|---|---|---|---|---|
| 934 35th Ave | 0.30mi | 3/1.0 (+1) | 1,584 (-6%) | 0mo | $100,000 | $63 | 66 |
| 600 34th Ave | 0.08mi | 2/2.0 | 1,471 (-13%) | 11mo | $157,381 | $107 | 65 |
| 11 Country Club Circle Cir | 0.44mi | 3/2.0 (+1) | 1,587 (-6%) | 11mo | $281,000 | $177 | 55 |
| 4A Country Club Hls | 0.44mi | 3/2.0 (+1) | 1,552 (-8%) | 13mo | $195,000 | $126 | 50 |
| 912 36th Ave | 0.34mi | 3/2.0 (+1) | 1,890 (+12%) | 22mo | $189,000 | $100 | 41 |
| 2842 18th St | 0.68mi | 3/1.5 (+1) | 1,814 (+7%) | 16mo | $15,000 | $8 | 36 |
Match score weights: distance 35% · size 25% · config 20% · recency 20%. Top-matched comps best support the ARV.
Projected returns pro-forma
-3.0% appreciation · 6.29% rent growth · sell at horizon
- IRR
- —
- Equity multiple
- 6.64×
- Total profit
- $53,505
- Equity at exit
- $5,055
- IRR
- —
- Equity multiple
- 15.51×
- Total profit
- $137,740
- Equity at exit
- $2,931
Cash invested: $9,492 (down + closing). Projections, not guarantees.
Landlord ↔ Tenant lean methodology
- Overall (STATE)
- 90 Strongly Landlord-Friendly
- State Alabama
- 90 Strongly Landlord-Friendly · R+15
- County
- — inherits STATE
- City
- — inherits STATE
ZIP-level market 35401
- Rents YoY
- 6.3%
- Active inventory
- 307
- Price-to-rent
- 2.0×
Monthly cashflow live
- Estimated rent
- $1,419 high interval (Pro) →
- Mortgage (P&I)
- −$178
- Tax from tax record
- −$80 /mo · $956/yr
- Insurance
- −$14
- HOA
- −$0
- Vacancy / Maint / Mgmt
- −$298
- Net cashflow
- $849
Break-even live
Sensitivity live
| Price | -10% $869 | -5% $859 | +0% $849 | +5% $840 | +10% $830 |
|---|---|---|---|---|---|
| Rent | -10% $737 | -5% $793 | +0% $849 | +5% $905 | +10% $962 |
| Rate | -1.0pp $867 | -0.5pp $858 | base $849 | +0.5pp $841 | +1.0pp $832 |
UW: 25.0% down · 7.5% · 30yr · 1.5% tax · 5.0% vac · 8.0% maint · 8.0% mgmt
Financing live
Cash to close
- Down payment
- $8,475
- Closing costs
- $1,017
- Reserves months
- —
- Total cash needed
- —
Loan-product check · same deal, 3 products live
Conventional
25% down · 7.5% · 30yr
- Down + closing
- —
- Monthly P&I
- —
- Monthly cashflow
- —
- DSCR
- —
- Eligible?
- —
Personal DTI + credit; lowest rate.
DSCR
20% down · 8.5% · 30yr
- Down + closing
- —
- Monthly P&I
- —
- Monthly cashflow
- —
- DSCR
- —
- Eligible?
- —
No personal income docs; deal must DSCR.
Hard money
10% down · 12.0% · 12mo
- Down + closing
- —
- Monthly P&I
- —
- Monthly cashflow
- —
- DSCR
- —
- Eligible?
- —
Short-term bridge; refi at stabilization.
Rent comps 8 comps
| Address | Beds | Baths | Sqft | Rent | $/sqft | DOM | Units | Dist |
|---|---|---|---|---|---|---|---|---|
| 3316 16th St Tuscaloosa, AL | 3.0 | 1.0 | 1120 | $1,100 | $0.98 | 15d | 1 | 0.37mi |
| 3524 20th St Tuscaloosa, AL | 3.0 | 1.0 | 1050 | $1,100 | $1.05 | 46d | 1 | 0.75mi |
| 3560 21st St Tuscaloosa, AL | 3.0 | 2.0 | 1230 | $1,570 | $1.28 | 23d | 1 | 0.80mi |
| 2209 9th St #401 Tuscaloosa, AL | 2.0 | 2.0 | 1304 | $1,650 | $1.27 | 46d | 1 | 0.85mi |
| 1018 42nd Ave Tuscaloosa, AL | 3.0 | 1.0 | 1080 | $1,375 | $1.27 | 15d | 1 | 0.92mi |
| 2683 21st St Tuscaloosa, AL | 3.0 | 1.0 | 1324 | $895 | $0.68 | 23d | 1 | 1.04mi |
| 301 19th Ave Tuscaloosa, AL | 2.0 | 2.5 | 1200 | $2,200 | $1.83 | 23d | 1 | 1.15mi |
| 201 Marina Dr Tuscaloosa, AL | 1.0–3.0 | 1.0–2.0 | 1099 | $1,372 | $1.25 | 15d | 1 | 1.45mi |
Listing history 27 events
-
2026-06-21days on market $33,900 Active 26 DOM
-
2026-06-18days on market $33,900 Active 23 DOM
-
2026-06-17days on market $33,900 Active 22 DOM
-
2026-06-16days on market $33,900 Active 21 DOM
-
2026-06-15days on market $33,900 Active 20 DOM
-
2026-06-14days on market $33,900 Active 18 DOM
-
2026-06-13days on market $33,900 Active 17 DOM
-
2026-06-10days on market $33,900 Active 15 DOM
-
2026-06-09days on market $33,900 Active 14 DOM
-
2026-06-08days on market $33,900 Active 13 DOM
-
2026-06-07days on market $33,900 Active 12 DOM
-
2026-06-05days on market $33,900 Active 9 DOM
-
2026-06-03days on market $33,900 Active 8 DOM
-
2026-06-02days on market $33,900 Active 7 DOM
-
2026-06-01days on market $33,900 Active 6 DOM
-
2026-05-31days on market $33,900 Active 5 DOM
-
2026-05-30days on market $33,900 Active 4 DOM
-
2026-05-26$33,900 Active
-
2023-07-22soldstatus $253,500
-
2023-06-20soldstatus $100,000 Closed 126-char remark
Show marketing remark (126 chars)
Amazing investment opportunity! Come check out this spacious 3 bed, 2 bath home! Lots of potential! Was previously rented out.
-
2023-06-20soldstatus $100,000
Show marketing remark (126 chars)
Amazing investment opportunity! Come check out this spacious 3 bed, 2 bath home! Lots of potential! Was previously rented out.
-
2023-05-26status Pending 126-char remark
Show marketing remark (126 chars)
Amazing investment opportunity! Come check out this spacious 3 bed, 2 bath home! Lots of potential! Was previously rented out.
-
2023-05-16$105,000 Active 126-char remark
Show marketing remark (126 chars)
Amazing investment opportunity! Come check out this spacious 3 bed, 2 bath home! Lots of potential! Was previously rented out.
-
2022-09-29soldstatus $84,000
-
2022-09-20soldstatus $84,000 Closed 202-char remark
Show marketing remark (202 chars)
LOTS OF SPACE. 1749 SQ FOOT BRICK HOME. 3 BEDROOMS, 2 FULL BATHS. Cash or conventional financing only. Estate settlement being sold "AS IS WHERE IS". Month to month lease. Current rent is $640
-
2022-07-29status Pending 202-char remark
Show marketing remark (202 chars)
LOTS OF SPACE. 1749 SQ FOOT BRICK HOME. 3 BEDROOMS, 2 FULL BATHS. Cash or conventional financing only. Estate settlement being sold "AS IS WHERE IS". Month to month lease. Current rent is $640
-
2022-02-16$84,000 Active 202-char remark
Show marketing remark (202 chars)
LOTS OF SPACE. 1749 SQ FOOT BRICK HOME. 3 BEDROOMS, 2 FULL BATHS. Cash or conventional financing only. Estate settlement being sold "AS IS WHERE IS". Month to month lease. Current rent is $640
ⓘ Source: listings_history table (triggers on properties + properties_extension) + one-shot
backfill from property_details.listing_events for pre-trigger history.
Tax reassessment forecast AL · Resets to sale price
- Current annual tax
- $956 · $80/mo
- Projected year-2 tax
- $956 · $80/mo
- Expected delta
- $0/yr ($0/mo · 0.0%)
ⓘ Screening estimate from a state-policy table — verify with the county assessor before closing.
Climate risk First Street
- Flood 1/10 Low FEMA zone X (unshaded) · 0% chance over 30 yrs
- Wildfire 2/10 Low
- Heat 7/10 Severe 7 d/yr ≥108°F today · 20 d/yr by 30 yrs out
- Wind 6/10 Major 59% chance of damaging wind over 30 yrs
- Air quality 1/10 Low 0 unhealthy d/yr today · 0 by 30 yrs out
Nearby sold comps map
Loading sold comps map…
Walkable amenities ~0.75 mi
Loading nearby amenities…
Taxation est. · year 1
- Rental income
- $17,028
- − Mortgage interest
- −$1,899
- − Property taxes
- −$956
- − Insurance
- −$170
- − Repairs & maintenance
- −$1,362
- − Management
- −$1,362
- − Depreciation
- −$986
- Taxable income
- $10,293
- Est. tax owed @ 24.0%
- −$2,470
- After-tax cash flow
- $7,723/yr
For passive investors: Depreciation is non-cash, so a rental often shows a tax loss while cash-flowing — sheltering income. Rental losses are passive: they offset passive income freely, and up to $25,000/yr can offset ordinary (W-2) income if you actively participate and your MAGI is under $100k (phasing out to $0 by $150k); unused losses carry forward. On sale, claimed depreciation is recaptured at up to 25%, and gains may owe capital-gains tax (a 1031 exchange can defer both). Figures are a year-1 estimate at your 24.0% rate — not tax advice; consult a CPA.
Schools (NCES district)
- District
- Tuscaloosa City
- NCES district ID
- 0103360
- Math proficiency
- 19% ▼ -24.00%
- Reading proficiency
- 40% ▼ -1.00%
- Median HH income
- $37,474
- Composite
- 24.51/100
- National rank
- #7647
- State rank
- #74 of 129 in AL
Livability — Tuscaloosa
- Score
- 77/100
- State rank
- #9
- US rank
- #2909
Category grades
Schools grade is shown separately in the Schools card above.
Census & demographics
- Census place
- Tuscaloosa, AL
- County
- Tuscaloosa County · 206,491 people
- City population
- 134,228
- Metro
- Tuscaloosa, AL
- Population (ZIP)
- 43,459
- Household income
- $29,152
- Rent vs Own
- Severe rent burden
- 3997.0
Population outlook (Tuscaloosa County) Hauer SSP2
- Today (2025)
- 228,293 people
- By 2030
- 240,551 · +5.4%
- By 2040
- 263,856 · +15.6%
- By 2050
- 286,491 · +25.5%
- By 2075
- 335,783 · +47.1%
- By 2100
- 370,520 · +62.3%
Race, ethnicity, and origin ACS 2023
- Neighborhood character
- Diverse neighborhood (Simpson 0.58)
- Race & ethnicity
- Black 47% White 44% Hispanic / Latino 5% Two or more races 4% Asian 2%
- Common ancestry
- Slovak 2% Italian 1% Romanian 1%
- Foreign-born
- 3% · Canada, China
- Languages at home
- 96% English-only · Spanish 2% Other Indo-European 1% Chinese 1%
Political lean MEDSL · Tuscaloosa
- 2024 margin
- Strong R (+20.4) · D 39.4% · R 59.8%
- 2008→2024 swing
- -4.4pp toward R · 2008: -16.0pp · 2024: -20.4pp
- All cycles
- 2024: R+20.4 2020: R+14.8 2016: R+19.5 2012: R+17.4 2008: R+16.0
Not yet ingested
- Civics
- —
Market trends
- HPI YoY
- ▼ -191.40%
- Current HPI
- 179.8335
- Rent YoY
- ▲ 6.29%
- Metro
- Tuscaloosa, AL
- State GDP YoY
- ▲ 2.94%
- F500 in state
- 4
Industry mix (Fortune 500 HQ in AL)
| Industry | F500 HQs | Revenue |
|---|---|---|
| Financial Services | 1 | $8B |
|
||
| Healthcare | 1 | $5B |
|
||
Price history
-59.6% since first listed10 events — show timeline
- 2026-05-26 Listed $33,900 FSBO.com
- 2023-07-22 Sold (Public Records) $253,500 Public Records
- 2023-06-20 Sold (Public Records) $100,000 Public Records
- 2023-06-20 Sold (MLS) $100,000 WAMLS
- 2023-05-26 Pending — WAMLS
- 2023-05-16 Listed $105,000 WAMLS
- 2022-09-29 Sold (Public Records) $84,000 Public Records
- 2022-09-20 Sold (MLS) $84,000 WAMLS
- 2022-07-29 Pending — WAMLS
- 2022-02-16 Listed $84,000 WAMLS
Property tax history
+1.9%/yrLatest (2025): $956 · +6.9% YoY. Source: county tax records.
Cash-flow waterfall
monthlySold comps — $/sqft
last 12 mo · ≤1 miLoading sold comps…