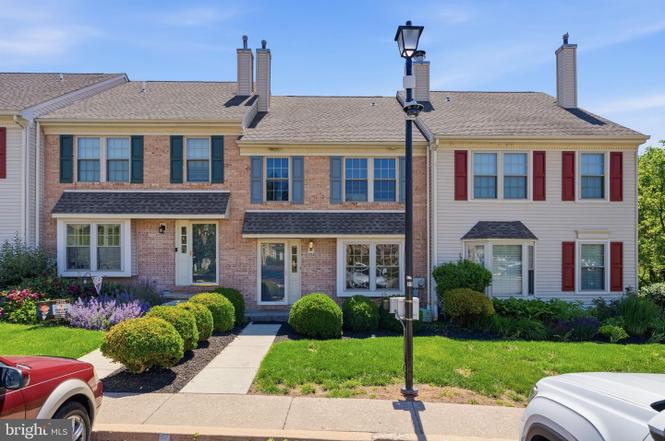
1264 Maple Glen Cir · Lower Pottsgrove, PA
Flood risk 7/10 · Major
- FEMA flood zone
- X (unshaded)
- Chance of flooding over 30 yrs
- 0.99%
- Est. flood insurance / yr
- $473 – $860
Fire risk 2/10 · Minimal
- Est. fire insurance / yr
- $511 – $949
Heat risk 6/10 · Moderate
- Hot days now (above 102°F)
- 7 days/yr
- Hot days in 30 yrs
- 15 days/yr
Wind risk 5/10 · Moderate
- Chance of severe wind over 30 yrs
- 23.0%
Air-quality risk 2/10 · Minimal
- Unhealthy air days now
- 1 days/yr
- Unhealthy air days in 30 yrs
- 3 days/yr
Risk factors via First Street. Map © Google.
Why this score? — see what drove the C+ grade
The composite is a weighted blend of 9 inputs, each scored 0–100. Each bar is that input's sub-score; the figure is the points it added to the 100-point composite (weight × sub-score).
- Cash flow +25.2/30.0
- 1% rule +9.9/10.0
- DSCR +8.3/10.0
- ARV discount +7.5/15.0
- Rent growth +3.7/5.0
- Schools +3.6/10.0
- Livability +2.5/5.0
- Condition / age +2.5/5.0
- Appreciation +0.0/10.0
$150,000
🖨 Deal sheet 📄 Offer letter ✓ Due diligence
Listing remarks
LIVE Public Real Estate Auction will be held on Tuesday, July 14th at 7:00pm - Please note: price listed does not reflect the price the property will sell for at auction, it was added for listing and search purposes only. Move right into this updated 4-bedroom, 2.5-bath townhome located in the desirable Maple Glen community. Offering multiple levels of living space, this home features a flexible floor plan with a finished walk-out basement that includes a fourth bedroom and full bath—ideal for guests, extended family, a home office, or recreation space. The main level features a bright and functional layout with a convenient half bath and access to a private rear deck directly off th
Key facts
- Flexible floor plan
- Updated townhome
- Private rear deck
Tags
Property features AI
Finance
- HOA & community: HOA fee of $220 per month
Exterior
- Parking: Parking lot
- Utilities: Electric cooling fuel; Natural gas hot water; Public water; Public sewer
- Home design: Interior townhouse/rowhouse; Fee simple ownership; Above-grade finished area of about 1,224 (per assessor); Below-grade finished area of about 450 (per assessor)
- Construction: Vinyl siding; Block foundation; Estimated year built
- Exterior features: Public water and public sewer
Interior
- Bedrooms: Four bedrooms on the main level
- Bathrooms: Two full bathrooms; One half bathroom
- Heating & cooling: Forced air heating; Central air conditioning; Natural gas for heating and hot water
- Interior features: Finished basement with walkout level
Neighborhood map
What this means for you Summary
Snapshot
- This is a 3-bed/2.5-bath townhouse listed at $150k.
Deal economics
- At list price, monthly cash flow is $281 ($3k/yr) — positive.
- The deal already cash-flows at list — no discount required.
- Meets the 1% rule at list price ($2k rent vs $150k).
Location & tenants
- Location reads: area grade C — affects rentability + tenant quality, not the cash-flow math above.
- Pottsgrove SD (suburban): math 29% / reading 50% proficiency, ranked #318 of 539 in PA (top 59%) — families likely to look elsewhere, expect single-tenant / working-renter base with shorter leases.
- Market conditions: Rents rising fast (+4.9%/yr); 202 active listings in the ZIP; 12 comparable units currently listed for rent nearby; rentals leasing fast (median 5d on market — plan ~1-2 weeks tenant-placement turnaround); solid renter incomes; 1,936 units permitted in Montgomery County in 2024 (530 in 5+ unit buildings).
- This rent runs 34% of the median local income ($80k/yr) — at the standard rent-burdened threshold; future hikes will face affordability resistance.
Forward outlook
- Local home prices are declining (-3.0%/yr); year-one equity from $1k of loan paydown is wiped out by about $4k of value loss. Plan a longer hold.
- Montgomery County population projected at +5% by 2050 — modest demand growth; plan on rents tracking national, not racing it.
- At projected returns (-3.0% appreciation + 4.9% rent growth), your $42k cash investment doubles in ~10 years — after that, you're playing with house money.
Negotiation context
- Only 3 days on market — expect competitive offers; lowballing is unlikely to land.
- 4 sale attempts since 24y ago with the ask held roughly flat each time — persistent listings suggest the price (not the market) is what's stuck; bring a comps-based counter.
- Current owner paid $102k; 47% above their basis — modest negotiation headroom, anchor on the comps not their cost.
Risks & watch-outs
- Watch-outs: property tax is 2.9% of price; flood insurance adds $56/mo.
- Climate carrying-cost: major flood risk; moderate wind risk, 23% chance of damaging wind over 30y; extreme-heat days projected 7→15/yr by 2055 (HVAC capex compounding) — expect insurance premiums to compound above CPI over the hold.
Questions for the listing agent
- Property tax is high relative to price — has the assessment been appealed recently, and will the sale trigger a re-assessment?
- What's the actual annual flood-insurance premium (NFIP or private), and is the property in a SFHA with mandatory coverage?
- What does the HOA fee cover, when was the last increase, and are there any pending special assessments or reserve-fund shortfalls?
- Is there a deadline driving the sale (1031 exchange, divorce, estate, relocation)? That informs how much negotiation room exists.
- What's the average days-on-market for RENTAL listings here right now (not sales)? A rising rental-DOM trend means longer vacancies and softer asking-rent achievability than the comps imply.
- What's the recent tenant-quality profile in this submarket — average credit score on applications, eviction rate, late-payment / NSF rate, and stable-employment percentage? A property-management company in the area should have these aggregated.
- How much new for-sale + rental construction is in the pipeline within 1–3 miles? Heavy new supply typically softens prices + rents 12–24 months out; constrained supply supports both.
Investment metrics
- 1% rule
- 1.49% ✓
- Cap rate
- 8.99%
- Cash-on-cash
- 9.62%
- DSCR
- 1.43
- GRM
- 5.6
CMA / ARV
- ARV (on-the-fly)
- $331,452
- Comps found
- 12
Show comp detail 12 sales within ~0.75 mi
| Address | Dist | Beds/Ba | Sqft | Sold | Price | $/sf | Match |
|---|---|---|---|---|---|---|---|
| 103 Hollytree Ct | 0.08mi | 3/2.5 | 1,790 (+7%) | 0mo | $305,000 | $170 | 84 |
| 1263 Maple Glen Cir | 0.00mi | 3/2.5 | 1,756 (+5%) | 11mo | $321,000 | $183 | 83 |
| 1053 Maple Glen Cir | 0.04mi | 3/1.5 | 1,584 (-5%) | 9mo | $285,000 | $180 | 78 |
| 53 Brookview Ln | 0.46mi | 3/2.5 | 1,675 (+0%) | 6mo | $365,000 | $218 | 73 |
| 631 Dogwood Ct | 0.29mi | 3/2.5 | 1,540 (-8%) | 10mo | $305,000 | $198 | 65 |
| 207 Cherrywood Ct | 0.34mi | 3/2.5 | 1,862 (+11%) | 2mo | $320,000 | $172 | 64 |
| 418 Maple Glen Cir | 0.12mi | 2/1.5 (-1) | 1,426 (-15%) | 5mo | $267,000 | $187 | 56 |
| 1054 Maple Glen Cir | 0.04mi | 2/1.5 (-1) | 1,426 (-15%) | 11mo | $300,000 | $210 | 55 |
| 5 Creekside Dr | 0.54mi | 3/1.5 | 1,902 (+14%) | 2mo | $341,000 | $179 | 46 |
| 2590 Terraced Hill Ct | 0.72mi | 3/2.5 | 1,498 (-10%) | 4mo | $305,000 | $204 | 46 |
| 2580 Allison Dr | 0.72mi | 3/2.5 | 1,498 (-10%) | 6mo | $312,000 | $208 | 44 |
| 2600 Allison Dr | 0.74mi | 3/2.5 | 1,474 (-12%) | 7mo | $311,000 | $211 | 39 |
Match score weights: distance 35% · size 25% · config 20% · recency 20%. Top-matched comps best support the ARV.
Projected returns pro-forma
-3.0% appreciation · 4.93% rent growth · sell at horizon
- IRR
- -1.0%
- Equity multiple
- 0.96×
- Total profit
- $-1,650
- Equity at exit
- $22,365
- IRR
- 11.3%
- Equity multiple
- 2.00×
- Total profit
- $41,801
- Equity at exit
- $12,969
Cash invested: $42,000 (down + closing). Projections, not guarantees.
Landlord ↔ Tenant lean methodology
- Overall (STATE)
- 62 Landlord-Friendly
- State Pennsylvania
- 62 Landlord-Friendly · EVEN
- County
- — inherits STATE
- City
- — inherits STATE
ZIP-level market 19464
- Rents YoY
- 4.9%
- Active inventory
- 202
- Price-to-rent
- 5.6×
Monthly cashflow live
- Estimated rent
- $2,238 high interval (Pro) →
- Mortgage (P&I)
- −$787
- Tax from tax record
- −$362 /mo · $4,342/yr
- Insurance
- −$62
- Flood insurance flood zone
- −$56 /mo · $666/yr
- HOA
- −$220
- Vacancy / Maint / Mgmt
- −$470
- Net cashflow
- $281
Break-even live
UW: 25.0% down · 7.5% · 30yr · 1.5% tax · 5.0% vac · 8.0% maint · 8.0% mgmt
Financing live
Cash to close
- Down payment
- $37,500
- Closing costs
- $4,500
- Reserves months
- —
- Total cash needed
- —
Loan-product check · same deal, 3 products live
Conventional
25% down · 7.5% · 30yr
- Down + closing
- —
- Monthly P&I
- —
- Monthly cashflow
- —
- DSCR
- —
- Eligible?
- —
Personal DTI + credit; lowest rate.
DSCR
20% down · 8.5% · 30yr
- Down + closing
- —
- Monthly P&I
- —
- Monthly cashflow
- —
- DSCR
- —
- Eligible?
- —
No personal income docs; deal must DSCR.
Hard money
10% down · 12.0% · 12mo
- Down + closing
- —
- Monthly P&I
- —
- Monthly cashflow
- —
- DSCR
- —
- Eligible?
- —
Short-term bridge; refi at stabilization.
Rent comps 12 comps
| Address | Beds | Baths | Sqft | Rent | $/sqft | DOM | Units | Dist |
|---|---|---|---|---|---|---|---|---|
| 421 Oaktree Ct Pottstown, PA | 3.0 | 1.5 | 1624 | $2,250 | $1.39 | 43d | 1 | 0.04mi |
| 1613 Rosewood Ct #79 Pottstown, PA | 2.0 | 1.0 | 1127 | $2,400 | $2.13 | 1d | 1 | 0.37mi |
| 1732 Rosewood Ct Pottstown, PA | 2.0 | 1.0 | 1139 | $2,100 | $1.84 | 1d | 1 | 0.37mi |
| 1267 Village Ln Pottstown, PA | 3.0 | 2.5 | 1152 | $2,295 | $1.99 | 5d | 1 | 0.61mi |
| 48 Shelly Ln Pottstown, PA | 3.0 | 2.5 | 1522 | $2,383 | $1.57 | 1d | 1 | 0.64mi |
| 157 Van Fleet Cir Pottstown, PA | 3.0 | 2.5 | 1220 | $2,700 | $2.21 | 10d | 1 | 0.81mi |
| 3608 Walnut Ridge Est Pottstown, PA | 3.0 | 1.5 | 1368 | $2,150 | $1.57 | 1d | 1 | 0.97mi |
| 1412 Cherry Ln Pottstown, PA | 3.0 | 1.0 | 1080 | $2,200 | $2.04 | 1d | 1 | 1.00mi |
| 2435 Welsh Dr Pottstown, PA | 4.0 | 2.0 | 2086 | $3,000 | $1.44 | 10d | 1 | 1.02mi |
| 2705 Walnut Ridge Est Pottstown, PA | 3.0 | 1.5 | 1818 | $2,400 | $1.32 | 17d | 1 | 1.03mi |
| 1318 Cherry St Pottstown, PA | 3.0 | 2.0 | 1240 | $2,250 | $1.81 | 1d | 1 | 1.07mi |
| 1327 Kepler Rd Pottstown, PA | 2.0 | 1.0 | 1800 | $1,895 | $1.05 | 43d | 1 | 1.29mi |
HOA detail
- Monthly dues
- $220 · $2,640/yr
Listing history 4 events
-
2026-06-18days on market $150,000 Active 3 DOM
-
2026-06-17days on market $150,000 Active 2 DOM
-
2026-06-16remarks 693-char remark
-
2026-06-16$150,000 Active 1 DOM
ⓘ Source: listings_history table (triggers on properties + properties_extension) + one-shot
backfill from property_details.listing_events for pre-trigger history.
Tax reassessment forecast PA · Partial reset (capped growth)
- Current annual tax
- $4,342 · $362/mo
- Projected year-2 tax
- $4,342 · $362/mo
- Expected delta
- $0/yr ($0/mo · 0.0%)
ⓘ Screening estimate from a state-policy table — verify with the county assessor before closing.
Climate risk First Street
- Flood 7/10 Severe FEMA zone X (unshaded) · 99% chance over 30 yrs
- Wildfire 2/10 Low
- Heat 6/10 Major 7 d/yr ≥102°F today · 15 d/yr by 30 yrs out
- Wind 5/10 Major 23% chance of damaging wind over 30 yrs
- Air quality 2/10 Low 1 unhealthy d/yr today · 3 by 30 yrs out
Nearby sold comps map
Loading sold comps map…
Walkable amenities ~0.75 mi
Loading nearby amenities…
Taxation est. · year 1
- Rental income
- $26,853
- − Mortgage interest
- −$8,402
- − Property taxes
- −$4,342
- − Insurance
- −$1,416
- − Repairs & maintenance
- −$2,148
- − Management
- −$2,148
- − HOA
- −$2,640
- − Depreciation
- −$4,364
- Taxable income
- $1,392
- Est. tax owed @ 24.0%
- −$334
- After-tax cash flow
- $3,042/yr
For passive investors: Depreciation is non-cash, so a rental often shows a tax loss while cash-flowing — sheltering income. Rental losses are passive: they offset passive income freely, and up to $25,000/yr can offset ordinary (W-2) income if you actively participate and your MAGI is under $100k (phasing out to $0 by $150k); unused losses carry forward. On sale, claimed depreciation is recaptured at up to 25%, and gains may owe capital-gains tax (a 1031 exchange can defer both). Figures are a year-1 estimate at your 24.0% rate — not tax advice; consult a CPA.
Schools (NCES district)
- District
- Pottsgrove SD
- NCES district ID
- 4219650
- Math proficiency
- 29% ▼ -18.00%
- Reading proficiency
- 50% ▼ -14.00%
- Median HH income
- $71,814
- Composite
- 36.08/100
- National rank
- #4763
- State rank
- #318 of 539 in PA
Livability — Lower Pottsgrove
No livability data for this city. (Only ~50 U.S. cities are tracked.)
Census & demographics
- Census place
- Sanatoga, PA
- County
- Montgomery County · 712,331 people
- Metro
- Philadelphia-Camden-Wilmington, PA-NJ-DE-MD
- Population (ZIP)
- 49,101
- Household income
- $79,787
- Rent vs Own
- Severe rent burden
- 1797.0
Population outlook (Montgomery County) Hauer SSP2
- Today (2025)
- 856,074 people
- By 2030
- 870,887 · +1.7%
- By 2040
- 891,195 · +4.1%
- By 2050
- 896,417 · +4.7%
- By 2075
- 903,212 · +5.5%
- By 2100
- 843,240 · -1.5%
Race, ethnicity, and origin ACS 2023
- Neighborhood character
- Predominantly White (69%)
- Race & ethnicity
- White 69% Black 15% Two or more races 9% Hispanic / Latino 9% Asian 2%
- Hispanic origin (detail)
- Mexican 2% Puerto Rican 5%
- Common ancestry
- Romanian 7% Polish 2% Iranian 2%
- Foreign-born
- 6% · Canada, China
- Languages at home
- 92% English-only · Spanish 4% Arabic 1% Other Indo-European 1%
Political lean MEDSL · Montgomery
- 2024 margin
- Strong D (+22.8) · D 60.9% · R 38.1% · Other 1.1%
- 2008→2024 swing
- +2.0pp toward D · 2008: 20.8pp · 2024: 22.8pp
- All cycles
- 2024: D+22.8 2020: D+26.3 2016: D+21.1 2012: D+14.3 2008: D+20.8
Not yet ingested
- Civics
- —
Market trends
- HPI YoY
- ▼ -253.73%
- Current HPI
- 271.9399
- Rent YoY
- ▲ 4.93%
- Metro
- Philadelphia-Camden-Wilmington, PA-NJ-DE-MD
- State GDP YoY
- ▲ 1.68%
- F500 in state
- 34
Industry mix (Fortune 500 HQ in PA)
| Industry | F500 HQs | Revenue |
|---|---|---|
| Healthcare | 2 | $309B |
|
||
| Insurance | 2 | $27B |
|
||
| Telecommunications / Media | 1 | $124B |
|
||
| Industrial Distribution | 1 | $22B |
|
||
| Financial Services | 1 | $20B |
|
||
| Chemicals / Materials | 1 | $18B |
|
||
Price history
+39.4% since first listed9 events — show timeline
- 2026-06-15 Listed $150,000 BRIGHT MLS
- 2010-03-26 Listing Removed — BRIGHT MLS
- 2009-10-02 Listed $149,900 BRIGHT MLS
- 2006-09-17 Listing Removed — BRIGHT MLS
- 2006-06-25 Listed $169,900 BRIGHT MLS
- 2002-10-28 Sold (Public Records) $102,000 Public Records
- 2002-10-18 Sold (MLS) $102,000 BRIGHT MLS
- 2002-08-11 Listed $102,000 BRIGHT MLS
- 1990-07-27 Sold (Public Records) $107,600 Public Records
Property tax history
+2.0%/yrLatest (2026): $4,342 · +3.7% YoY. Source: county tax records.
Cash-flow waterfall
monthlySold comps — $/sqft
last 12 mo · ≤1 miLoading sold comps…