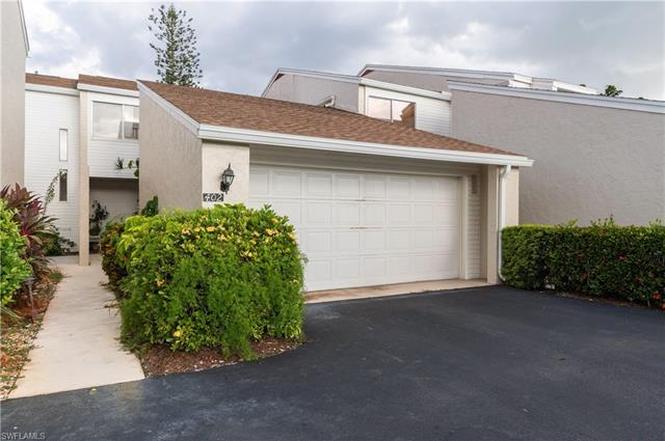
402 Bristle Cone Ln #2 · Lely, FL
Flood risk 9/10 · Severe
- FEMA flood zone
- AE
- Chance of flooding over 30 yrs
- 0.99%
- Est. flood insurance / yr
- $1,737 – $8,500
Fire risk 3/10 · Minor
- Est. fire insurance / yr
- $947 – $1,759
Heat risk 10/10 · Severe
- Hot days now (above 107°F)
- 7 days/yr
- Hot days in 30 yrs
- 29 days/yr
Wind risk 10/10 · Severe
- Chance of severe wind over 30 yrs
- 99.0%
Air-quality risk 2/10 · Minimal
- Unhealthy air days now
- 2 days/yr
- Unhealthy air days in 30 yrs
- 2 days/yr
Risk factors via First Street. Map © Google.
Why this score? — see what drove the C+ grade
The composite is a weighted blend of 9 inputs, each scored 0–100. Each bar is that input's sub-score; the figure is the points it added to the 100-point composite (weight × sub-score).
- Cash flow +24.1/30.0
- 1% rule +8.0/10.0
- DSCR +7.8/10.0
- ARV discount +7.5/15.0
- Schools +5.0/10.0
- Rent growth +3.9/5.0
- Livability +3.3/5.0
- Condition / age +2.5/5.0
- Appreciation +0.0/10.0
$349,000
🖨 Deal sheet (PDF) 📄 Offer letter ✓ Due diligence
Listing remarks MLS
Welcome to your dream home! This stunning property, completely remodeled less than 4 years ago, offers the epitome of modern luxury. Step into the heart of the home, where a gourmet kitchen awaits. Light-colored granite countertops extend generously, providing ample space for culinary creations and casual dining at the breakfast bar. Stainless steel appliances gleam against the backdrop of a tasteful tiled backsplash. With all-new cabinets and four spacious pantries, storage is never a concern. Downstairs, tiled flooring spans the entire space, seamlessly connecting the living areas. Expansive sliders and windows flood the home with natural light, accentuating the soaring 20-foot ceilings in the living room, creating spacious feeling. Retreat to the master suite, boasting over 20 feet of space and a walk-in closet. The master bath features a double vanity and elegantly accented mirrors, offering a sanctuary of relaxation. Guests will feel pampered in their own private quarters, complete with an ensuite bath featuring a new vanity. Outside, the screened and covered lanai provides a picturesque backdrop of the golf course, perfect for enjoying morning coffee or evening cocktails. Listing agent is seller.
Key facts
- Tiled flooring
- Tiled backsplash
- Gourmet kitchen
Tags
Property features AI
Finance
- Financial info: Total annual recurring HOA fees listed; One-time fees applicable
- HOA & community: Professional management; Quarterly condo fee; Maintenance covers insurance, irrigation water, lawn/land maintenance, legal/accounting, manager, recreation facilities, reserve, sewer and water; Community amenities include clubhouse, community pool and streetlights; Non-gated community; Sub-association name: Ironwood
Exterior
- Parking: Attached 2-car garage; 1 assigned covered parking; Paved driveway and paved parking
- Utilities: Central water; Central sewer; Cable available
- Home design: Residential townhouse; 2-story (courtyard, 2-story floor plan); Rear exposure to the east; Zero lot line
- Construction: Wood frame construction; Stucco and vinyl siding exterior; Shingle roof; Built in 1975
- Exterior features: Patio; Automatic sprinkler system; Golf course and landscaped area views; Well irrigation
Interior
- Kitchen: Pantry; Dishwasher; Disposal; Microwave; Range; Self-cleaning oven; Refrigerator/ice maker; Breakfast bar / dining in living area
- Bedrooms: 2 bedrooms plus a den; Master bedroom upstairs; Split bedroom layout
- Flooring: Carpet; Tile
- Bathrooms: 2 full bathrooms; 1 half bathroom; Master bath with dual sinks and a shower (no tub)
- Heating & cooling: Central electric heat; Central electric cooling; Ceiling fans
- Interior features: Cable pre-wire; Cathedral and vaulted ceilings; Foyer; Pantry; Smoke detectors; Volume ceiling; Walk-in closet; Window coverings; Atrium; Den / study; Screened lanai/porch; 8 total rooms; Unfurnished; 4 ceiling fans
- Laundry & utility: Washer and dryer in residence; Auto garage door
Neighborhood map
What this means for you Summary
Snapshot
- This is a 2-bed/2.5-bath condo listed at $349k.
Deal economics
- At list price, monthly cash flow is $262 ($3k/yr) — positive.
- The deal already cash-flows at list — no discount required.
- Meets the 1% rule at list price ($5k rent vs $349k).
- Recommended offer: $307k (12.0% below list) — sets the bar for market timing.
Location & tenants
- Location reads 66/100 on livability (#586 in FL) — a middle-class / working-renter tenant base. Strengths: crime A+, housing A+; Watch: health & safety D, amenities F, commute F.
- Collier (suburban): math 60% / reading 56% proficiency, ranked #16 of 73 in FL (top 22%) — acceptable for families but not a draw, mixed tenant base, ~2y average lease.
- Zoned schools: Lely Elementary School (math 45% / reading 46%, grade D-, #1,247 of 2,144 statewide, top 59%, 499 students, 62% FRL); Manatee Middle School (math 61% / reading 43%, grade C+, #217 of 571 statewide, top 40%, 749 students, 64% FRL); Lely High School (math 40% / reading 39%, grade F, #304 of 667 statewide, top 47%, 1,504 students, 54% FRL).
- Zoned-school proficiency averages 46% at this address vs 58% district-wide (-12 pts) — the specific schools serving this property underperform the Collier average; the district grade overstates school quality for this exact location.
- Market conditions: Rents rising fast (+5.6%/yr); 598 active listings in the ZIP; 40 comparable units currently listed for rent nearby; rentals at typical pace (median 26d on market — plan ~3-4 weeks tenant-placement turnaround); solid renter incomes; 3,520 units permitted in Collier County in 2024 (959 in 5+ unit buildings).
- At $4,547/mo this rent would consume 67% of the median local household income ($82k/yr) (locally 954% of renters already pay >50% of income on rent) — very limited rent-growth headroom before tenants either downsize or default.
Forward outlook
- Local home prices are declining (-3.0%/yr); year-one equity from $2k of loan paydown is wiped out by about $10k of value loss. Plan a longer hold.
- Collier County population projected at +30% by 2050 — long-run rental-demand tailwind backs the buy-and-hold thesis.
Negotiation context
- It's been on market 342 days — a 12% lower offer ($307k) is reasonable based on typical stale-listing flexibility.
- 14 sale attempts since 12y ago; this cycle's ask is 12591% above the opening price — seller raised mid-cycle; expect resistance to lowballs.
- Current owner paid $150k; list at $349k implies a 133% gain — meaningful room to come down on a strong offer.
Risks & watch-outs
- Watch-outs: flood insurance adds $427/mo.
- Climate carrying-cost: in FEMA flood zone AE (mandatory federal flood insurance); severe wind risk, 99% chance of damaging wind over 30y; extreme-heat days projected 7→29/yr by 2055 (HVAC capex compounding) — expect insurance premiums to compound above CPI over the hold.
Questions for the listing agent
- It's been on market 342 days. Have you received any prior offers? Is the seller open to a 12% concession, seller financing, or rate buy-down credit?
- Built in 1975 — when were the roof, HVAC, electrical panel, plumbing, and water heater last replaced?
- What's the actual annual flood-insurance premium (NFIP or private), and is the property in a SFHA with mandatory coverage?
- What does the HOA fee cover, when was the last increase, and are there any pending special assessments or reserve-fund shortfalls?
- Any open or pending special assessments — roof, HVAC, plumbing, elevator, façade? What's the per-unit balance and payoff schedule, and is the seller paying it off at close or rolling it to the buyer?
- Why hasn't it sold? Are there any deal-killer items the seller is aware of (foundation, flood, title, zoning, code violations)?
- Is there a deadline driving the sale (1031 exchange, divorce, estate, relocation)? That informs how much negotiation room exists.
- Schools are D-rated, which usually means shorter tenancies and higher turnover. Who's the typical renter profile here, and what's been the actual vacancy rate?
- What's the average days-on-market for RENTAL listings here right now (not sales)? A rising rental-DOM trend means longer vacancies and softer asking-rent achievability than the comps imply.
- What's the recent tenant-quality profile in this submarket — average credit score on applications, eviction rate, late-payment / NSF rate, and stable-employment percentage? A property-management company in the area should have these aggregated.
- How much new apartment / multifamily construction is in the pipeline within 1–3 miles? Heavy new supply (>2% of stock underway) typically softens rents 12–24 months out; light construction supports rent growth.
Investment metrics
- 1% rule
- 1.30% ✓
- Cap rate
- 8.66%
- Cash-on-cash
- 8.46%
- DSCR
- 1.38
- GRM
- 6.4
CMA / ARV
No comps found within radius.
Projected returns pro-forma
-3.0% appreciation · 5.59% rent growth · sell at horizon
- IRR
- -7.2%
- Equity multiple
- 0.72×
- Total profit
- $-27,055
- Equity at exit
- $52,037
- IRR
- 6.3%
- Equity multiple
- 1.54×
- Total profit
- $53,134
- Equity at exit
- $30,175
Cash invested: $97,720 (down + closing). Projections, not guarantees.
Landlord ↔ Tenant lean methodology
- Overall (STATE)
- 87 Strongly Landlord-Friendly
- State Florida
- 87 Strongly Landlord-Friendly · R+3
- County
- — inherits STATE
- City
- — inherits STATE
ZIP-level market 34113
- Rents YoY
- 5.6%
- Active inventory
- 598
- Price-to-rent
- 6.4×
Monthly cashflow live
- Estimated rent
- $4,547 high interval (Pro) →
- Mortgage (P&I)
- −$1,830
- Tax from tax record
- −$276 /mo · $3,311/yr
- Insurance
- −$145
- Flood insurance flood zone
- −$427 /mo · $5,118/yr
- HOA
- −$652
- Vacancy / Maint / Mgmt
- −$955
- Net cashflow
- $262
Break-even live
Sensitivity live
| Price | -10% $460 | -5% $361 | +0% $262 | +5% $164 | +10% $65 |
|---|---|---|---|---|---|
| Rent | -10% $-97 | -5% $83 | +0% $262 | +5% $442 | +10% $622 |
| Rate | -1.0pp $438 | -0.5pp $351 | base $262 | +0.5pp $172 | +1.0pp $80 |
UW: 25.0% down · 7.5% · 30yr · 1.5% tax · 5.0% vac · 8.0% maint · 8.0% mgmt
Financing live
Cash to close
- Down payment
- $87,250
- Closing costs
- $10,470
- Reserves months
- —
- Total cash needed
- —
Loan-product check · same deal, 3 products live
Conventional
25% down · 7.5% · 30yr
- Down + closing
- —
- Monthly P&I
- —
- Monthly cashflow
- —
- DSCR
- —
- Eligible?
- —
Personal DTI + credit; lowest rate.
DSCR
20% down · 8.5% · 30yr
- Down + closing
- —
- Monthly P&I
- —
- Monthly cashflow
- —
- DSCR
- —
- Eligible?
- —
No personal income docs; deal must DSCR.
Hard money
10% down · 12.0% · 12mo
- Down + closing
- —
- Monthly P&I
- —
- Monthly cashflow
- —
- DSCR
- —
- Eligible?
- —
Short-term bridge; refi at stabilization.
Rent comps 40 comps
| Address | Beds | Baths | Sqft | Rent | $/sqft | DOM | Units | Dist |
|---|---|---|---|---|---|---|---|---|
| 452 Bristle Cone Ln #27 Naples, FL | 2.0 | 2.0 | 1129 | $2,000 | $1.77 | 25d | 1 | 0.11mi |
| 255 Pine Valley Cir Naples, FL | 3.0 | 1.5 | 1574 | $3,500 | $2.22 | 25d | 1 | 0.21mi |
| 315 Saint Andrews Blvd Unit A25 Naples, FL | 2.0 | 2.0 | 1126 | $1,530 | $1.36 | 25d | 1 | 0.26mi |
| 213 Bay Meadows Dr Naples, FL | 3.0 | 2.0 | 1650 | $5,500 | $3.33 | 25d | 1 | 0.27mi |
| 239 Torrey Pines Pt Naples, FL | 3.0 | 2.5 | 1907 | $12,090 | $6.34 | 25d | 1 | 0.31mi |
| 326 Bradstrom Cir Unit 204F Naples, FL | 3.0 | 2.0 | 1200 | $3,500 | $2.92 | 25d | 1 | 0.35mi |
| 326 Bradstrom Cir Unit 103F Naples, FL | 2.0 | 2.0 | 1113 | $1,800 | $1.62 | 25d | 1 | 0.35mi |
| 240 Pebble Beach Blvd #702 Naples, FL | 2.0 | 2.0 | 1090 | $4,000 | $3.67 | 25d | 1 | 0.35mi |
| 520 Augusta Blvd Unit B204 Naples, FL | 3.0 | 2.0 | 1294 | $2,200 | $1.70 | 25d | 1 | 0.37mi |
| 167 Torrey Pines Pt Naples, FL | 3.0 | 2.0 | 1907 | $9,000 | $4.72 | 25d | 1 | 0.39mi |
| 332 Bradstrom Cir #201 Naples, FL | 2.0 | 2.0 | 1257 | $2,200 | $1.75 | 25d | 1 | 0.40mi |
| 248 Pebble Beach Cir Unit G201 Naples, FL | 2.0 | 2.0 | 1163 | $2,300 | $1.98 | 25d | 1 | 0.42mi |
| 5293 Dixie Dr Unit 1546039P Naples, FL | 2.0 | 2.0 | 1130 | $1,561 | $1.38 | 15d | 1 | 0.44mi |
| 232 Pebble Beach Blvd #104 Naples, FL | 3.0 | 2.0 | 1298 | $1,975 | $1.52 | 25d | 1 | 0.44mi |
| 413 Augusta Blvd #302 Naples, FL | 2.0 | 2.0 | 1390 | $5,500 | $3.96 | 23d | 1 | 0.45mi |
| 127 Palmetto Dunes Cir Naples, FL | 3.0 | 2.0 | 1906 | $7,500 | $3.93 | 25d | 1 | 0.45mi |
| 265 Deerwood Cir Naples, FL | 2.0 | 2.0 | 1179 | $5,000 | $4.24 | 25d | 1 | 0.50mi |
| 5535 Rattlesnake Hammock Rd #302 Naples, FL | 2.0 | 2.0 | 1205 | $2,800 | $2.32 | 25d | 1 | 0.53mi |
| 5651 Rattlesnake Hammock Rd Unit C-108 Naples, FL | 2.0 | 2.0 | 1054 | $1,800 | $1.71 | 25d | 1 | 0.55mi |
| 5635 Rattlesnake Hammock Rd Apt 203D Naples, FL | 2.0 | 2.0 | 1054 | $1,700 | $1.61 | 23d | 1 | 0.55mi |
| 5499 Rattlesnake Hammock Rd Naples, FL | 2.0 | 2.0 | 1071 | $1,775 | $1.66 | 15d | 2 | 0.55mi |
| 555 Augusta Blvd Unit 3-1 Naples, FL | 2.0 | 2.0 | 1249 | $4,200 | $3.36 | 25d | 1 | 0.55mi |
| 6984 Saona Ct Naples, FL | 2.0 | 2.0 | 1472 | $7,500 | $5.10 | 25d | 1 | 0.55mi |
| 182 Palmetto Dunes Cir Naples, FL | 3.0 | 2.0 | 2175 | $3,300 | $1.52 | 25d | 1 | 0.56mi |
| 5419 Rattlesnake Hammock Rd Unit 307F Naples, FL | 2.0 | 2.0 | 1071 | $1,950 | $1.82 | 15d | 1 | 0.58mi |
| 494 Saint Andrews Blvd Naples, FL | 3.0 | 2.0 | 1700 | $2,800 | $1.65 | 25d | 1 | 0.58mi |
| 575 Augusta Blvd Naples, FL | 3.0 | 2.0 | 1500 | $2,100 | $1.40 | 25d | 1 | 0.60mi |
| 5502 Greenwood Cir #1 Naples, FL | 3.0 | 2.0 | 1450 | $2,400 | $1.66 | 25d | 1 | 0.60mi |
| 7124 Saona Ct Naples, FL | 2.0 | 2.0 | 1387 | $8,000 | $5.77 | 25d | 1 | 0.61mi |
| 6875 Saona Ct Naples, FL | 2.0 | 2.0 | 1565 | $8,000 | $5.11 | 25d | 1 | 0.62mi |
| 7110 Cayo Coco Ln Naples, FL | 2.0 | 2.0 | 1387 | $9,250 | $6.67 | 25d | 1 | 0.62mi |
| 7197 Saona Ct Unit 1545994P Naples, FL | 2.0 | 2.0 | 1291 | $4,152 | $3.22 | 15d | 1 | 0.64mi |
| 7142 Cayo Coco Ln Naples, FL | 2.0 | 2.0 | 1490 | $10,000 | $6.71 | 25d | 1 | 0.64mi |
| 7138 Cayo Coco Ln Naples, FL | 2.0 | 2.0 | 1205 | $6,500 | $5.39 | 25d | 1 | 0.64mi |
| 9512 Napoli Ln Unit 101 Naples, FL | 3.0 | 2.0 | 1741 | $10,000 | $5.74 | 15d | 1 | 0.64mi |
| 640 Augusta Blvd Naples, FL | 2.0 | 2.0 | 1634 | $2,700 | $1.65 | 25d | 1 | 0.65mi |
| 7162 Saona Ct Naples, FL | 2.0 | 2.0 | 1482 | $9,000 | $6.07 | 25d | 1 | 0.65mi |
| 5595 Greenwood Cir #92 Naples, FL | 3.0 | 2.0 | 1450 | $5,000 | $3.45 | 25d | 1 | 0.65mi |
| 9234 Veneto Pl Naples, FL | 3.0 | 3.0 | 2032 | $21,500 | $10.58 | 25d | 1 | 0.66mi |
| 605 Augusta Blvd #14 Naples, FL | 2.0 | 2.0 | 1125 | $4,000 | $3.56 | 25d | 1 | 0.66mi |
HOA detail condo
- Monthly dues
- $652 · $7,824/yr
- Assessments
- None detected in remarks — confirm with the listing agent.
Listing history 44 events
-
2026-06-10days on market $349,000 Active 342 DOM
-
2026-06-09days on market $349,000 Active 341 DOM
-
2026-06-08days on market $349,000 Active 340 DOM
-
2026-06-07days on market $349,000 Active 339 DOM
-
2026-06-02days on market $349,000 Active 334 DOM
-
2026-06-01days on market $349,000 Active 333 DOM
-
2026-05-31days on market $349,000 Active 332 DOM
-
2026-05-30days on market $349,000 Active 331 DOM
-
2026-03-13$2,750
-
2026-03-13historical $2,750
-
2025-11-02$2,750
-
2025-09-28historical $2,750
-
2025-09-26$2,750
-
2025-08-26historical $2,750
-
2025-07-04$2,750
-
2025-07-03$349,000 Active
-
2025-07-02$349,000 Active 1221-char remark
Show marketing remark (1221 chars)
Welcome to your dream home! This stunning property, completely remodeled less than 4 years ago, offers the epitome of modern luxury. Step into the heart of the home, where a gourmet kitchen awaits. Light-colored granite countertops extend generously, providing ample space for culinary creations and casual dining at the breakfast bar. Stainless steel appliances gleam against the backdrop of a tasteful tiled backsplash. With all-new cabinets and four spacious pantries, storage is never a concern. Downstairs, tiled flooring spans the entire space, seamlessly connecting the living areas. Expansive sliders and windows flood the home with natural light, accentuating the soaring 20-foot ceilings in the living room, creating spacious feeling. Retreat to the master suite, boasting over 20 feet of space and a walk-in closet. The master bath features a double vanity and elegantly accented mirrors, offering a sanctuary of relaxation. Guests will feel pampered in their own private quarters, complete with an ensuite bath featuring a new vanity. Outside, the screened and covered lanai provides a picturesque backdrop of the golf course, perfect for enjoying morning coffee or evening cocktails. Listing agent is seller.
-
2024-05-03historical
-
2024-04-08$425,000 Active
-
2024-04-08$425,000 Active
-
2019-12-24soldstatus $150,000
-
2019-12-23soldstatus $150,000 Sold
-
2019-11-25status Pending
-
2019-11-08price $159,900
-
2019-10-26price $167,000
-
2019-10-02status Active
-
2019-09-27status Pending With Contingencies
-
2019-09-06$169,900 Active
-
2019-03-25historical
-
2019-03-01price $173,900
-
2019-02-15price $175,900
-
2019-01-27price $179,900
-
2019-01-14price $182,500
-
2019-01-03$185,000 Active
-
2018-10-05historical
-
2018-08-22price $194,900
-
2018-07-07$199,000 Active
-
2015-03-02historical
-
2014-12-30$174,900
-
2014-12-26historical
-
2014-11-19$174,900
-
1998-09-02soldstatus $86,500
-
1995-07-25soldstatus $77,000
-
1994-11-30soldstatus $75,000
ⓘ Source: listings_history table (triggers on properties + properties_extension) + one-shot
backfill from property_details.listing_events for pre-trigger history.
Tax reassessment forecast FL · Resets to sale price
- Current annual tax
- $3,311 · $276/mo
- Projected year-2 tax
- $3,311 · $276/mo
- Expected delta
- $0/yr ($0/mo · 0.0%)
ⓘ Screening estimate from a state-policy table — verify with the county assessor before closing.
Climate risk First Street
- Flood 9/10 Extreme FEMA zone AE · 99% chance over 30 yrs
- Wildfire 3/10 Moderate
- Heat 10/10 Extreme 7 d/yr ≥107°F today · 29 d/yr by 30 yrs out
- Wind 10/10 Extreme 99% chance of damaging wind over 30 yrs
- Air quality 2/10 Low 2 unhealthy d/yr today · 2 by 30 yrs out
Nearby sold comps map
Loading sold comps map…
Walkable amenities ~0.75 mi
Loading nearby amenities…
Taxation est. · year 1
- Rental income
- $54,569
- − Mortgage interest
- −$19,549
- − Property taxes
- −$3,311
- − Insurance
- −$6,864
- − Repairs & maintenance
- −$4,365
- − Management
- −$4,365
- − HOA
- −$7,824
- − Depreciation
- −$10,153
- Taxable loss
- −$1,863
- Est. tax savings @ 24.0%
- +$447
- After-tax cash flow
- $3,595/yr
For passive investors: Depreciation is non-cash, so a rental often shows a tax loss while cash-flowing — sheltering income. Rental losses are passive: they offset passive income freely, and up to $25,000/yr can offset ordinary (W-2) income if you actively participate and your MAGI is under $100k (phasing out to $0 by $150k); unused losses carry forward. On sale, claimed depreciation is recaptured at up to 25%, and gains may owe capital-gains tax (a 1031 exchange can defer both). Figures are a year-1 estimate at your 24.0% rate — not tax advice; consult a CPA.
Schools (NCES district)
- District
- Collier
- NCES district ID
- 1200330
- Math proficiency
- 60% ▼ -4.00%
- Reading proficiency
- 56% ▼ -2.00%
- Median HH income
- $58,275
- Composite
- 50.23/100
- National rank
- #1892
- State rank
- #16 of 73 in FL
Livability — Lely
- Score
- 66/100
- State rank
- #586
- US rank
- #11224
Category grades
Schools grade is shown separately in the Schools card above.
Census & demographics
- Census place
- Lely, FL
- County
- Collier County · 396,295 people
- Metro
- Naples-Marco Island, FL
- Population (ZIP)
- 26,056
- Household income
- $81,674
- Rent vs Own
- Severe rent burden
- 954.0
Population outlook (Collier County) Hauer SSP2
- Today (2025)
- 420,858 people
- By 2030
- 450,054 · +6.9%
- By 2040
- 502,232 · +19.3%
- By 2050
- 544,932 · +29.5%
- By 2075
- 627,203 · +49.0%
- By 2100
- 659,015 · +56.6%
Race, ethnicity, and origin ACS 2023
- Neighborhood character
- Diverse neighborhood (Simpson 0.59)
- Race & ethnicity
- White 56% Hispanic / Latino 28% Black 12% Two or more races 11% Asian 2%
- Hispanic origin (detail)
- Mexican 17% Puerto Rican 3% Cuban 2%
- Common ancestry
- Hispanic 10% Romanian 3% Lithuanian 2%
- Foreign-born
- 26% · Canada, Jamaica, Vietnam
- Languages at home
- 63% English-only · Spanish 24% French/Haitian/Cajun 9% Other Indo-European 2%
Political lean MEDSL · Collier
- 2024 margin
- Solid R (+33.1) · D 33.1% · R 66.2%
- 2008→2024 swing
- -10.6pp toward R · 2008: -22.5pp · 2024: -33.1pp
- All cycles
- 2024: R+33.1 2020: R+24.7 2016: R+26.0 2012: R+30.1 2008: R+22.5
Not yet ingested
- Civics
- —
Market trends
- HPI YoY
- ▼ -194.86%
- Current HPI
- 279.4232
- Rent YoY
- ▲ 5.59%
- Metro
- Naples-Marco Island, FL
- State GDP YoY
- ▲ 3.28%
- F500 in state
- 36
Industry mix (Fortune 500 HQ in FL)
| Industry | F500 HQs | Revenue |
|---|---|---|
| Industrial Technology | 2 | $29B |
|
||
| Insurance | 2 | $17B |
|
||
| Retail | 1 | $60B |
|
||
| Technology Distribution | 1 | $58B |
|
||
| Homebuilding | 1 | $35B |
|
||
| Technology Manufacturing | 1 | $35B |
|
||
Price history
-96.3% since first listed36 events — show timeline
- 2026-03-13 Listed for Rent $2,750 FGCMLS
- 2026-03-13 Rental Removed $2,750 NAPLESMLS
- 2025-11-02 Listed for Rent $2,750 NAPLESMLS
- 2025-09-28 Rental Removed $2,750 NAPLESMLS
- 2025-09-26 Listed for Rent $2,750 NAPLESMLS
- 2025-08-26 Rental Removed $2,750 NAPLESMLS
- 2025-07-04 Listed for Rent $2,750 NAPLESMLS
- 2025-07-03 Listed $349,000 NAPLESMLS
- 2025-07-02 Listed $349,000 MIML
- 2024-05-03 Listing Removed — NAPLESMLS
- 2024-04-08 Listed $425,000 NAPLESMLS
- 2024-04-08 Listed $425,000 MIML
- 2019-12-24 Sold (Public Records) $150,000 Public Records
- 2019-12-23 Sold (MLS) $150,000 NAPLESMLS
- 2019-11-25 Pending — NAPLESMLS
- 2019-11-08 Price Changed $159,900 NAPLESMLS
- 2019-10-26 Price Changed $167,000 NAPLESMLS
- 2019-10-02 Relisted — NAPLESMLS
- 2019-09-27 Pending — NAPLESMLS
- 2019-09-06 Listed $169,900 NAPLESMLS
- 2019-03-25 Listing Removed — NAPLESMLS
- 2019-03-01 Price Changed $173,900 NAPLESMLS
- 2019-02-15 Price Changed $175,900 NAPLESMLS
- 2019-01-27 Price Changed $179,900 NAPLESMLS
- 2019-01-14 Price Changed $182,500 NAPLESMLS
- 2019-01-03 Listed $185,000 NAPLESMLS
- 2018-10-05 Listing Removed — NAPLESMLS
- 2018-08-22 Price Changed $194,900 NAPLESMLS
- 2018-07-07 Listed $199,000 NAPLESMLS
- 2015-03-02 Listing Removed — NAPLESMLS
- 2014-12-30 Listed $174,900 NAPLESMLS
- 2014-12-26 Listing Removed — NAPLESMLS
- 2014-11-19 Listed $174,900 NAPLESMLS
- 1998-09-02 Sold (Public Records) $86,500 Public Records
- 1995-07-25 Sold (Public Records) $77,000 Public Records
- 1994-11-30 Sold (Public Records) $75,000 Public Records
Property tax history
+12.2%/yrLatest (2025): $3,311 · +9.1% YoY. Source: county tax records.
Cash-flow waterfall
monthlySold comps — $/sqft
last 12 mo · ≤1 miLoading sold comps…