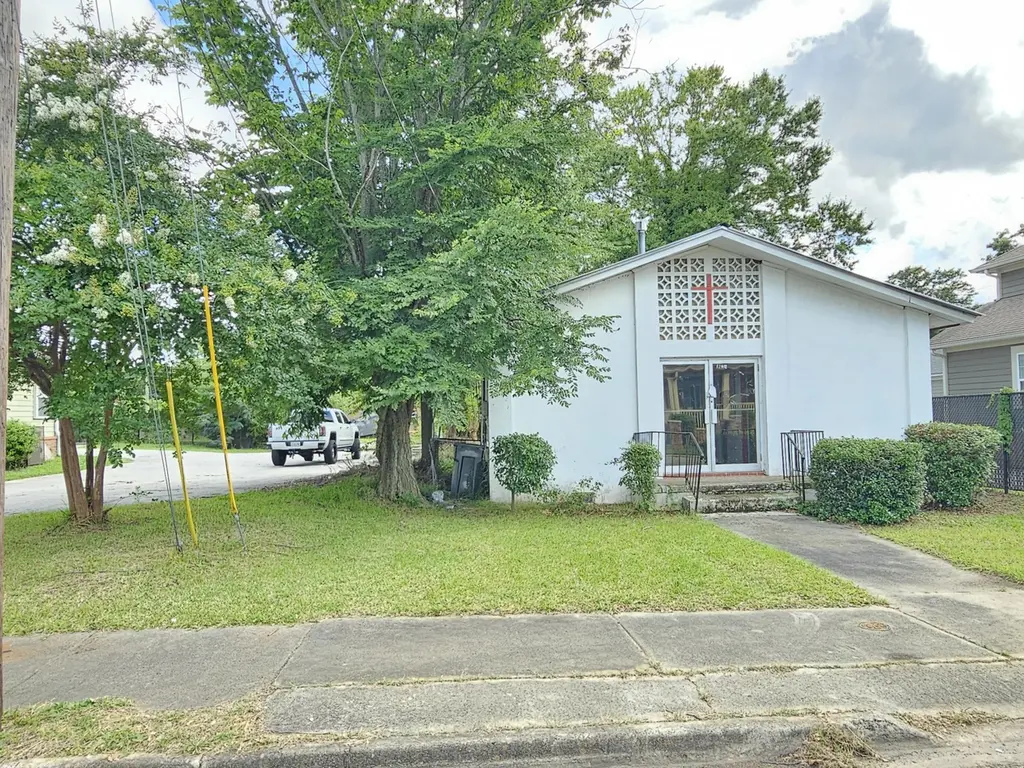
1126 Florence St · Augusta-Richmond County consolidated government (balance), GA
Flood risk 1/10 · Minimal
- FEMA flood zone
- X (unshaded)
- Chance of flooding over 30 yrs
- 0.0%
- Est. flood insurance / yr
- $507 – $1,088
Fire risk 2/10 · Minimal
- Est. fire insurance / yr
- $963 – $1,789
Heat risk 8/10 · Major
- Hot days now (above 108°F)
- 7 days/yr
- Hot days in 30 yrs
- 17 days/yr
Wind risk 6/10 · Moderate
- Chance of severe wind over 30 yrs
- 62.0%
Air-quality risk 4/10 · Minor
- Unhealthy air days now
- 4 days/yr
- Unhealthy air days in 30 yrs
- 4 days/yr
Risk factors via First Street. Map © Google.
Why this score? — see what drove the B grade
The composite is a weighted blend of 9 inputs, each scored 0–100. Each bar is that input's sub-score; the figure is the points it added to the 100-point composite (weight × sub-score).
- Cash flow +30.0/30.0
- 1% rule +10.0/10.0
- DSCR +10.0/10.0
- Appreciation +9.1/10.0
- ARV discount +7.5/15.0
- Livability +2.5/5.0
- Rent growth +2.2/5.0
- Schools +1.3/10.0
- Condition / age +1.0/5.0
$85,000
🖨 Deal sheet (PDF) 📄 Offer letter ✓ Due diligence
Listing remarks
Property was a church and is being sold as a residential property or church. The lot connecting to the side and back of church is part of purchase price and will be sold with the building Property is being sold AS-IS. Perfect for Investors. Seller has gotten all paperwork in order and is ready to move forward. Bring your offers!
Key facts
- 6,098 sq ft lot
- Built 1960
- Listed 10 days
Neighborhood map
What this means for you Summary
Snapshot
- This is a 2-bed/2.0-bath single-family listed at $85k. Condition is rated poor.
Deal economics
- At list price, monthly cash flow is $833 ($10k/yr) — positive.
- The deal already cash-flows at list — no discount required.
- Meets the 1% rule at list price ($2k rent vs $85k).
- Cap rate 18.1% vs local median 5.3% in Augusta-Richmond County consolidated government (balance) — top-decile yield for the area; either an underpriced asset or a hidden risk that comps aren't pricing in. Stress-test before assuming the spread holds.
Location & tenants
- Location reads: area grade B — affects rentability + tenant quality, not the cash-flow math above.
- Richmond County (urban): math 12% / reading 20% proficiency, ranked #154 of 174 in GA (top 88%) — low school quality limits family demand, transient renter base, plan for 1-2y turnover; 72% free/reduced lunch — lower-income household profile, screen leases tightly.
- Zoned schools: W.S. Hornsby Elementary School (math 2% / reading 2%, grade F, #1,204 of 1,228 statewide, top 100%, 567 students, 98% FRL); Laney High School (math 2% / reading 8%, grade F, #394 of 424 statewide, top 97%, 684 students, 98% FRL) — zoned schools average 98% FRL vs 72% district-wide (26 pts higher); higher-poverty schools than district average — tighter screening recommended.
- Zoned-school proficiency averages 4% at this address vs 16% district-wide (-12 pts) — the specific schools serving this property underperform the Richmond County average; the district grade overstates school quality for this exact location.
- Market conditions: Rents soft (-1.3%/yr); 131 active listings in the ZIP; 12 comparable units currently listed for rent nearby; rentals at typical pace (median 26d on market — plan ~3-4 weeks tenant-placement turnaround); 42% of comp listings sitting > 30 days — soft ceiling on asking rent; lower-income renter base — watch delinquency; 561 units permitted in Richmond County in 2024 (0 in 5+ unit buildings).
Forward outlook
- In year one you build about $8k of equity ($588 loan paydown + $7k appreciation (8.2% local appreciation)).
- Richmond County population projected to shrink 5% by 2050 — rents likely to lag national; underwrite the cash flow, not the appreciation.
- At projected returns (8.2% appreciation + 0.0% rent growth), your $24k cash investment doubles in ~2 years — after that, you're playing with house money.
- By year 5, paydown + projected appreciation supports a ~$34k cash-out refi (75% LTV) — recoverable capital for the next deal without selling this one.
Negotiation context
- Only 10 days on market — expect competitive offers; lowballing is unlikely to land.
- 2 sale attempts; this cycle's ask has dropped $5k (6%) from the opening price — seller is motivated, your offer sets the floor, not the list.
- Current owner paid $60k; 42% above their basis — modest negotiation headroom, anchor on the comps not their cost.
Risks & watch-outs
- Climate carrying-cost: major wind risk, 62% chance of damaging wind over 30y; extreme-heat days projected 7→17/yr by 2055 (HVAC capex compounding) — expect insurance premiums to compound above CPI over the hold.
Questions for the listing agent
- Have any recent inspections been done? Can we get a copy of the seller's disclosures and any deferred-maintenance estimates?
- Built in 1960 — when were the roof, HVAC, electrical panel, plumbing, and water heater last replaced?
- Is there a deadline driving the sale (1031 exchange, divorce, estate, relocation)? That informs how much negotiation room exists.
- What's the average days-on-market for RENTAL listings here right now (not sales)? A rising rental-DOM trend means longer vacancies and softer asking-rent achievability than the comps imply.
- What's the recent tenant-quality profile in this submarket — average credit score on applications, eviction rate, late-payment / NSF rate, and stable-employment percentage? A property-management company in the area should have these aggregated.
- How much new for-sale + rental construction is in the pipeline within 1–3 miles? Heavy new supply typically softens prices + rents 12–24 months out; constrained supply supports both.
Investment metrics
- 1% rule
- 2.12% ✓
- Cap rate
- 18.06%
- Cash-on-cash
- 42.02%
- DSCR
- 2.87
- GRM
- 3.9
CMA / ARV
- ARV (median comp)
- $179,822
- List price
- $85,000
- Delta
- -52.73%
- Verdict
- UNDERPRICED
- Comps
- 20 within 1.0 mi
Show comp detail 9 sales within ~0.75 mi
| Address | Dist | Beds/Ba | Sqft | Sold | Price | $/sf | Match |
|---|---|---|---|---|---|---|---|
| 1321 11th St | 0.05mi | 3/3.0 (+1) | 1,653 (-14%) | 2mo | $53,500 | $32 | 64 |
| 1106 Pine St | 0.24mi | 2/2.0 | 1,794 (-7%) | 18mo | $120,000 | $67 | 62 |
| 1233 Miller St | 0.43mi | 3/2.5 (+1) | 1,797 (-7%) | 8mo | $235,000 | $131 | 55 |
| 1227 Miller St | 0.42mi | 3/2.5 (+1) | 1,797 (-7%) | 10mo | $235,000 | $131 | 54 |
| 710 Hall St | 0.50mi | 3/2.5 (+1) | 2,023 (+5%) | 9mo | $210,000 | $104 | 54 |
| 1227 Holley St | 0.57mi | 3/2.5 (+1) | 2,037 (+6%) | 8mo | $160,000 | $79 | 50 |
| 827 D'antignac St | 0.56mi | 3/2.5 (+1) | 1,739 (-10%) | 4mo | $204,500 | $118 | 47 |
| 1236 Steiner Ave | 0.54mi | 3/2.0 (+1) | 2,066 (+7%) | 14mo | $50,000 | $24 | 46 |
| 1413 Maple St | 0.36mi | 3/2.5 (+1) | 1,653 (-14%) | 9mo | $245,000 | $148 | 45 |
Match score weights: distance 35% · size 25% · config 20% · recency 20%. Top-matched comps best support the ARV.
Projected returns pro-forma
8.18% appreciation · 0.0% rent growth · sell at horizon
- IRR
- 52.3%
- Equity multiple
- 4.52×
- Total profit
- $83,837
- Equity at exit
- $65,622
- IRR
- 46.0%
- Equity multiple
- 9.16×
- Total profit
- $194,241
- Equity at exit
- $131,269
Cash invested: $23,800 (down + closing). Projections, not guarantees.
Landlord ↔ Tenant lean methodology
- Overall (STATE)
- 90 Strongly Landlord-Friendly
- State Georgia
- 90 Strongly Landlord-Friendly · R+3
- County
- — inherits STATE
- City
- — inherits STATE
ZIP-level market 30901
- Home prices YoY
- 4.1%
- Rents YoY
- -1.3%
- Active inventory
- 131
- Price-to-rent
- 3.9×
Monthly cashflow live
- Estimated rent
- $1,799 high interval (Pro) →
- Mortgage (P&I)
- −$446
- Tax est. 1.5%
- −$106 /mo · $1,275/yr
- Insurance
- −$35
- HOA
- −$0
- Vacancy / Maint / Mgmt
- −$378
- Net cashflow
- $833
Break-even live
Sensitivity live
| Price | -10% $892 | -5% $863 | +0% $833 | +5% $804 | +10% $775 |
|---|---|---|---|---|---|
| Rent | -10% $691 | -5% $762 | +0% $833 | +5% $904 | +10% $976 |
| Rate | -1.0pp $876 | -0.5pp $855 | base $833 | +0.5pp $811 | +1.0pp $789 |
UW: 25.0% down · 7.5% · 30yr · 1.5% tax · 5.0% vac · 8.0% maint · 8.0% mgmt
Financing live
Cash to close
- Down payment
- $21,250
- Closing costs
- $2,550
- Reserves months
- —
- Total cash needed
- —
Loan-product check · same deal, 3 products live
Conventional
25% down · 7.5% · 30yr
- Down + closing
- —
- Monthly P&I
- —
- Monthly cashflow
- —
- DSCR
- —
- Eligible?
- —
Personal DTI + credit; lowest rate.
DSCR
20% down · 8.5% · 30yr
- Down + closing
- —
- Monthly P&I
- —
- Monthly cashflow
- —
- DSCR
- —
- Eligible?
- —
No personal income docs; deal must DSCR.
Hard money
10% down · 12.0% · 12mo
- Down + closing
- —
- Monthly P&I
- —
- Monthly cashflow
- —
- DSCR
- —
- Eligible?
- —
Short-term bridge; refi at stabilization.
Rent comps 12 comps
| Address | Beds | Baths | Sqft | Rent | $/sqft | DOM | Units | Dist |
|---|---|---|---|---|---|---|---|---|
| 26 Sherman St Augusta, GA | 3.0 | 2.0 | 1720 | $1,900 | $1.10 | 45d | 1 | 0.46mi |
| 1480 Wrightsboro Rd Augusta, GA | 1.0–3.0 | 1.0–2.0 | 1046 | $1,862 | $1.78 | 23d | 13 | 0.80mi |
| 215 12th St Unit B Augusta, GA | 2.0 | 1.0 | 1365 | $2,100 | $1.54 | 25d | 1 | 1.04mi |
| 215 12th St Unit B Augusta, GA | 2.0 | 1.0 | 1365 | $2,100 | $1.54 | 45d | 1 | 1.04mi |
| 936 Broad St #306 Augusta, GA | 3.0 | 2.0 | 1510 | $2,075 | $1.37 | 25d | 1 | 1.07mi |
| 1812 Slaton St Augusta, GA | 2.0 | 2.0 | 1615 | $1,665 | $1.03 | 25d | 10 | 1.33mi |
| 1315 Merry St Augusta, GA | 3.0 | 2.0 | 1610 | $1,450 | $0.90 | 25d | 1 | 1.35mi |
| 1812 Central Ave Unit 1 Augusta, GA | 3.0 | 1.5 | 1528 | $2,600 | $1.70 | 45d | 1 | 1.42mi |
| 1812 Central Ave Augusta, GA | 3.0 | 1.5 | 1568 | $2,200 | $1.40 | 25d | 1 | 1.42mi |
| 1812 Central Ave Augusta, GA | 3.0 | 1.5 | 1568 | $2,200 | $1.40 | 45d | 1 | 1.42mi |
| 1105 Merry St Augusta, GA | 3.0 | 1.0 | 1281 | $1,350 | $1.05 | 25d | 1 | 1.44mi |
| 1742 Walker St Augusta, GA | 3.0 | 2.0 | 1384 | $1,600 | $1.16 | 46d | 1 | 1.48mi |
Listing history 4 events
-
2026-03-10price $85,000
-
2025-08-26historical
-
2025-06-10$90,000 Active
-
2025-06-10$85,000 Active 332-char remark
ⓘ Source: listings_history table (triggers on properties + properties_extension) + one-shot
backfill from property_details.listing_events for pre-trigger history.
Climate risk First Street
- Flood 1/10 Low FEMA zone X (unshaded) · 0% chance over 30 yrs
- Wildfire 2/10 Low
- Heat 8/10 Severe 7 d/yr ≥108°F today · 17 d/yr by 30 yrs out
- Wind 6/10 Major 62% chance of damaging wind over 30 yrs
- Air quality 4/10 Moderate 4 unhealthy d/yr today · 4 by 30 yrs out
Nearby sold comps map
Loading sold comps map…
Walkable amenities ~0.75 mi
Loading nearby amenities…
Taxation est. · year 1
- Rental income
- $21,583
- − Mortgage interest
- −$4,761
- − Property taxes
- −$1,275
- − Insurance
- −$425
- − Repairs & maintenance
- −$1,727
- − Management
- −$1,727
- − Depreciation
- −$2,473
- Taxable income
- $9,196
- Est. tax owed @ 24.0%
- −$2,207
- After-tax cash flow
- $7,795/yr
For passive investors: Depreciation is non-cash, so a rental often shows a tax loss while cash-flowing — sheltering income. Rental losses are passive: they offset passive income freely, and up to $25,000/yr can offset ordinary (W-2) income if you actively participate and your MAGI is under $100k (phasing out to $0 by $150k); unused losses carry forward. On sale, claimed depreciation is recaptured at up to 25%, and gains may owe capital-gains tax (a 1031 exchange can defer both). Figures are a year-1 estimate at your 24.0% rate — not tax advice; consult a CPA.
Condition & rehab AI · 12 photos
This property requires extensive repairs and updates to become move-in ready. Significant investment is needed to improve its condition and increase its value.
Repairs flagged
- Major siding — Severe weathering
- Major exterior paint — Peeling
- Major flooring — Exposed subfloor
- Major interior walls — Exposed drywall
- Major bathroom fixtures — Dirty, outdated
- Major kitchen appliances — Dirty, outdated
Value-add opportunities
- Resale exterior paint — Fresh paint enhances curb appeal
- Resale interior paint — Fresh paint improves interior appearance
- Both bathroom fixtures — Upgraded fixtures improve functionality and aesthetics
- Both kitchen appliances — Modern appliances enhance functionality and aesthetics
- Both flooring — New flooring improves comfort and appearance
Renovation cost estimate screening
| Repair item | Severity | Est. cost |
|---|---|---|
| siding · Severe weathering | Major | $15,000–50,000 |
| exterior paint · Peeling | Major | $15,000–50,000 |
| flooring · Exposed subfloor | Major | $15,000–50,000 |
| interior walls · Exposed drywall | Major | $15,000–50,000 |
| bathroom fixtures · Dirty, outdated | Major | $15,000–50,000 |
| kitchen appliances · Dirty, outdated | Major | $15,000–50,000 |
| Total estimated repair cost · 6 items | $90,000–300,000 |
Value-add ROI direction
- Resale exterior paint — Fresh paint enhances curb appeal ↑
- Resale interior paint — Fresh paint improves interior appearance ↑
- Both bathroom fixtures — Upgraded fixtures improve functionality and aesthetics ↑
- Both kitchen appliances — Modern appliances enhance functionality and aesthetics ↑
- Both flooring — New flooring improves comfort and appearance ↑
ⓘ Cost ranges are severity-bucket heuristics (US national rule-of-thumb). Get contractor quotes + a written scope before underwriting a rehab budget.
Schools (NCES district)
- District
- Richmond County
- NCES district ID
- 1304380
- Math proficiency
- 12% ▼ -9.00%
- Reading proficiency
- 20% ▼ -6.00%
- Median HH income
- $38,069
- Composite
- 13.43/100
- National rank
- #9524
- State rank
- #154 of 174 in GA
Livability — Augusta-Richmond County consolidated government (balance)
No livability data for this city. (Only ~50 U.S. cities are tracked.)
Census & demographics
- Census place
- Augusta-Richmond County consolidated government (balance), GA
- County
- Richmond County · 190,917 people
- City population
- 154,035
- Metro
- Augusta-Richmond County, GA-SC
- Population (ZIP)
- 16,484
- Household income
- $25,163
- Rent vs Own
- Severe rent burden
- 2063.0
Population outlook (Richmond County) Hauer SSP2
- Today (2025)
- 200,753 people
- By 2030
- 200,232 · -0.3%
- By 2040
- 196,813 · -2.0%
- By 2050
- 190,347 · -5.2%
- By 2075
- 172,496 · -14.1%
- By 2100
- 146,284 · -27.1%
Race, ethnicity, and origin ACS 2023
- Neighborhood character
- Predominantly Black (78%)
- Race & ethnicity
- Black 78% White 15% Two or more races 4% Hispanic / Latino 2%
- Common ancestry
- Lithuanian 1% Slovak 1%
- Foreign-born
- 1% · Canada
- Languages at home
- 97% English-only · Spanish 1%
Political lean MEDSL · Richmond
- 2024 margin
- Solid D (+36.1) · D 67.8% · R 31.7%
- 2008→2024 swing
- +4.3pp toward D · 2008: 31.8pp · 2024: 36.1pp
- All cycles
- 2024: D+36.1 2020: D+37.2 2016: D+32.4 2012: D+33.8 2008: D+31.8
Not yet ingested
- Civics
- —
Market trends
- HPI YoY
- ▲ 8.18%
- Current HPI
- 206.3145
- Rent YoY
- ▼ -1.31%
- Metro
- Augusta-Richmond County, GA-SC
- State GDP YoY
- ▲ 2.66%
- F500 in state
- 28
Industry mix (Fortune 500 HQ in GA)
| Industry | F500 HQs | Revenue |
|---|---|---|
| Paper / Packaging | 2 | $29B |
|
||
| Retail | 1 | $160B |
|
||
| Transportation / Logistics | 1 | $91B |
|
||
| Airlines | 1 | $62B |
|
||
| Consumer Goods | 1 | $47B |
|
||
| Utilities | 1 | $25B |
|
||
Price history
-29.4% since first listed6 events — show timeline
- 2026-06-12 Sold (MLS) $60,000 Hive MLS
- 2026-05-21 Pending — Hive MLS
- 2026-03-10 Price Changed $85,000 Hive MLS
- 2025-08-26 Listing Removed — Hive MLS
- 2025-06-10 Listed $90,000 Hive MLS
- 2025-06-10 Listed $85,000 Hive MLS
Cash-flow waterfall
monthlySold comps — $/sqft
last 12 mo · ≤1 miLoading sold comps…