107 S Van Wyck Ave · Cascade, ID
Flood risk 1/10 · Minimal
- FEMA flood zone
- X (unshaded)
- Chance of flooding over 30 yrs
- 0.0%
- Est. flood insurance / yr
- $507 – $1,088
Fire risk 8/10 · Major
- Est. fire insurance / yr
- $584 – $1,086
Heat risk 2/10 · Minimal
- Hot days now (above 89°F)
- 7 days/yr
- Hot days in 30 yrs
- 18 days/yr
Wind risk 1/10 · Minimal
- Chance of severe wind over 30 yrs
- —
Air-quality risk 7/10 · Major
- Unhealthy air days now
- 10 days/yr
- Unhealthy air days in 30 yrs
- 17 days/yr
Risk factors via First Street. Map © Google.
Why this score? — see what drove the C grade
The composite is a weighted blend of 9 inputs, each scored 0–100. Each bar is that input's sub-score; the figure is the points it added to the 100-point composite (weight × sub-score).
- Cash flow +19.2/30.0
- ARV discount +15.0/15.0
- DSCR +6.1/10.0
- 1% rule +5.1/10.0
- Schools +3.7/10.0
- Livability +3.3/5.0
- Rent growth +2.5/5.0
- Condition / age +2.5/5.0
- Appreciation +0.0/10.0
$375,000
🖨 Deal sheet (PDF) 📄 Offer letter ✓ Due diligence
Listing remarks MLS
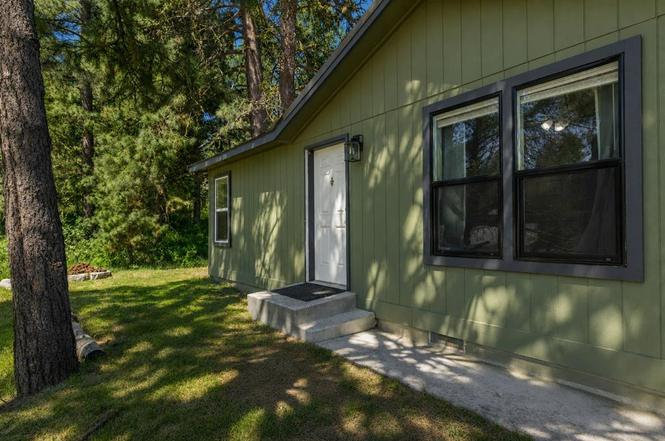
Charming and affordable single-level home in the heart of Cascade! This well-maintained 4-bedroom, 2-bath manufactured home offers over 1,400 square feet of comfortable living space on a concrete foundation. The open-concept floor plan features luxury vinyl plank (LVP) flooring, stainless steel appliances, and a spacious living area perfect for gathering with family and friends. Situated on a generous lot with ample room to build a garage, shop, or additional outdoor living space. Located in downtown Cascade, this property offers the convenience of being close to local shops, restaurants, schools, and everyday amenities. Enjoy year-round access on a maintained road with city services, all while being just minutes from Lake Cascade, Idaho's fourth-largest lake. Outdoor enthusiasts will love the nearby Payette River, public lands, boating, fishing, hiking, ATV trails, and endless recreational opportunities. Whether you're looking for a full-time residence, vacation getaway, or investment property, this home offers an excellent opportunity to enjoy the Cascade lifestyle at an affordable price.
Key facts
- Generous lot
- Single-level home
- Concrete foundation
Tags
Property features AI
Exterior
- Utilities: City water service; Sewer connected
- Home design: Manufactured home on land; Built in 2007
- Construction: Wood siding; Crawl space foundation; Metal roof; Built in 2007
- Exterior features: Metal roof; Standard lot (approx. 6,000–9,999 sq ft); Currently used as a single-family property
Interior
- Kitchen: Dishwasher; Disposal; Microwave; Freestanding oven/range; Pantry
- Bedrooms: 4 bedrooms, all on the main level
- Flooring: Carpet; Laminate
- Bathrooms: 2 bathrooms
- Heating & cooling: Forced air heating; Propane heating; No central air listed
- Interior features: Master bathroom; Main-level master bedroom; Family room; Pantry; Laminate countertops
- Laundry & utility: Electric water heater
Neighborhood map
What this means for you Summary
Snapshot
- This is a 4-bed/2.0-bath manufactured listed at $375k.
Deal economics
- At list price, monthly cash flow is $408 ($5k/yr) — positive.
- The deal already cash-flows at list — no discount required.
- Meets the 1% rule at list price ($4k rent vs $375k).
- Cap rate 7.6% vs local median 3.6% in Cascade — top-decile yield for the area; either an underpriced asset or a hidden risk that comps aren't pricing in. Stress-test before assuming the spread holds.
Location & tenants
- Location reads 66/100 on livability (#116 in ID) — a middle-class / working-renter tenant base. Strengths: housing A+, cost of living A, crime A-; Watch: employment C-, amenities F, commute F.
- Cascade District (rural): math 35% / reading 45% proficiency, ranked #94 of 133 in ID (top 71%) — families likely to look elsewhere, expect single-tenant / working-renter base with shorter leases.
- Zoned schools: Cascade Elementary School (math 54% / reading 44%, grade D, #148 of 357 statewide, top 47%, 119 students, 33% FRL); Cascade Jr/Sr High School (math 54% / reading 74%, grade B-, #10 of 169 statewide, top 7%, 87 students, 15% FRL).
- Zoned-school proficiency averages 57% at this address vs 40% district-wide (+17 pts) — the actual schools serving this property are materially stronger than the Cascade District average implies; a family-tenant draw the district grade alone would hide.
- Market conditions: 410 active listings in the ZIP; 250 units permitted in Valley County in 2024 (0 in 5+ unit buildings).
Forward outlook
- Local home prices are declining (-3.0%/yr); year-one equity from $3k of loan paydown is wiped out by about $11k of value loss. Plan a longer hold.
- Valley County population projected at +7% by 2050 — modest demand growth; plan on rents tracking national, not racing it.
Negotiation context
- Only 3 days on market — expect competitive offers; lowballing is unlikely to land.
- 7 sale attempts since 12y ago with the ask held roughly flat each time — persistent listings suggest the price (not the market) is what's stuck; bring a comps-based counter.
Risks & watch-outs
- Climate carrying-cost: severe wildfire risk — expect insurance premiums to compound above CPI over the hold.
Questions for the listing agent
- Is there a deadline driving the sale (1031 exchange, divorce, estate, relocation)? That informs how much negotiation room exists.
- Schools are D-rated, which usually means shorter tenancies and higher turnover. Who's the typical renter profile here, and what's been the actual vacancy rate?
- What's the average days-on-market for RENTAL listings here right now (not sales)? A rising rental-DOM trend means longer vacancies and softer asking-rent achievability than the comps imply.
- What's the recent tenant-quality profile in this submarket — average credit score on applications, eviction rate, late-payment / NSF rate, and stable-employment percentage? A property-management company in the area should have these aggregated.
- How much new for-sale + rental construction is in the pipeline within 1–3 miles? Heavy new supply typically softens prices + rents 12–24 months out; constrained supply supports both.
Investment metrics
- 1% rule
- 1.01% ✓
- Cap rate
- 7.60%
- Cash-on-cash
- 4.66%
- DSCR
- 1.21
- GRM
- 8.2
CMA / ARV
- ARV (on-the-fly)
- $467,532
- Comps found
- 1
Show comp detail 1 sale within ~0.75 mi
| Address | Dist | Beds/Ba | Sqft | Sold | Price | $/sf | Match |
|---|---|---|---|---|---|---|---|
| 737 S Main St | 0.74mi | 3/2.0 (-1) | 1,248 (-11%) | 12mo | $415,000 | $333 | 32 |
Match score weights: distance 35% · size 25% · config 20% · recency 20%. Top-matched comps best support the ARV.
Projected returns pro-forma
-3.0% appreciation · 3.0% rent growth · sell at horizon
- IRR
- -9.0%
- Equity multiple
- 0.67×
- Total profit
- $-34,715
- Equity at exit
- $55,914
- IRR
- 0.5%
- Equity multiple
- 1.03×
- Total profit
- $3,474
- Equity at exit
- $32,423
Cash invested: $105,000 (down + closing). Projections, not guarantees.
Landlord ↔ Tenant lean methodology
- Overall (STATE)
- 91 Strongly Landlord-Friendly
- State Idaho
- 91 Strongly Landlord-Friendly · R+18
- County
- — inherits STATE
- City
- — inherits STATE
ZIP-level market 83611
- Home prices YoY
- -27.9%
- Active inventory
- 410
- Price-to-rent
- 8.2×
Monthly cashflow live
- Estimated rent
- $3,797 medium interval (Pro) →
- Mortgage (P&I)
- −$1,967
- Tax est. 1.5%
- −$469 /mo · $5,625/yr
- Insurance
- −$156
- HOA
- −$0
- Vacancy / Maint / Mgmt
- −$797
- Net cashflow
- $408
Break-even live
Sensitivity live
| Price | -10% $667 | -5% $538 | +0% $408 | +5% $279 | +10% $149 |
|---|---|---|---|---|---|
| Rent | -10% $108 | -5% $258 | +0% $408 | +5% $558 | +10% $708 |
| Rate | -1.0pp $597 | -0.5pp $503 | base $408 | +0.5pp $311 | +1.0pp $212 |
UW: 25.0% down · 7.5% · 30yr · 1.5% tax · 5.0% vac · 8.0% maint · 8.0% mgmt
Financing live
Cash to close
- Down payment
- $93,750
- Closing costs
- $11,250
- Reserves months
- —
- Total cash needed
- —
Loan-product check · same deal, 3 products live
Conventional
25% down · 7.5% · 30yr
- Down + closing
- —
- Monthly P&I
- —
- Monthly cashflow
- —
- DSCR
- —
- Eligible?
- —
Personal DTI + credit; lowest rate.
DSCR
20% down · 8.5% · 30yr
- Down + closing
- —
- Monthly P&I
- —
- Monthly cashflow
- —
- DSCR
- —
- Eligible?
- —
No personal income docs; deal must DSCR.
Hard money
10% down · 12.0% · 12mo
- Down + closing
- —
- Monthly P&I
- —
- Monthly cashflow
- —
- DSCR
- —
- Eligible?
- —
Short-term bridge; refi at stabilization.
Listing history 4 events
-
2026-06-21statusdays on market $375,000 Pending 3 DOM
-
2026-06-18days on market $375,000 Active 2 DOM
-
2026-06-17remarks 699-char remark
-
2026-06-17$375,000 Active 1 DOM
ⓘ Source: listings_history table (triggers on properties + properties_extension) + one-shot
backfill from property_details.listing_events for pre-trigger history.
Climate risk First Street
- Flood 1/10 Low FEMA zone X (unshaded) · 0% chance over 30 yrs
- Wildfire 8/10 Severe
- Heat 2/10 Low 7 d/yr ≥89°F today · 18 d/yr by 30 yrs out
- Wind 1/10 Low
- Air quality 7/10 Severe 10 unhealthy d/yr today · 17 by 30 yrs out
Nearby sold comps map
Loading sold comps map…
Walkable amenities ~0.75 mi
Loading nearby amenities…
Taxation est. · year 1
- Rental income
- $45,564
- − Mortgage interest
- −$21,006
- − Property taxes
- −$5,625
- − Insurance
- −$1,875
- − Repairs & maintenance
- −$3,645
- − Management
- −$3,645
- − Depreciation
- −$10,909
- Taxable loss
- −$1,141
- Est. tax savings @ 24.0%
- +$274
- After-tax cash flow
- $5,171/yr
For passive investors: Depreciation is non-cash, so a rental often shows a tax loss while cash-flowing — sheltering income. Rental losses are passive: they offset passive income freely, and up to $25,000/yr can offset ordinary (W-2) income if you actively participate and your MAGI is under $100k (phasing out to $0 by $150k); unused losses carry forward. On sale, claimed depreciation is recaptured at up to 25%, and gains may owe capital-gains tax (a 1031 exchange can defer both). Figures are a year-1 estimate at your 24.0% rate — not tax advice; consult a CPA.
Schools (NCES district)
- District
- Cascade District
- NCES district ID
- 1600630
- Math proficiency
- 35% ▲ 5.00%
- Reading proficiency
- 45% ▬ 0.00%
- Median HH income
- $49,227
- Composite
- 36.83/100
- National rank
- #9162
- State rank
- #94 of 133 in ID
Livability — Cascade
- Score
- 66/100
- State rank
- #116
- US rank
- #12378
Category grades
Schools grade is shown separately in the Schools card above.
Census & demographics
- Census place
- Cascade, ID
- Population (ZIP)
- 2,997
Population outlook (Valley County) Hauer SSP2
- Today (2025)
- 10,964 people
- By 2030
- 11,279 · +2.9%
- By 2040
- 11,584 · +5.7%
- By 2050
- 11,754 · +7.2%
- By 2075
- 12,246 · +11.7%
- By 2100
- 11,948 · +9.0%
Race, ethnicity, and origin ACS 2023
- Neighborhood character
- Predominantly White (91%)
- Race & ethnicity
- White 91% Hispanic / Latino 7% Two or more races 6%
- Hispanic origin (detail)
- Mexican 2%
- Common ancestry
- Slovak 7% Dutch 6% Portuguese 5%
- Foreign-born
- 3% · Canada
- Languages at home
- 95% English-only · Spanish 4%
Political lean MEDSL · Valley
- 2024 margin
- R (+18.6) · D 39.6% · R 58.2% · Other 2.2%
- 2008→2024 swing
- -11.6pp toward R · 2008: -6.9pp · 2024: -18.6pp
- All cycles
- 2024: R+18.6 2020: R+13.7 2016: R+18.6 2012: R+11.6 2008: R+6.9
Not yet ingested
- Civics
- —
Market trends
- HPI YoY
- ▼ -118.61%
- Current HPI
- 307.0117
- Rent YoY
- —
- Metro
- —
- State GDP YoY
- ▲ 4.51%
- F500 in state
- 6
Industry mix (Fortune 500 HQ in ID)
| Industry | F500 HQs | Revenue |
|---|---|---|
| Retail | 1 | $79B |
|
||
| Technology | 1 | $25B |
|
||
| Food / Agriculture | 1 | $6B |
|
||
Price history
+400.0% since first listed16 events — show timeline
- 2026-06-16 Listed $375,000 MCAOR
- 2026-06-16 Listed $375,000 IMLS
- 2024-06-06 Sold (Public Records) — Public Records
- 2024-06-06 Sold (MLS) — MCAOR
- 2024-06-06 Sold (MLS) — IMLS
- 2024-03-14 Delisted — MCAOR
- 2024-03-14 Listed $328,500 MCAOR
- 2024-03-14 Listed $328,500 IMLS
- 2018-09-18 Sold (MLS) — IMLS
- 2018-09-14 Sold (Public Records) — Public Records
- 2018-09-14 Sold (MLS) — MCAOR
- 2018-06-29 Listed $139,900 IMLS
- 2018-06-20 Listed $139,900 MCAOR
- 2014-08-29 Sold (Public Records) — Public Records
- 2014-08-29 Sold (MLS) — MCAOR
- 2014-03-13 Listed $75,000 MCAOR
Property tax history
-4.2%/yrLatest (2025): $628 · +9.5% YoY. Source: county tax records.
Cash-flow waterfall
monthlySold comps — $/sqft
last 12 mo · ≤1 miLoading sold comps…