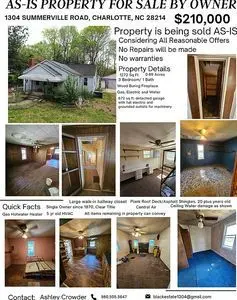
1304 Summerville Rd · Charlotte, NC
Flood risk 4/10 · Minor
- FEMA flood zone
- X (unshaded)
- Chance of flooding over 30 yrs
- 0.22%
- Est. flood insurance / yr
- $507 – $1,088
Fire risk 1/10 · Minimal
- Est. fire insurance / yr
- $906 – $1,684
Heat risk 6/10 · Moderate
- Hot days now (above 103°F)
- 7 days/yr
- Hot days in 30 yrs
- 17 days/yr
Wind risk 5/10 · Moderate
- Chance of severe wind over 30 yrs
- 23.0%
Air-quality risk 3/10 · Minor
- Unhealthy air days now
- 3 days/yr
- Unhealthy air days in 30 yrs
- 4 days/yr
Risk factors via First Street. Map © Google.
Why this score? — see what drove the C+ grade
The composite is a weighted blend of 9 inputs, each scored 0–100. Each bar is that input's sub-score; the figure is the points it added to the 100-point composite (weight × sub-score).
- Cash flow +21.4/30.0
- ARV discount +15.0/15.0
- DSCR +6.8/10.0
- 1% rule +5.1/10.0
- Livability +3.9/5.0
- Schools +3.8/10.0
- Rent growth +3.3/5.0
- Condition / age +2.5/5.0
- Appreciation +0.0/10.0
$195,000
🖨 Deal sheet 📄 Offer letter ✓ Due diligence
Listing remarks
* * * * AS-IS * * * * * This property is being sold as-is. Seller will not be performing repairs or updates to the property. This 3 bd/1 bath home is being sold as is. The property sits on 0.69 Acres and is presently zoned for future development (N1-B). This is a single owner property since 1970. Main Structure is dated. Main Structure has gas, electric and water hookups. Large Garden area in rear of property has well access. Detached workshop/garage is approx 672 sq. ft, wired with full electrical and heavy duty grounded outlets for machinery. Property has been unoccupied for 12 months. Welcoming and Considering all reasonable offers. Additional informaiton available upon reques
Key facts
- Full electrical
- Detached workshop
- Well access
Tags
Property features AI
Exterior
- Home design: Built in 1948
- Exterior features: Located in the Coulwood East subdivision
Interior
- Interior features: Living area approximately 1,272
Neighborhood map
What this means for you Summary
Snapshot
- This is a 3-bed/1.0-bath single-family listed at $195k.
Deal economics
- At list price, monthly cash flow is $289 ($3k/yr) — positive.
- The deal already cash-flows at list — no discount required.
- Meets the 1% rule at list price ($2k rent vs $195k).
- Recommended offer: $192k (1.5% below list) — sets the bar for market timing.
- Cap rate 8.1% vs local median 3.1% in Charlotte — top-decile yield for the area; either an underpriced asset or a hidden risk that comps aren't pricing in. Stress-test before assuming the spread holds.
Location & tenants
- Location reads 78/100 on livability (#26 in NC, #2,502 nationally) — a middle-class / working-renter tenant base. Strengths: amenities A+, commute A+, housing A+; Watch: schools D+, crime F.
- Charlotte-Mecklenburg Schools (urban): math 42% / reading 46% proficiency, ranked #85 of 178 in NC (top 48%) — families likely to look elsewhere, expect single-tenant / working-renter base with shorter leases.
- Market conditions: Rents rising (+3.4%/yr); 363 active listings in the ZIP; 39 comparable units currently listed for rent nearby; rentals at typical pace (median 15d on market — plan ~3-4 weeks tenant-placement turnaround); solid renter incomes; 11,969 units permitted in Mecklenburg County in 2024 (5,377 in 5+ unit buildings).
Forward outlook
- Local home prices are declining (-3.0%/yr); year-one equity from $1k of loan paydown is wiped out by about $6k of value loss. Plan a longer hold.
- Mecklenburg County population projected at +53% by 2050 — long-run rental-demand tailwind backs the buy-and-hold thesis.
Negotiation context
- It's been on market 23 days — a 2% lower offer ($192k) is reasonable based on typical stale-listing flexibility.
Risks & watch-outs
- Watch-outs: built in 1948 — expect roof / HVAC / electrical / plumbing capex.
- Climate carrying-cost: moderate wind risk, 23% chance of damaging wind over 30y; extreme-heat days projected 7→17/yr by 2055 (HVAC capex compounding) — expect insurance premiums to compound above CPI over the hold.
Questions for the listing agent
- Built in 1948 — when were the roof, HVAC, electrical panel, plumbing, and water heater last replaced?
- Is there a deadline driving the sale (1031 exchange, divorce, estate, relocation)? That informs how much negotiation room exists.
- Schools are D-rated, which usually means shorter tenancies and higher turnover. Who's the typical renter profile here, and what's been the actual vacancy rate?
- Crime grade is F in this area — have there been break-ins, vandalism, or insurance claims at this property in the last 3 years? What carrier currently insures it and at what premium?
- What's the average days-on-market for RENTAL listings here right now (not sales)? A rising rental-DOM trend means longer vacancies and softer asking-rent achievability than the comps imply.
- What's the recent tenant-quality profile in this submarket — average credit score on applications, eviction rate, late-payment / NSF rate, and stable-employment percentage? A property-management company in the area should have these aggregated.
- How much new for-sale + rental construction is in the pipeline within 1–3 miles? Heavy new supply typically softens prices + rents 12–24 months out; constrained supply supports both.
Investment metrics
- 1% rule
- 1.01% ✓
- Cap rate
- 8.07%
- Cash-on-cash
- 6.35%
- DSCR
- 1.28
- GRM
- 8.2
CMA / ARV
- ARV (on-the-fly)
- $312,912
- Comps found
- 12
Show comp detail 12 sales within ~0.75 mi
| Address | Dist | Beds/Ba | Sqft | Sold | Price | $/sf | Match |
|---|---|---|---|---|---|---|---|
| 1415 Summerville Rd | 0.11mi | 3/2.0 | 1,190 (-6%) | 9mo | $315,000 | $265 | 72 |
| 119 Winding Canyon Dr | 0.49mi | 3/2.0 | 1,291 (+2%) | 10mo | $270,000 | $209 | 62 |
| 2213 Silver Creek Rd | 0.29mi | 3/2.5 | 1,317 (+4%) | 15mo | $309,185 | $235 | 62 |
| 832 Lakehill Rd | 0.47mi | 3/2.0 | 1,344 (+6%) | 8mo | $259,000 | $193 | 58 |
| 909 Jordans Pond Ln | 0.60mi | 3/2.0 | 1,261 (-1%) | 11mo | $342,500 | $272 | 58 |
| 706 Jordans Pond Ln | 0.67mi | 3/2.0 | 1,272 (0%) | 14mo | $350,000 | $275 | 53 |
| 8035 Bristle Ln | 0.59mi | 3/2.0 | 1,211 (-5%) | 12mo | $298,000 | $246 | 50 |
| 133 Winding Canyon Dr | 0.48mi | 3/2.0 | 1,411 (+11%) | 14mo | $273,500 | $194 | 43 |
| 8027 Bristle Ln | 0.58mi | 3/2.0 | 1,144 (-10%) | 12mo | $295,000 | $258 | 42 |
| 1130 Jordans Pond Ln | 0.62mi | 3/2.0 | 1,165 (-8%) | 16mo | $289,000 | $248 | 40 |
| 938 Valley Ridge Rd | 0.43mi | 3/2.5 | 1,436 (+13%) | 16mo | $324,000 | $226 | 39 |
| 8524 Emerald Fern Way | 0.72mi | 3/2.5 | 1,414 (+11%) | 10mo | $305,000 | $216 | 33 |
Match score weights: distance 35% · size 25% · config 20% · recency 20%. Top-matched comps best support the ARV.
Projected returns pro-forma
-3.0% appreciation · 3.35% rent growth · sell at horizon
- IRR
- -6.1%
- Equity multiple
- 0.77×
- Total profit
- $-12,504
- Equity at exit
- $29,075
- IRR
- 3.9%
- Equity multiple
- 1.29×
- Total profit
- $15,640
- Equity at exit
- $16,860
Cash invested: $54,600 (down + closing). Projections, not guarantees.
Landlord ↔ Tenant lean methodology
- Overall (STATE)
- 85 Strongly Landlord-Friendly
- State North Carolina
- 85 Strongly Landlord-Friendly · R+3
- County
- — inherits STATE
- City
- — inherits STATE
ZIP-level market 28214
- Home prices YoY
- -26.7%
- Rents YoY
- 3.4%
- Active inventory
- 363
- Price-to-rent
- 8.2×
Monthly cashflow live
- Estimated rent
- $1,976 high interval (Pro) →
- Mortgage (P&I)
- −$1,023
- Tax from tax record
- −$168 /mo · $2,016/yr
- Insurance
- −$81
- HOA
- −$0
- Vacancy / Maint / Mgmt
- −$415
- Net cashflow
- $289
Break-even live
UW: 25.0% down · 7.5% · 30yr · 1.5% tax · 5.0% vac · 8.0% maint · 8.0% mgmt
Financing live
Cash to close
- Down payment
- $48,750
- Closing costs
- $5,850
- Reserves months
- —
- Total cash needed
- —
Loan-product check · same deal, 3 products live
Conventional
25% down · 7.5% · 30yr
- Down + closing
- —
- Monthly P&I
- —
- Monthly cashflow
- —
- DSCR
- —
- Eligible?
- —
Personal DTI + credit; lowest rate.
DSCR
20% down · 8.5% · 30yr
- Down + closing
- —
- Monthly P&I
- —
- Monthly cashflow
- —
- DSCR
- —
- Eligible?
- —
No personal income docs; deal must DSCR.
Hard money
10% down · 12.0% · 12mo
- Down + closing
- —
- Monthly P&I
- —
- Monthly cashflow
- —
- DSCR
- —
- Eligible?
- —
Short-term bridge; refi at stabilization.
Rent comps 39 comps
| Address | Beds | Baths | Sqft | Rent | $/sqft | DOM | Units | Dist |
|---|---|---|---|---|---|---|---|---|
| 831 Valley Ridge Rd Charlotte, NC | 3.0 | 2.5 | 1436 | $1,820 | $1.27 | 23d | 1 | 0.35mi |
| 7136 Roaming Path Ct Charlotte, NC | 3.0 | 2.0 | 1643 | $1,845 | $1.12 | 7d | 1 | 0.37mi |
| 310 Winding Canyon Dr Charlotte, NC | 3.0 | 2.5 | 1470 | $1,899 | $1.29 | 3d | 1 | 0.46mi |
| 635 Wilderness Trail Dr Charlotte, NC | 4.0 | 2.5 | 1570 | $1,795 | $1.14 | 23d | 1 | 0.47mi |
| 211 Winding Canyon Dr Charlotte, NC | 3.0 | 2.5 | 1488 | $1,925 | $1.29 | 3d | 1 | 0.49mi |
| 129 Winding Canyon Dr Charlotte, NC | 4.0 | 2.0 | 1416 | $1,715 | $1.21 | 7d | 1 | 0.51mi |
| 7823 Montbrook Dr Charlotte, NC | 3.0 | 2.5 | 1547 | $1,870 | $1.21 | 7d | 1 | 0.52mi |
| 1028 Jordans Pond Ln Charlotte, NC | 3.0 | 2.5 | 1558 | $1,905 | $1.22 | 7d | 1 | 0.56mi |
| 1015 Alston Hill Dr Charlotte, NC | 4.0 | 2.5 | 1560 | $1,795 | $1.15 | 23d | 1 | 0.59mi |
| 814 Oakshire Cir Charlotte, NC | 3.0 | 2.0 | 1514 | $1,775 | $1.17 | 14d | 1 | 0.61mi |
| 1024 Stinson Glen Ln Charlotte, NC | 3.0 | 2.0 | 1422 | $1,770 | $1.24 | 7d | 1 | 0.63mi |
| 1123 Alston Hill Dr Charlotte, NC | 4.0 | 2.0 | 1660 | $1,819 | $1.10 | 21d | 1 | 0.66mi |
| 7117 Red Bud Cir Charlotte, NC | 3.0 | 2.0 | 1400 | $1,819 | $1.30 | 16d | 1 | 0.67mi |
| 7635 Ethora Way Charlotte, NC | 3.0 | 2.5 | 1573 | $2,150 | $1.37 | 5d | 1 | 0.76mi |
| 1224 Settlers Bridge Ct Charlotte, NC | 3.0 | 2.0 | 1075 | $1,799 | $1.67 | 2d | 1 | 0.81mi |
| 7413 Hidden Creek Dr Charlotte, NC | 4.0 | 2.5 | 1428 | $1,995 | $1.40 | 14d | 1 | 0.86mi |
| 6228 Cottageville Ln Charlotte, NC | 3.0 | 2.0 | 970 | $1,640 | $1.69 | 23d | 1 | 0.88mi |
| 7145 Streator Ct Charlotte, NC | 3.0 | 2.5 | 1648 | $1,899 | $1.15 | 20d | 1 | 0.91mi |
| 1817 Balfour Ln Charlotte, NC | 3.0 | 2.5 | 1496 | $1,350 | $0.90 | 13d | 1 | 0.99mi |
| 6417 Sunman Rd Charlotte, NC | 3.0 | 2.0 | 1224 | $1,699 | $1.39 | 23d | 1 | 1.05mi |
| 7010 Wandering Creek Dr Charlotte, NC | 3.0 | 2.0 | 1222 | $1,300 | $1.06 | 13d | 1 | 1.09mi |
| 432 McGinn Grove Dr Charlotte, NC | 3.0 | 2.5 | 1819 | $1,995 | $1.10 | 23d | 1 | 1.16mi |
| 644 Stillgreen Ln Charlotte, NC | 3.0 | 2.0 | 1700 | $2,230 | $1.31 | 14d | 1 | 1.18mi |
| 6211 Whispering Brook Ct Charlotte, NC | 3.0 | 2.0 | 1235 | $1,819 | $1.47 | 23d | 1 | 1.19mi |
| 6831 Sunman Rd Charlotte, NC | 3.0 | 2.5 | 1664 | $1,795 | $1.08 | 23d | 1 | 1.20mi |
| 6831 Sunman Rd Charlotte, NC | 3.0 | 2.5 | 1664 | $1,795 | $1.08 | 5d | 1 | 1.20mi |
| 1216 Eagle Ridge Dr Charlotte, NC | 3.0 | 2.0 | 1174 | $3,150 | $2.68 | 23d | 1 | 1.41mi |
| 1132 Hipp Rd Charlotte, NC | 3.0 | 2.0 | 1700 | $1,950 | $1.15 | 7d | 1 | 1.41mi |
| 935 Tom Sadler Rd Unit A Charlotte, NC | 3.0 | 2.0 | 1008 | $1,395 | $1.38 | 23d | 1 | 1.41mi |
| 1207 Joannas Ct Charlotte, NC | 4.0 | 2.5 | 1535 | $1,800 | $1.17 | 4d | 1 | 1.42mi |
| 1207 Joannas Ct Charlotte, NC | 4.0 | 2.5 | 1535 | $1,800 | $1.17 | 16d | 1 | 1.42mi |
| 4604 Palm Breeze Ln Charlotte, NC | 3.0 | 2.0 | 1016 | $1,495 | $1.47 | 2d | 1 | 1.43mi |
| 1318 Nadies Ct Charlotte, NC | 3.0 | 2.5 | 1292 | $1,749 | $1.35 | 23d | 1 | 1.45mi |
| 1318 Nadies Ct Charlotte, NC | 3.0 | 2.0 | 1292 | $1,749 | $1.35 | 20d | 1 | 1.45mi |
| 1227 Joannas Ct Charlotte, NC | 4.0 | 2.0 | 1322 | $1,825 | $1.38 | 14d | 1 | 1.46mi |
| 1231 Joannas Ct Charlotte, NC | 4.0 | 2.5 | 1535 | $2,050 | $1.34 | 16d | 1 | 1.47mi |
| 1033 Rook Rd Charlotte, NC | 3.0 | 2.5 | 1476 | $3,000 | $2.03 | 7d | 1 | 1.48mi |
| 5194 Brooktree Dr Charlotte, NC | 4.0 | 2.5 | 1426 | $1,750 | $1.23 | 11d | 1 | 1.49mi |
| 5176 Brooktree Dr Charlotte, NC | 4.0 | 2.5 | 1506 | $1,995 | $1.32 | 23d | 1 | 1.49mi |
Listing history 13 events
-
2026-06-18days on market $195,000 Active 23 DOM
-
2026-06-17pricedays on market $195,000 Active 22 DOM
-
2026-06-16days on market $210,000 Active 21 DOM
-
2026-06-15days on market $210,000 Active 20 DOM
-
2026-06-13days on market $210,000 Active 18 DOM
-
2026-06-10days on market $210,000 Active 14 DOM
-
2026-06-07days on market $210,000 Active 12 DOM
-
2026-06-04days on market $210,000 Active 9 DOM
-
2026-06-03days on market $210,000 Active 8 DOM
-
2026-06-02days on market $210,000 Active 7 DOM
-
2026-06-02days on market $210,000 Active 6 DOM
-
2026-05-31days on market $210,000 Active 5 DOM
-
2026-05-26$210,000 Active
ⓘ Source: listings_history table (triggers on properties + properties_extension) + one-shot
backfill from property_details.listing_events for pre-trigger history.
Tax reassessment forecast NC · Resets to sale price
- Current annual tax
- $2,016 · $168/mo
- Projected year-2 tax
- $2,016 · $168/mo
- Expected delta
- $0/yr ($0/mo · 0.0%)
ⓘ Screening estimate from a state-policy table — verify with the county assessor before closing.
Climate risk First Street
- Flood 4/10 Moderate FEMA zone X (unshaded) · 22% chance over 30 yrs
- Wildfire 1/10 Low
- Heat 6/10 Major 7 d/yr ≥103°F today · 17 d/yr by 30 yrs out
- Wind 5/10 Major 23% chance of damaging wind over 30 yrs
- Air quality 3/10 Moderate 3 unhealthy d/yr today · 4 by 30 yrs out
Nearby sold comps map
Loading sold comps map…
Walkable amenities ~0.75 mi
Loading nearby amenities…
Taxation est. · year 1
- Rental income
- $23,711
- − Mortgage interest
- −$10,923
- − Property taxes
- −$2,016
- − Insurance
- −$975
- − Repairs & maintenance
- −$1,897
- − Management
- −$1,897
- − Depreciation
- −$5,673
- Taxable income
- $330
- Est. tax owed @ 24.0%
- −$79
- After-tax cash flow
- $3,390/yr
For passive investors: Depreciation is non-cash, so a rental often shows a tax loss while cash-flowing — sheltering income. Rental losses are passive: they offset passive income freely, and up to $25,000/yr can offset ordinary (W-2) income if you actively participate and your MAGI is under $100k (phasing out to $0 by $150k); unused losses carry forward. On sale, claimed depreciation is recaptured at up to 25%, and gains may owe capital-gains tax (a 1031 exchange can defer both). Figures are a year-1 estimate at your 24.0% rate — not tax advice; consult a CPA.
Schools (NCES district)
- District
- Charlotte-Mecklenburg Schools
- NCES district ID
- 3702970
- Math proficiency
- 42% ▼ -6.00%
- Reading proficiency
- 46% ▲ 1.00%
- Median HH income
- $57,175
- Composite
- 38.49/100
- National rank
- #4183
- State rank
- #85 of 178 in NC
Livability — Charlotte
- Score
- 78/100
- State rank
- #26
- US rank
- #2502
Category grades
Schools grade is shown separately in the Schools card above.
Census & demographics
- Census place
- Charlotte, NC
- County
- Mecklenburg County · 1,167,319 people
- City population
- 920,422
- Metro
- Charlotte-Concord-Gastonia, NC-SC
- Population (ZIP)
- 43,837
- Household income
- $86,447
- Rent vs Own
- Severe rent burden
- 671.0
Population outlook (Mecklenburg County) Hauer SSP2
- Today (2025)
- 1,305,740 people
- By 2030
- 1,442,752 · +10.5%
- By 2040
- 1,722,441 · +31.9%
- By 2050
- 1,999,450 · +53.1%
- By 2075
- 2,642,495 · +102.4%
- By 2100
- 3,106,755 · +137.9%
Race, ethnicity, and origin ACS 2023
- Neighborhood character
- Highly diverse neighborhood (Simpson 0.71)
- Race & ethnicity
- Black 40% White 30% Hispanic / Latino 18% Two or more races 9% Asian 6%
- Hispanic origin (detail)
- Mexican 9% Puerto Rican 1% Dominican 1%
- Common ancestry
- Serbian 1% Italian 1% Slovak 1%
- Foreign-born
- 15% · Canada, Vietnam, China
- Languages at home
- 77% English-only · Spanish 15% Vietnamese 2% Other Asian/Pacific 2%
Political lean MEDSL · Mecklenburg
- 2024 margin
- Solid D (+32.9) · D 65.6% · R 32.7% · Other 1.6%
- 2008→2024 swing
- +8.5pp toward D · 2008: 24.4pp · 2024: 32.9pp
- All cycles
- 2024: D+32.9 2020: D+35.1 2016: D+29.9 2012: D+22.5 2008: D+24.4
Not yet ingested
- Civics
- —
Market trends
- HPI YoY
- ▼ -100.82%
- Current HPI
- 277.2903
- Rent YoY
- ▲ 3.35%
- Metro
- Charlotte-Concord-Gastonia, NC-SC
- State GDP YoY
- ▲ 3.28%
- F500 in state
- 26
Industry mix (Fortune 500 HQ in NC)
| Industry | F500 HQs | Revenue |
|---|---|---|
| Financial Services | 2 | $213B |
|
||
| Retail | 2 | $95B |
|
||
| Industrial Conglomerate | 1 | $38B |
|
||
| Metals / Steel | 1 | $35B |
|
||
| Utilities | 1 | $30B |
|
||
| Industrial Machinery | 1 | $19B |
|
||
Price history
1 event — show timeline
- 2026-05-26 Listed $210,000 FSBO.com
Property tax history
+3.1%/yrLatest (2025): $2,016 · +2.2% YoY. Source: county tax records.
Cash-flow waterfall
monthlySold comps — $/sqft
last 12 mo · ≤1 miLoading sold comps…