100 Hyline Dr · Keene, TX
Flood risk 1/10 · Minimal
- FEMA flood zone
- X (unshaded)
- Chance of flooding over 30 yrs
- 0.0%
- Est. flood insurance / yr
- $507 – $1,088
Fire risk 5/10 · Moderate
- Est. fire insurance / yr
- $1,222 – $2,270
Heat risk 7/10 · Major
- Hot days now (above 109°F)
- 7 days/yr
- Hot days in 30 yrs
- 24 days/yr
Wind risk 6/10 · Moderate
- Chance of severe wind over 30 yrs
- 27.0%
Air-quality risk 2/10 · Minimal
- Unhealthy air days now
- 2 days/yr
- Unhealthy air days in 30 yrs
- 2 days/yr
Risk factors via First Street. Map © Google.
Why this score? — see what drove the D+ grade
The composite is a weighted blend of 9 inputs, each scored 0–100. Each bar is that input's sub-score; the figure is the points it added to the 100-point composite (weight × sub-score).
- ARV discount +15.0/15.0
- Cash flow +11.5/30.0
- 1% rule +4.7/10.0
- Schools +4.5/10.0
- Livability +3.6/5.0
- DSCR +3.4/10.0
- Rent growth +2.5/5.0
- Condition / age +2.5/5.0
- Appreciation +0.0/10.0
$239,900
🖨 Deal sheet (PDF) 📄 Offer letter ✓ Due diligence
Listing remarks MLS
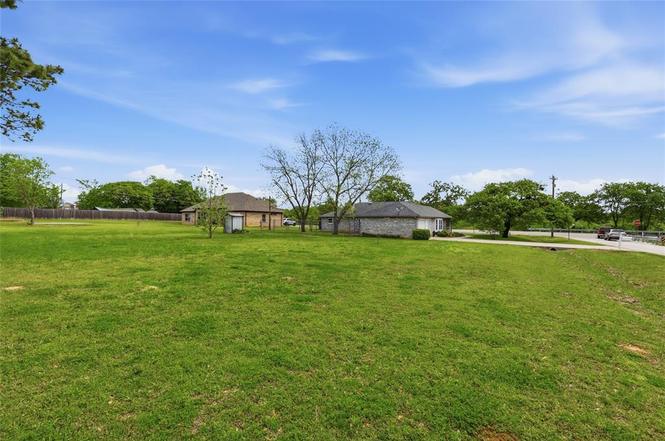
Great, one owner home in an established neighborhood. Large lot with mature trees. Super floorplan with lots of potential for owner occupied or investor. Well maintained and ready to move in. Location has easy access to US Hwy 67 or I-35W. Less than 2 miles from college campus. Seller does not have a SURVEY
Key facts
- Survey available
- Acre lot
- Generous lot size
Tags
Neighborhood map
What this means for you Summary
Snapshot
- This is a 3-bed/2.0-bath single-family listed at $240k.
Deal economics
- At list price, monthly cash flow is $-77 ($-926/yr) — negative.
- To cash-flow at today's rent, offer at most $226k (5.7% below list).
- To meet the 1% rule (rent ≥ 1% of price), the offer needs to be $233k (2.7% below list).
- Recommended offer: $226k (6.0% below list) — sets the bar for market timing.
- Cap rate 5.9% vs local median 3.2% in Keene — top-decile yield for the area; either an underpriced asset or a hidden risk that comps aren't pricing in. Stress-test before assuming the spread holds.
Location & tenants
- Location reads 72/100 on livability (#249 in TX) — a middle-class / working-renter tenant base. Strengths: crime A+, cost of living A+, housing A+; Watch: employment D+, amenities F, commute F.
- Joshua ISD (rural): math 52% / reading 50% proficiency, ranked #139 of 826 in TX (top 17%) — acceptable for families but not a draw, mixed tenant base, ~2y average lease.
- Zoned schools: Plum Creek El (math 54% / reading 48%, grade C-, #818 of 4,322 statewide, top 19%, 462 students, 58% FRL); R C Loflin Middle (math 41% / reading 45%, grade D-, #540 of 1,662 statewide, top 33%, 730 students, 55% FRL); Joshua H S (math 67% / reading 15%, grade F, #774 of 1,632 statewide, top 49%, 1,242 students, 44% FRL).
- Market conditions: 338 active listings in the ZIP; 2 comparable units currently listed for rent nearby; 2,152 units permitted in Johnson County in 2024 (76 in 5+ unit buildings).
Forward outlook
- Local home prices are declining (-3.0%/yr); year-one equity from $2k of loan paydown is wiped out by about $7k of value loss. Plan a longer hold.
- Johnson County population projected at +24% by 2050 — long-run rental-demand tailwind backs the buy-and-hold thesis.
Negotiation context
- It's been on market 67 days — a 6% lower offer ($226k) is reasonable based on typical stale-listing flexibility.
- 3 sale attempts since 4y ago with the ask held roughly flat each time — persistent listings suggest the price (not the market) is what's stuck; bring a comps-based counter.
Risks & watch-outs
- Watch-outs: property tax is 2.8% of price.
- Climate carrying-cost: major wind risk, 27% chance of damaging wind over 30y; moderate wildfire risk; extreme-heat days projected 7→24/yr by 2055 (HVAC capex compounding) — expect insurance premiums to compound above CPI over the hold.
Questions for the listing agent
- What do current leases actually rent for vs. the listed asking? Can we see a recent rent roll and the last 12 months of T-12 income?
- It's been on market 67 days. Have you received any prior offers? Is the seller open to a 6% concession, seller financing, or rate buy-down credit?
- Property tax is high relative to price — has the assessment been appealed recently, and will the sale trigger a re-assessment?
- Why hasn't it sold? Are there any deal-killer items the seller is aware of (foundation, flood, title, zoning, code violations)?
- Is there a deadline driving the sale (1031 exchange, divorce, estate, relocation)? That informs how much negotiation room exists.
- Schools are D-rated, which usually means shorter tenancies and higher turnover. Who's the typical renter profile here, and what's been the actual vacancy rate?
- The area grade is low — what's the realistic commute time and amenity access for the typical tenant pool here? Any planned neighborhood developments (good or bad) we should know about?
- What's the average days-on-market for RENTAL listings here right now (not sales)? A rising rental-DOM trend means longer vacancies and softer asking-rent achievability than the comps imply.
- What's the recent tenant-quality profile in this submarket — average credit score on applications, eviction rate, late-payment / NSF rate, and stable-employment percentage? A property-management company in the area should have these aggregated.
- How much new for-sale + rental construction is in the pipeline within 1–3 miles? Heavy new supply typically softens prices + rents 12–24 months out; constrained supply supports both.
Investment metrics
- 1% rule
- 0.97% ✗
- Cap rate
- 5.91%
- Cash-on-cash
- -1.38%
- DSCR
- 0.94
- GRM
- 8.6
CMA / ARV
- ARV (on-the-fly)
- $351,560
- Comps found
- 3
Show comp detail 3 sales within ~0.75 mi
| Address | Dist | Beds/Ba | Sqft | Sold | Price | $/sf | Match |
|---|---|---|---|---|---|---|---|
| 100 Hyline Dr | 0.00mi | 3/2.0 | 1,870 (0%) | 1mo | $239,900 | $128 | 99 |
| 2720 Hill Ln | 0.29mi | 3/2.5 | 1,997 (+7%) | 5mo | $385,000 | $193 | 69 |
| 2809 County Road 805b | 0.63mi | 3/2.0 | 1,733 (-7%) | 18mo | $325,000 | $188 | 43 |
Match score weights: distance 35% · size 25% · config 20% · recency 20%. Top-matched comps best support the ARV.
Projected returns pro-forma
-3.0% appreciation · 3.0% rent growth · sell at horizon
- IRR
- -18.5%
- Equity multiple
- 0.35×
- Total profit
- $-43,593
- Equity at exit
- $35,770
- IRR
- -10.6%
- Equity multiple
- 0.35×
- Total profit
- $-43,489
- Equity at exit
- $20,742
Cash invested: $67,172 (down + closing). Projections, not guarantees.
Landlord ↔ Tenant lean methodology
- Overall (STATE)
- 87 Strongly Landlord-Friendly
- State Texas
- 87 Strongly Landlord-Friendly · R+5
- County
- — inherits STATE
- City
- — inherits STATE
ZIP-level market 76031
- Home prices YoY
- -17.6%
- Active inventory
- 338
- Price-to-rent
- 8.6×
Monthly cashflow live
- Estimated rent
- $2,335 medium interval (Pro) →
- Mortgage (P&I)
- −$1,258
- Tax from tax record
- −$564 /mo · $6,763/yr
- Insurance
- −$100
- HOA
- −$0
- Vacancy / Maint / Mgmt
- −$490
- Net cashflow
- $-77
Break-even live
Sensitivity live
| Price | -10% $59 | -5% $-9 | +0% $-77 | +5% $-145 | +10% $-213 |
|---|---|---|---|---|---|
| Rent | -10% $-262 | -5% $-169 | +0% $-77 | +5% $15 | +10% $107 |
| Rate | -1.0pp $44 | -0.5pp $-16 | base $-77 | +0.5pp $-139 | +1.0pp $-203 |
UW: 25.0% down · 7.5% · 30yr · 1.5% tax · 5.0% vac · 8.0% maint · 8.0% mgmt
Financing live
Cash to close
- Down payment
- $59,975
- Closing costs
- $7,197
- Reserves months
- —
- Total cash needed
- —
Loan-product check · same deal, 3 products live
Conventional
25% down · 7.5% · 30yr
- Down + closing
- —
- Monthly P&I
- —
- Monthly cashflow
- —
- DSCR
- —
- Eligible?
- —
Personal DTI + credit; lowest rate.
DSCR
20% down · 8.5% · 30yr
- Down + closing
- —
- Monthly P&I
- —
- Monthly cashflow
- —
- DSCR
- —
- Eligible?
- —
No personal income docs; deal must DSCR.
Hard money
10% down · 12.0% · 12mo
- Down + closing
- —
- Monthly P&I
- —
- Monthly cashflow
- —
- DSCR
- —
- Eligible?
- —
Short-term bridge; refi at stabilization.
Rent comps 2 comps
| Address | Beds | Baths | Sqft | Rent | $/sqft | DOM | Units | Dist |
|---|---|---|---|---|---|---|---|---|
| 3617 Northcrest Dr Cleburne, TX | 4.0 | 3.0 | 2520 | $3,150 | $1.25 | 0d | 1 | 1.12mi |
| 400 Wells Ct Keene, TX | 3.0 | 2.0 | 1250 | $1,295 | $1.04 | 0d | 1 | 1.29mi |
Listing history 12 events
-
2026-04-28status Pending
-
2026-03-24status Active
-
2026-03-23status Pending
-
2026-03-11historical Active Option Contract
-
2026-03-06price $239,900
-
2026-02-19$245,000 Active
-
2026-02-13soldstatus
-
2026-02-13soldstatus
-
2022-08-08soldstatus
-
2022-08-05soldstatus Closed 309-char remark
Show marketing remark (309 chars)
Great, one owner home in an established neighborhood. Large lot with mature trees. Super floorplan with lots of potential for owner occupied or investor. Well maintained and ready to move in. Location has easy access to US Hwy 67 or I-35W. Less than 2 miles from college campus. Seller does not have a SURVEY
-
2022-07-10historical Active Option Contract 309-char remark
Show marketing remark (309 chars)
Great, one owner home in an established neighborhood. Large lot with mature trees. Super floorplan with lots of potential for owner occupied or investor. Well maintained and ready to move in. Location has easy access to US Hwy 67 or I-35W. Less than 2 miles from college campus. Seller does not have a SURVEY
-
2022-06-29$265,000 Active 309-char remark
Show marketing remark (309 chars)
Great, one owner home in an established neighborhood. Large lot with mature trees. Super floorplan with lots of potential for owner occupied or investor. Well maintained and ready to move in. Location has easy access to US Hwy 67 or I-35W. Less than 2 miles from college campus. Seller does not have a SURVEY
ⓘ Source: listings_history table (triggers on properties + properties_extension) + one-shot
backfill from property_details.listing_events for pre-trigger history.
Tax reassessment forecast TX · Resets to sale price
- Current annual tax
- $6,763 · $564/mo
- Projected year-2 tax
- $6,763 · $564/mo
- Expected delta
- $0/yr ($0/mo · 0.0%)
ⓘ Screening estimate from a state-policy table — verify with the county assessor before closing.
Climate risk First Street
- Flood 1/10 Low FEMA zone X (unshaded) · 0% chance over 30 yrs
- Wildfire 5/10 Major
- Heat 7/10 Severe 7 d/yr ≥109°F today · 24 d/yr by 30 yrs out
- Wind 6/10 Major 27% chance of damaging wind over 30 yrs
- Air quality 2/10 Low 2 unhealthy d/yr today · 2 by 30 yrs out
Nearby sold comps map
Loading sold comps map…
Walkable amenities ~0.75 mi
Loading nearby amenities…
Taxation est. · year 1
- Rental income
- $28,016
- − Mortgage interest
- −$13,438
- − Property taxes
- −$6,763
- − Insurance
- −$1,200
- − Repairs & maintenance
- −$2,241
- − Management
- −$2,241
- − Depreciation
- −$6,979
- Taxable loss
- −$4,846
- Est. tax savings @ 24.0%
- +$1,163
- After-tax cash flow
- $237/yr
For passive investors: Depreciation is non-cash, so a rental often shows a tax loss while cash-flowing — sheltering income. Rental losses are passive: they offset passive income freely, and up to $25,000/yr can offset ordinary (W-2) income if you actively participate and your MAGI is under $100k (phasing out to $0 by $150k); unused losses carry forward. On sale, claimed depreciation is recaptured at up to 25%, and gains may owe capital-gains tax (a 1031 exchange can defer both). Figures are a year-1 estimate at your 24.0% rate — not tax advice; consult a CPA.
Schools (NCES district)
- District
- Joshua ISD
- NCES district ID
- 4824930
- Math proficiency
- 52% ▼ -7.00%
- Reading proficiency
- 50% ▼ -1.00%
- Median HH income
- $60,696
- Composite
- 44.65/100
- National rank
- #2769
- State rank
- #139 of 826 in TX
Livability — Keene
- Score
- 72/100
- State rank
- #249
- US rank
- #5923
Category grades
Schools grade is shown separately in the Schools card above.
Census & demographics
- Census place
- Keene, TX
- City population
- 5,333
- Population (ZIP)
- 18,697
Population outlook (Johnson County) Hauer SSP2
- Today (2025)
- 179,678 people
- By 2030
- 189,208 · +5.3%
- By 2040
- 207,261 · +15.4%
- By 2050
- 223,064 · +24.1%
- By 2075
- 259,979 · +44.7%
- By 2100
- 275,395 · +53.3%
Race, ethnicity, and origin ACS 2023
- Neighborhood character
- Predominantly White (66%)
- Race & ethnicity
- White 66% Hispanic / Latino 28% Two or more races 12% Black 3%
- Hispanic origin (detail)
- Mexican 23% Puerto Rican 3%
- Common ancestry
- Italian 1% Lithuanian 1% Slovak 1%
- Foreign-born
- 5% · Canada, Vietnam
- Languages at home
- 77% English-only · Spanish 22% Vietnamese 0%
Political lean MEDSL · Johnson
- 2024 margin
- Solid R (+51.4) · D 23.9% · R 75.3%
- 2008→2024 swing
- -3.9pp toward R · 2008: -47.5pp · 2024: -51.4pp
- All cycles
- 2024: R+51.4 2020: R+53.0 2016: R+58.3 2012: R+55.6 2008: R+47.5
Not yet ingested
- Civics
- —
Market trends
- HPI YoY
- ▼ -59.43%
- Current HPI
- 277.598
- Rent YoY
- —
- Metro
- —
- State GDP YoY
- ▲ 3.95%
- F500 in state
- 110
Industry mix (Fortune 500 HQ in TX)
| Industry | F500 HQs | Revenue |
|---|---|---|
| Energy | 16 | $1,198B |
|
||
| Technology | 5 | $198B |
|
||
| Engineering / Construction | 4 | $72B |
|
||
| Energy Services | 3 | $60B |
|
||
| Utilities | 3 | $41B |
|
||
| Healthcare | 2 | $330B |
|
||
Price history
-9.5% since first listed12 events — show timeline
- 2026-04-28 Pending — NTREIS
- 2026-03-24 Relisted — NTREIS
- 2026-03-23 Pending — NTREIS
- 2026-03-11 Contingent — NTREIS
- 2026-03-06 Price Changed $239,900 NTREIS
- 2026-02-19 Listed $245,000 NTREIS
- 2026-02-13 Sold (Public Records) — Public Records
- 2026-02-13 Sold (Public Records) — Public Records
- 2022-08-08 Sold (Public Records) — Public Records
- 2022-08-05 Sold (MLS) — NTREIS
- 2022-07-10 Contingent — NTREIS
- 2022-06-29 Listed $265,000 NTREIS
Property tax history
+5.4%/yrLatest (2025): $6,763 · +0.1% YoY. Source: county tax records.
Cash-flow waterfall
monthlySold comps — $/sqft
last 12 mo · ≤1 miLoading sold comps…