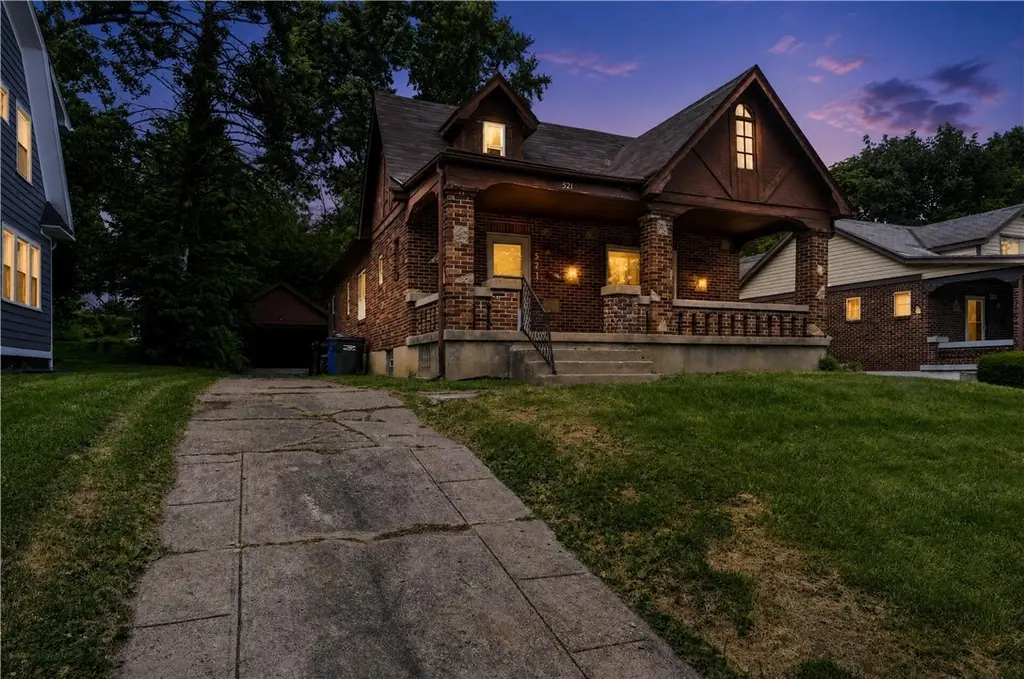
521 W Parkwood Dr · Dayton, OH
Flood risk 6/10 · Moderate
- FEMA flood zone
- X (unshaded)
- Chance of flooding over 30 yrs
- 0.68%
- Est. flood insurance / yr
- $473 – $860
Fire risk 1/10 · Minimal
- Est. fire insurance / yr
- $713 – $1,323
Heat risk 3/10 · Minor
- Hot days now (above 104°F)
- 7 days/yr
- Hot days in 30 yrs
- 18 days/yr
Wind risk 2/10 · Minimal
- Chance of severe wind over 30 yrs
- —
Air-quality risk 3/10 · Minor
- Unhealthy air days now
- 2 days/yr
- Unhealthy air days in 30 yrs
- 4 days/yr
Risk factors via First Street. Map © Google.
Why this score? — see what drove the C grade
The composite is a weighted blend of 9 inputs, each scored 0–100. Each bar is that input's sub-score; the figure is the points it added to the 100-point composite (weight × sub-score).
- Cash flow +23.0/30.0
- ARV discount +10.1/15.0
- DSCR +7.4/10.0
- 1% rule +5.3/10.0
- Rent growth +3.6/5.0
- Livability +3.2/5.0
- Condition / age +2.5/5.0
- Schools +1.3/10.0
- Appreciation +0.0/10.0
$99,900
🖨 Deal sheet (PDF) 📄 Offer letter ✓ Due diligence
Listing remarks MLS
Great rental property or starter home in Upper Riverdale! 3 bedrooms and two full baths with a full semi-finished basement! This home has so much more room than it looks! Most items updated last year before current tenant.
Key facts
- Sizable yard
- Outdoor entertaining
- 8,999 sq ft lot
Tags
Property features AI
Finance
- Financial info: Offered for sale
Exterior
- Parking: 2-car garage
- Utilities: Public water and sewer implied (utilities section present); Electric service available
- Home design: Single-family residence (multiple stories indicated by main and second level rooms)
- Construction: Brick, frame, and vinyl siding construction
- Exterior features: 50 x 180 lot; Residential zoning
Interior
- Kitchen: Kitchen on main level (11 x 17)
- Bedrooms: Main level bedroom (12 x 12); Second level bedroom (12 x 30); Additional bedroom-sized room (13 x 13) noted among rooms
- Bathrooms: 1 full bathroom (located on the main level)
- Heating & cooling: Central air conditioning; Forced air heating with natural gas
- Interior features: Full, partially finished basement; 6 total rooms
Neighborhood map
What this means for you Summary
Snapshot
- This is a 2-bed/1.0-bath single-family listed at $100k.
Deal economics
- At list price, monthly cash flow is $177 ($2k/yr) — positive.
- The deal already cash-flows at list — no discount required.
- Meets the 1% rule at list price ($1k rent vs $100k).
Location & tenants
- Location reads 65/100 on livability (#716 in OH) — a middle-class / working-renter tenant base. Strengths: cost of living A+, housing A+, health & safety A; Watch: amenities C-, crime F, commute F.
- Dayton City (urban): math 12% / reading 21% proficiency, ranked #641 of 656 in OH (top 98%) — low school quality limits family demand, transient renter base, plan for 1-2y turnover; 74% free/reduced lunch — lower-income household profile, screen leases tightly.
- Zoned schools: River'S Edge Montessori Elementary School (math 22% / reading 32%, grade F, #1,193 of 1,584 statewide, top 76%, 494 students, 0% FRL); Belmont High School (math 5% / reading 20%, grade F, #720 of 781 statewide, top 93%, 1,100 students, 0% FRL) — zoned schools average 0% FRL vs 74% district-wide (74 pts lower); this property's tenant base skews higher-income than the district average.
- Market conditions: Rents rising fast (+4.3%/yr); 137 active listings in the ZIP; 40 comparable units currently listed for rent nearby; rentals at typical pace (median 26d on market — plan ~3-4 weeks tenant-placement turnaround); 48% of comp listings sitting > 30 days — soft ceiling on asking rent; lower-income renter base — watch delinquency; 907 units permitted in Montgomery County in 2024 (416 in 5+ unit buildings).
Forward outlook
- Local home prices are declining (-3.0%/yr); year-one equity from $691 of loan paydown is wiped out by about $3k of value loss. Plan a longer hold.
- Montgomery County population projected at -10% by 2050 — secular population decline; favor cash flow + early exit over multi-decade hold.
Negotiation context
- Only 10 days on market — expect competitive offers; lowballing is unlikely to land.
- 2 sale attempts since 6y ago with the ask held roughly flat each time — persistent listings suggest the price (not the market) is what's stuck; bring a comps-based counter.
- Current owner paid $50k; list at $100k implies a 100% gain — meaningful room to come down on a strong offer.
Risks & watch-outs
- Watch-outs: built in 1919 — expect roof / HVAC / electrical / plumbing capex.
- Climate carrying-cost: major flood risk — expect insurance premiums to compound above CPI over the hold.
Questions for the listing agent
- Built in 1919 — when were the roof, HVAC, electrical panel, plumbing, and water heater last replaced?
- Is there a deadline driving the sale (1031 exchange, divorce, estate, relocation)? That informs how much negotiation room exists.
- Crime grade is F in this area — have there been break-ins, vandalism, or insurance claims at this property in the last 3 years? What carrier currently insures it and at what premium?
- What's the average days-on-market for RENTAL listings here right now (not sales)? A rising rental-DOM trend means longer vacancies and softer asking-rent achievability than the comps imply.
- What's the recent tenant-quality profile in this submarket — average credit score on applications, eviction rate, late-payment / NSF rate, and stable-employment percentage? A property-management company in the area should have these aggregated.
- How much new for-sale + rental construction is in the pipeline within 1–3 miles? Heavy new supply typically softens prices + rents 12–24 months out; constrained supply supports both.
Investment metrics
- 1% rule
- 1.03% ✓
- Cap rate
- 8.42%
- Cash-on-cash
- 7.59%
- DSCR
- 1.34
- GRM
- 8.1
CMA / ARV
- ARV (on-the-fly)
- $106,018
- Comps found
- 12
Show comp detail 12 sales within ~0.75 mi
| Address | Dist | Beds/Ba | Sqft | Sold | Price | $/sf | Match |
|---|---|---|---|---|---|---|---|
| 117 Valleyview Dr | 0.09mi | 2/1.0 | 1,381 (+3%) | 1mo | $50,000 | $36 | 90 |
| 2032 Rugby Rd | 0.24mi | 3/1.0 (+1) | 1,422 (+6%) | 0mo | $44,990 | $32 | 73 |
| 423 Sandalwood Dr | 0.30mi | 3/1.5 (+1) | 1,444 (+8%) | 1mo | $62,000 | $43 | 66 |
| 148 Valleyview Dr | 0.13mi | 3/1.0 (+1) | 1,163 (-13%) | 2mo | $125,000 | $107 | 66 |
| 69 E Beechwood Ave | 0.55mi | 3/1.0 (+1) | 1,400 (+4%) | 1mo | $173,000 | $124 | 61 |
| 50 Woodcrest Ave | 0.32mi | 3/1.0 (+1) | 1,500 (+12%) | 2mo | $155,000 | $103 | 59 |
| 121 E Hillcrest Ave | 0.62mi | 3/1.0 (+1) | 1,402 (+4%) | 1mo | $75,000 | $53 | 58 |
| 53 E Beechwood Ave | 0.52mi | 3/2.0 (+1) | 1,442 (+8%) | 2mo | $163,000 | $113 | 52 |
| 1034 Bertram Ave | 0.69mi | 3/3.0 (+1) | 1,326 (-1%) | 2mo | $178,000 | $134 | 52 |
| 128 E Parkwood Dr | 0.64mi | 3/1.0 (+1) | 1,228 (-8%) | 1mo | $29,810 | $24 | 50 |
| 2331 Newport Ave | 0.61mi | 3/1.5 (+1) | 1,520 (+13%) | 2mo | $85,000 | $56 | 41 |
| 212 E Hillcrest Ave | 0.74mi | 3/1.0 (+1) | 1,144 (-15%) | 2mo | $90,000 | $79 | 34 |
Match score weights: distance 35% · size 25% · config 20% · recency 20%. Top-matched comps best support the ARV.
Projected returns pro-forma
-3.0% appreciation · 4.34% rent growth · sell at horizon
- IRR
- -3.3%
- Equity multiple
- 0.87×
- Total profit
- $-3,529
- Equity at exit
- $14,895
- IRR
- 7.7%
- Equity multiple
- 1.62×
- Total profit
- $17,321
- Equity at exit
- $8,638
Cash invested: $27,972 (down + closing). Projections, not guarantees.
Landlord ↔ Tenant lean methodology
- Overall (STATE)
- 73 Landlord-Friendly
- State Ohio
- 73 Landlord-Friendly · R+6
- County
- — inherits STATE
- City
- — inherits STATE
ZIP-level market 45405
- Rents YoY
- 4.3%
- Active inventory
- 137
- Price-to-rent
- 8.1×
Monthly cashflow live
- Estimated rent
- $1,034 high interval (Pro) →
- Mortgage (P&I)
- −$524
- Tax from tax record
- −$74 /mo · $890/yr
- Insurance
- −$42
- HOA
- −$0
- Lot rent
- −$0
- Vacancy / Maint / Mgmt
- −$217
- Net cashflow
- $177
Break-even live
Sensitivity live
| Price | -10% $233 | -5% $205 | +0% $177 | +5% $149 | +10% $120 |
|---|---|---|---|---|---|
| Rent | -10% $95 | -5% $136 | +0% $177 | +5% $218 | +10% $258 |
| Rate | -1.0pp $227 | -0.5pp $202 | base $177 | +0.5pp $151 | +1.0pp $125 |
UW: 25.0% down · 7.5% · 30yr · 1.5% tax · 5.0% vac · 8.0% maint · 8.0% mgmt
Financing live
Cash to close
- Down payment
- $24,975
- Closing costs
- $2,997
- Reserves months
- —
- Total cash needed
- —
Loan-product check · same deal, 3 products live
Conventional
25% down · 7.5% · 30yr
- Down + closing
- —
- Monthly P&I
- —
- Monthly cashflow
- —
- DSCR
- —
- Eligible?
- —
Personal DTI + credit; lowest rate.
DSCR
20% down · 8.5% · 30yr
- Down + closing
- —
- Monthly P&I
- —
- Monthly cashflow
- —
- DSCR
- —
- Eligible?
- —
No personal income docs; deal must DSCR.
Hard money
10% down · 12.0% · 12mo
- Down + closing
- —
- Monthly P&I
- —
- Monthly cashflow
- —
- DSCR
- —
- Eligible?
- —
Short-term bridge; refi at stabilization.
Rent comps 40 comps
| Address | Beds | Baths | Sqft | Rent | $/sqft | DOM | Units | Dist |
|---|---|---|---|---|---|---|---|---|
| 439 W Fairview Ave Dayton, OH | 3.0 | 1.0 | 1500 | $1,200 | $0.80 | 46d | 1 | 0.10mi |
| 412 W Parkwood Dr Unit 1 Dayton, OH | 2.0 | 1.0 | 900 | $875 | $0.97 | 25d | 1 | 0.11mi |
| 2333 Rustic Rd Unit 4 Dayton, OH | 2.0 | 1.0 | 1000 | $840 | $0.84 | 5d | 1 | 0.18mi |
| 2333 Rustic Rd Dayton, OH | 2.0 | 1.0 | 1000 | $840 | $0.84 | 46d | 1 | 0.18mi |
| 628 W Norman Ave Unit 628 Dayton, OH | 2.0 | 1.0 | 918 | $795 | $0.87 | 46d | 1 | 0.25mi |
| 201 W Norman Ave Dayton, OH | 3.0 | 1.0 | 1424 | $1,200 | $0.84 | 46d | 1 | 0.31mi |
| 1004 W Fairview Ave Dayton, OH | 2.0 | 1.0 | 1053 | $950 | $0.90 | 25d | 1 | 0.33mi |
| 181 W Norman Ave Dayton, OH | 3.0 | 2.0 | 1228 | $1,150 | $0.94 | 46d | 1 | 0.33mi |
| 1008 W Fairview Ave Unit 2 Dayton, OH | 1.0 | 1.0 | 1007 | $800 | $0.79 | 5d | 1 | 0.34mi |
| 26 W Beechwood Ave Dayton, OH | 3.0 | 1.5 | 1468 | $1,050 | $0.72 | 46d | 1 | 0.39mi |
| 167 W Hudson Ave Dayton, OH | 3.0 | 1.5 | 1344 | $1,185 | $0.88 | 46d | 1 | 0.40mi |
| 2247 Salem Ave Unit 2249 Dayton, OH | 3.0 | 1.5 | 1300 | $1,400 | $1.08 | 46d | 1 | 0.44mi |
| 2247 Salem Ave Unit 2247 Dayton, OH | 3.0 | 1.5 | 1300 | $1,350 | $1.04 | 5d | 1 | 0.44mi |
| 2232 Salem Ave Dayton, OH | 3.0 | 1.0 | 1250 | $1,200 | $0.96 | 5d | 1 | 0.45mi |
| 1207 W Fairview Ave Dayton, OH | 2.0 | 1.0 | 1023 | $825 | $0.81 | 46d | 1 | 0.46mi |
| 1207 W Fairview Ave Dayton, OH | 2.0 | 1.0 | 1023 | $825 | $0.81 | 5d | 1 | 0.46mi |
| 101 W Norman Ave Unit 101 Dayton, OH | 3.0 | 1.0 | 1600 | $945 | $0.59 | 46d | 1 | 0.46mi |
| 41 W Fairview Ave Unit 2 Dayton, OH | 3.0 | 1.0 | 1452 | $1,200 | $0.83 | 16d | 1 | 0.50mi |
| 1743 Radcliffe Rd Dayton, OH | 3.0 | 1.5 | 1729 | $1,200 | $0.69 | 46d | 1 | 0.51mi |
| 2327 N Main St Unit 2 Dayton, OH | 2.0 | 1.0 | 900 | $1,200 | $1.33 | 25d | 1 | 0.54mi |
| 234 Santa Clara Ave Dayton, OH | 3.0 | 1.0 | 1368 | $1,125 | $0.82 | 46d | 1 | 0.56mi |
| 38 Pointview Ave Dayton, OH | 2.0 | 1.0 | 1140 | $900 | $0.79 | 16d | 1 | 0.56mi |
| 42 Pointview Ave Unit 42 Dayton, OH | 3.0 | 2.0 | 1240 | $1,200 | $0.97 | 5d | 1 | 0.56mi |
| 65 E Maplewood Ave Dayton, OH | 2.0 | 1.0 | 1064 | $723 | $0.68 | 46d | 1 | 0.58mi |
| 265 Victor Ave Dayton, OH | 3.0 | 1.0 | 1204 | $900 | $0.75 | 46d | 1 | 0.62mi |
| 1927 Burroughs Dr Dayton, OH | 3.0 | 2.0 | 1409 | $1,245 | $0.88 | 16d | 1 | 0.64mi |
| 147 Laura Ave Dayton, OH | 2.0 | 1.0 | 1096 | $975 | $0.89 | 25d | 1 | 0.65mi |
| 31 E Norman Ave Dayton, OH | 3.0 | 1.0 | 1100 | $1,150 | $1.05 | 25d | 1 | 0.67mi |
| 152 Laura Ave Dayton, OH | 2.0 | 1.0 | 990 | $895 | $0.90 | 46d | 1 | 0.67mi |
| 101 E Bruce Ave Dayton, OH | 3.0 | 1.0 | 1455 | $1,150 | $0.79 | 5d | 1 | 0.70mi |
| 1004 Linda Vista Ave Unit 1 Dayton, OH | 1.0 | 1.0 | 1200 | $750 | $0.62 | 16d | 1 | 0.73mi |
| 2141 Philadelphia Dr Dayton, OH | 3.0 | 1.0 | 1736 | $1,395 | $0.80 | 46d | 1 | 0.76mi |
| 518 Delaware Ave Dayton, OH | 2.0 | 1.0 | 1500 | $750 | $0.50 | 46d | 1 | 0.76mi |
| 115 E Norman Ave Unit 4 Dayton, OH | 1.0 | 1.0 | 1000 | $750 | $0.75 | 25d | 1 | 0.77mi |
| 220 Fernwood Ave Dayton, OH | 2.0 | 1.0 | 884 | $900 | $1.02 | 5d | 1 | 0.77mi |
| 202 E Bruce Ave Apt 2 Dayton, OH | 2.0 | 1.0 | 1250 | $800 | $0.64 | 25d | 1 | 0.77mi |
| 410 Delaware Ave Dayton, OH | 1.0 | 1.0 | 975 | $650 | $0.67 | 5d | 1 | 0.80mi |
| 317 Fernwood Ave Dayton, OH | 3.0 | 1.0 | 1320 | $1,100 | $0.83 | 13d | 1 | 0.86mi |
| 228 E Siebenthaler Ave Dayton, OH | 2.0 | 1.0 | 934 | $1,200 | $1.28 | 46d | 1 | 0.88mi |
| 1067 Salem Ave Dayton, OH | 2.0 | 1.0 | 1100 | $900 | $0.82 | 46d | 1 | 0.88mi |
Listing history 8 events
-
2026-06-23days on market $99,900 Active 10 DOM
-
2026-06-22days on market $99,900 Active 9 DOM
-
2026-06-18days on market $99,900 Active 6 DOM
-
2026-06-17days on market $99,900 Active 5 DOM
-
2026-06-16days on market $99,900 Active 4 DOM
-
2026-06-15days on market $99,900 Active 3 DOM
-
2026-06-13remarks 698-char remark
-
2026-06-13$99,900 Active 1 DOM
ⓘ Source: listings_history table (triggers on properties + properties_extension) + one-shot
backfill from property_details.listing_events for pre-trigger history.
Tax reassessment forecast OH · Partial reset (capped growth)
- Current annual tax
- $890 · $74/mo
- Projected year-2 tax
- $1,224 · $102/mo
- Expected delta
- +$334/yr (+$28/mo · 37.5%)
ⓘ Screening estimate from a state-policy table — verify with the county assessor before closing.
Climate risk First Street
- Flood 6/10 Major FEMA zone X (unshaded) · 68% chance over 30 yrs
- Wildfire 1/10 Low
- Heat 3/10 Moderate 7 d/yr ≥104°F today · 18 d/yr by 30 yrs out
- Wind 2/10 Low
- Air quality 3/10 Moderate 2 unhealthy d/yr today · 4 by 30 yrs out
Nearby sold comps map
Loading sold comps map…
Walkable amenities ~0.75 mi
Loading nearby amenities…
Taxation est. · year 1
- Rental income
- $12,403
- − Mortgage interest
- −$5,596
- − Property taxes
- −$890
- − Insurance
- −$500
- − Repairs & maintenance
- −$992
- − Management
- −$992
- − Depreciation
- −$2,906
- Taxable income
- $527
- Est. tax owed @ 24.0%
- −$126
- After-tax cash flow
- $1,996/yr
For passive investors: Depreciation is non-cash, so a rental often shows a tax loss while cash-flowing — sheltering income. Rental losses are passive: they offset passive income freely, and up to $25,000/yr can offset ordinary (W-2) income if you actively participate and your MAGI is under $100k (phasing out to $0 by $150k); unused losses carry forward. On sale, claimed depreciation is recaptured at up to 25%, and gains may owe capital-gains tax (a 1031 exchange can defer both). Figures are a year-1 estimate at your 24.0% rate — not tax advice; consult a CPA.
Schools (NCES district)
- District
- Dayton City
- NCES district ID
- 3904384
- Math proficiency
- 12% ▼ -12.00%
- Reading proficiency
- 21% ▼ -11.00%
- Median HH income
- $28,688
- Composite
- 12.94/100
- National rank
- #9579
- State rank
- #641 of 656 in OH
Livability — Dayton
- Score
- 65/100
- State rank
- #716
- US rank
- #12895
Category grades
Schools grade is shown separately in the Schools card above.
Census & demographics
- Census place
- Dayton, OH
- County
- Montgomery County · 459,541 people
- City population
- 164,387
- Metro
- Dayton-Kettering, OH
- Population (ZIP)
- 18,955
- Household income
- $43,973
- Rent vs Own
- Severe rent burden
- 1475.0
Population outlook (Montgomery County) Hauer SSP2
- Today (2025)
- 523,241 people
- By 2030
- 514,948 · -1.6%
- By 2040
- 493,378 · -5.7%
- By 2050
- 469,639 · -10.2%
- By 2075
- 418,360 · -20.0%
- By 2100
- 353,315 · -32.5%
Race, ethnicity, and origin ACS 2023
- Neighborhood character
- Predominantly Black (68%)
- Race & ethnicity
- Black 68% White 23% Two or more races 7% Hispanic / Latino 3%
- Common ancestry
- Italian 1% Slovak 1%
- Foreign-born
- 3% · Canada
- Languages at home
- 95% English-only · Spanish 2% French/Haitian/Cajun 1%
Political lean MEDSL · Montgomery
- 2024 margin
- Toss-up / Even · D 49.8% · R 49.3%
- 2008→2024 swing
- -5.8pp toward R · 2008: 6.2pp · 2024: 0.5pp
- All cycles
- 2024: D+0.5 2020: D+2.2 2016: R+1.2 2012: D+3.1 2008: D+6.2
Not yet ingested
- Civics
- —
Market trends
- HPI YoY
- ▼ -125.58%
- Current HPI
- 173.4962
- Rent YoY
- ▲ 4.34%
- Metro
- Dayton-Kettering, OH
- State GDP YoY
- ▲ 1.98%
- F500 in state
- 48
Industry mix (Fortune 500 HQ in OH)
| Industry | F500 HQs | Revenue |
|---|---|---|
| Insurance | 3 | $145B |
|
||
| Industrial Machinery | 3 | $49B |
|
||
| Financial Services | 3 | $24B |
|
||
| Consumer Goods | 2 | $93B |
|
||
| Aerospace / Defense | 2 | $47B |
|
||
| Utilities | 2 | $33B |
|
||
Price history
+112.6% since first listed9 events — show timeline
- 2026-06-12 Listed $99,900 Dayton MLS
- 2020-09-25 Sold (Public Records) $50,000 Public Records
- 2020-09-07 Sold (MLS) $50,000 Dayton MLS
- 2020-09-07 Sold (MLS) $50,000 Dayton MLS
- 2020-07-24 Pending — Dayton MLS
- 2020-07-21 Listed $65,000 Dayton MLS
- 2019-07-18 Sold (Public Records) $170,000 Public Records
- 1992-07-16 Sold (Public Records) $49,000 Public Records
- 1989-10-24 Sold (Public Records) $47,000 Public Records
Property tax history
-5.0%/yrLatest (2025): $890 · -0.2% YoY. Source: county tax records.
Cash-flow waterfall
monthlySold comps — $/sqft
last 12 mo · ≤1 miLoading sold comps…