2003 Bayview Heights Dr #181 · San Diego, CA
Flood risk 1/10 · Minimal
- FEMA flood zone
- X (unshaded)
- Chance of flooding over 30 yrs
- 0.0%
- Est. flood insurance / yr
- $507 – $1,088
Fire risk 1/10 · Minimal
- Est. fire insurance / yr
- $659 – $1,223
Heat risk 4/10 · Minor
- Hot days now (above 89°F)
- 5 days/yr
- Hot days in 30 yrs
- 14 days/yr
Wind risk 1/10 · Minimal
- Chance of severe wind over 30 yrs
- —
Air-quality risk 3/10 · Minor
- Unhealthy air days now
- 2 days/yr
- Unhealthy air days in 30 yrs
- 2 days/yr
Risk factors via First Street. Map © Google.
Why this score? — see what drove the B grade
The composite is a weighted blend of 9 inputs, each scored 0–100. Each bar is that input's sub-score; the figure is the points it added to the 100-point composite (weight × sub-score).
- Cash flow +30.0/30.0
- ARV discount +14.8/15.0
- DSCR +10.0/10.0
- 1% rule +8.5/10.0
- Livability +3.8/5.0
- Rent growth +3.2/5.0
- Condition / age +2.5/5.0
- Schools +2.2/10.0
- Appreciation +0.0/10.0
$250,000
🖨 Deal sheet (PDF) 📄 Offer letter ✓ Due diligence
Listing remarks MLS
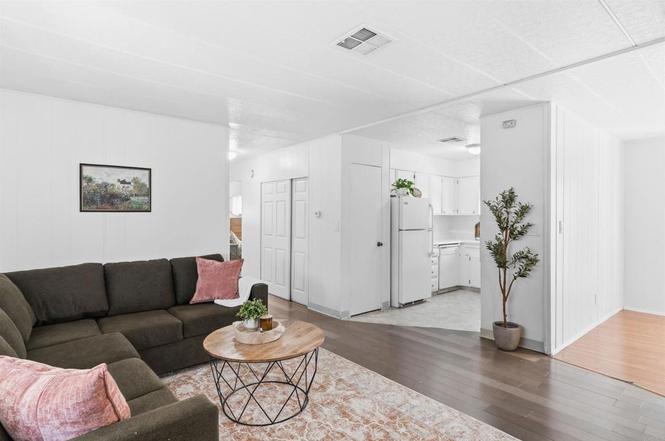
Quiet & Well Maintained Family Park. Lots of amenities including a beautiful big club house, sparkling swimming pool & spa, laundry, library, billiards, park area w/ picnic tables & more. The mobile home has it's own laundry closet, room for full size washer & dryer. New paint & carpet throughout. Spacious floor plan has 2 large rooms which could easily be made into 2 additional bedrooms making it 4 bedrooms. This open floor plan has a wide hall and would also help with a handicap conversion. Neighborhoods: East San Diego Complex Features: , ,, ,, Equipment: Range/Oven, Shed(s) Other Fees: 0 Sewer: Sewer Connected Topography: LL
Key facts
- Relaxing spa
- Clubhouse
- 42.88 acre lot
Tags
Property features AI
Finance
- Other: Lot described as 0-1 unit/acre; Living area and lot size sourced from assessor
- Financial info: Land lease amount: $1,250 (buyer to verify)
- HOA & community: Community pool and spa; Park within the community; Manager approval required for park residency; Pets allowed with size limits, breed restrictions; dogs and cats permitted; Located in a land-lease community (Bayview Heights)
Exterior
- Parking: 2 total parking spaces; 2 carport spaces
- Utilities: Public sewer
- Home design: Single-story; Multi/split level floor plan; Mobile home remains on site
- Construction: 56 by 12 mobile home; Year built per assessor
- Exterior features: Community pool; Park and sidewalks nearby; Curbs
Interior
- Bedrooms: All bedrooms located on the main level
- Bathrooms: 2 full bathrooms
- Heating & cooling: Central cooling
- Interior features: Side entry; Multi/split levels; All bedrooms on the main level; Has central cooling; Has view
- Laundry & utility: On-site laundry; Electric dryer hookup; Gas and electric dryer hookup
Neighborhood map
What this means for you Summary
Snapshot
- This is a 4-bed/2.0-bath manufactured listed at $250k.
Deal economics
- At list price, monthly cash flow is $943 ($11k/yr) — positive.
- The deal already cash-flows at list — no discount required.
- Meets the 1% rule at list price ($3k rent vs $250k).
- Cap rate 10.8% vs local median 2.0% in San Diego — top-decile yield for the area; either an underpriced asset or a hidden risk that comps aren't pricing in. Stress-test before assuming the spread holds.
Location & tenants
- Location reads 75/100 on livability (#123 in CA, #4,206 nationally) — a middle-class / working-renter tenant base. Strengths: amenities A+, commute A+, employment A+; Watch: health & safety C-, crime D+, cost of living F.
- San Diego Unified (urban): math 19% / reading 29% proficiency, ranked #393 of 517 in CA (top 76%) — low school quality limits family demand, transient renter base, plan for 1-2y turnover.
- Zoned schools: Oak Park Elementary (509 students, 82% FRL); Mann Middle (715 students, 94% FRL); Lincoln High (1,407 students, 76% FRL) — zoned schools average 84% FRL vs 52% district-wide (32 pts higher); higher-poverty schools than district average — tighter screening recommended.
- Market conditions: Rents rising (+2.6%/yr); 123 active listings in the ZIP; 25 comparable units currently listed for rent nearby; rentals at typical pace (median 26d on market — plan ~3-4 weeks tenant-placement turnaround); 11,759 units permitted in San Diego County in 2024 (7,244 in 5+ unit buildings).
- At $3,381/mo this rent would consume 59% of the median local household income ($69k/yr) (locally 4800% of renters already pay >50% of income on rent) — very limited rent-growth headroom before tenants either downsize or default.
Forward outlook
- Local home prices are declining (-3.0%/yr); year-one equity from $2k of loan paydown is wiped out by about $8k of value loss. Plan a longer hold.
- San Diego County population projected at +20% by 2050 — long-run rental-demand tailwind backs the buy-and-hold thesis.
- At projected returns (-3.0% appreciation + 2.6% rent growth), your $70k cash investment doubles in ~8 years — after that, you're playing with house money.
Negotiation context
- Only 4 days on market — expect competitive offers; lowballing is unlikely to land.
- 3 sale attempts since 12y ago with the ask held roughly flat each time — persistent listings suggest the price (not the market) is what's stuck; bring a comps-based counter.
- Current owner paid $47k; list at $250k implies a 432% gain — meaningful room to come down on a strong offer.
Questions for the listing agent
- Built in 1970 — when were the roof, HVAC, electrical panel, plumbing, and water heater last replaced?
- Is there a deadline driving the sale (1031 exchange, divorce, estate, relocation)? That informs how much negotiation room exists.
- Schools are B-rated — typically a magnet for longer-tenancy family renters. What's the average tenant stay here, and is there a school-zone premium baked into asking?
- Crime grade is D in this area — have there been break-ins, vandalism, or insurance claims at this property in the last 3 years? What carrier currently insures it and at what premium?
- What's the average days-on-market for RENTAL listings here right now (not sales)? A rising rental-DOM trend means longer vacancies and softer asking-rent achievability than the comps imply.
- What's the recent tenant-quality profile in this submarket — average credit score on applications, eviction rate, late-payment / NSF rate, and stable-employment percentage? A property-management company in the area should have these aggregated.
- How much new for-sale + rental construction is in the pipeline within 1–3 miles? Heavy new supply typically softens prices + rents 12–24 months out; constrained supply supports both.
Investment metrics
- 1% rule
- 1.35% ✓
- Cap rate
- 10.82%
- Cash-on-cash
- 16.16%
- DSCR
- 1.72
- GRM
- 6.2
CMA / ARV
- ARV (on-the-fly)
- $298,368
- Comps found
- 7
Show comp detail 7 sales within ~0.75 mi
| Address | Dist | Beds/Ba | Sqft | Sold | Price | $/sf | Match |
|---|---|---|---|---|---|---|---|
| 2003 Bayview Hts Dr #158 | 0.00mi | 3/2.0 (-1) | 1,344 (0%) | 3mo | $257,900 | $192 | 92 |
| 2003 Bayview Heights Dr #102 | 0.00mi | 3/2.0 (-1) | 1,368 (+2%) | 2mo | $259,900 | $190 | 90 |
| 2003 Bayview Heights Dr #108 | 0.00mi | 3/2.0 (-1) | 1,353 (+1%) | 9mo | $379,500 | $280 | 86 |
| 2003 Bayview Heights Dr #18 | 0.14mi | 3/2.0 (-1) | 1,296 (-4%) | 6mo | $288,000 | $222 | 77 |
| 2003 Bayview Heights Dr #73 | 0.11mi | 3/2.0 (-1) | 1,344 (0%) | 18mo | $249,000 | $185 | 75 |
| 2003 Bayview Hts Dr #71 | 0.37mi | 4/2.0 | 1,344 (0%) | 12mo | $307,700 | $229 | 73 |
| 2003 Bayview Heights Dr Spc 210 | 0.14mi | 3/2.0 (-1) | 1,152 (-14%) | 9mo | $325,000 | $282 | 57 |
Match score weights: distance 35% · size 25% · config 20% · recency 20%. Top-matched comps best support the ARV.
Projected returns pro-forma
-3.0% appreciation · 2.65% rent growth · sell at horizon
- IRR
- 6.8%
- Equity multiple
- 1.26×
- Total profit
- $18,411
- Equity at exit
- $37,276
- IRR
- 15.8%
- Equity multiple
- 2.27×
- Total profit
- $88,738
- Equity at exit
- $21,615
Cash invested: $70,000 (down + closing). Projections, not guarantees.
Landlord ↔ Tenant lean methodology
- Overall (STATE)
- 18 Strongly Tenant-Friendly
- State California
- 18 Strongly Tenant-Friendly · D+13
- County
- — inherits STATE
- City
- — inherits STATE
ZIP-level market 92105
- Rents YoY
- 2.6%
- Active inventory
- 123
- Price-to-rent
- 6.2×
Monthly cashflow live
- Estimated rent
- $3,381 high interval (Pro) →
- Mortgage (P&I)
- −$1,311
- Tax est. 1.5%
- −$312 /mo · $3,750/yr
- Insurance
- −$104
- HOA
- −$0
- Vacancy / Maint / Mgmt
- −$710
- Net cashflow
- $943
Break-even live
Sensitivity live
| Price | -10% $1,116 | -5% $1,029 | +0% $943 | +5% $857 | +10% $770 |
|---|---|---|---|---|---|
| Rent | -10% $676 | -5% $809 | +0% $943 | +5% $1,076 | +10% $1,210 |
| Rate | -1.0pp $1,069 | -0.5pp $1,007 | base $943 | +0.5pp $878 | +1.0pp $812 |
UW: 25.0% down · 7.5% · 30yr · 1.5% tax · 5.0% vac · 8.0% maint · 8.0% mgmt
Financing live
Cash to close
- Down payment
- $62,500
- Closing costs
- $7,500
- Reserves months
- —
- Total cash needed
- —
Loan-product check · same deal, 3 products live
Conventional
25% down · 7.5% · 30yr
- Down + closing
- —
- Monthly P&I
- —
- Monthly cashflow
- —
- DSCR
- —
- Eligible?
- —
Personal DTI + credit; lowest rate.
DSCR
20% down · 8.5% · 30yr
- Down + closing
- —
- Monthly P&I
- —
- Monthly cashflow
- —
- DSCR
- —
- Eligible?
- —
No personal income docs; deal must DSCR.
Hard money
10% down · 12.0% · 12mo
- Down + closing
- —
- Monthly P&I
- —
- Monthly cashflow
- —
- DSCR
- —
- Eligible?
- —
Short-term bridge; refi at stabilization.
Rent comps 25 comps
| Address | Beds | Baths | Sqft | Rent | $/sqft | DOM | Units | Dist |
|---|---|---|---|---|---|---|---|---|
| 2655 55th St San Diego, CA | 3.0 | 2.0 | 1592 | $4,095 | $2.57 | 9d | 1 | 0.41mi |
| 5304 Nutmeg St San Diego, CA | 3.0 | 2.0 | 1346 | $3,900 | $2.90 | 26d | 1 | 0.57mi |
| 2987 54th St Unit 2987 San Diego, CA | 3.0 | 2.0 | 900 | $2,850 | $3.17 | 9d | 1 | 0.64mi |
| 4935 Deaton Dr San Diego, CA | 4.0 | 2.0 | 1641 | $4,250 | $2.59 | 26d | 1 | 0.82mi |
| 2540 Perkon Ct San Diego, CA | 4.0 | 2.0 | 1850 | $4,000 | $2.16 | 26d | 1 | 0.91mi |
| 6410 College Grove Dr San Diego, CA | 3.0 | 2.0 | 1150 | $3,400 | $2.96 | 3d | 3 | 1.02mi |
| 851 Euclid Ave San Diego, CA | 3.0 | 2.0 | 1120 | $3,695 | $3.30 | 4d | 1 | 1.10mi |
| 6333 College Grove Way San Diego, CA | 2.0–3.0 | 1.5–2.0 | 1024 | $3,500 | $3.42 | 0d | 3 | 1.18mi |
| 5920 Streamview Dr Apt 4 San Diego, CA | 3.0 | 1.0 | 999 | $2,500 | $2.50 | 9d | 1 | 1.22mi |
| 5920 Streamview Dr Apt 1 San Diego, CA | 3.0 | 1.0 | 989 | $2,800 | $2.83 | 26d | 1 | 1.22mi |
| 3211 Euclid Ave Unit d San Diego, CA | 3.0 | 1.0 | 950 | $2,468 | $2.60 | 26d | 1 | 1.26mi |
| 3344 Isla Vista Dr Unit Z3344 San Diego, CA | 3.0 | 2.0 | 1600 | $3,300 | $2.06 | 26d | 1 | 1.30mi |
| 1148 Cotton St San Diego, CA | 3.0 | 2.0 | 1000 | $2,995 | $3.00 | 26d | 1 | 1.36mi |
| 1152 Cotton St Unit 1150 San Diego, CA | 3.0 | 2.0 | 1000 | $2,995 | $3.00 | 25d | 1 | 1.36mi |
| 6203 Romo St Unit 1 San Diego, CA | 3.0 | 2.0 | 1750 | $4,600 | $2.63 | 16d | 1 | 1.37mi |
| 5506 1/2 University Ave San Diego, CA | 3.0 | 1.0 | 896 | $2,790 | $3.11 | 26d | 1 | 1.39mi |
| 5280 Groveland Dr San Diego, CA | 3.0 | 1.5 | 900 | $3,500 | $3.89 | 26d | 1 | 1.43mi |
| 5280 Groveland Dr Unit 4 San Diego, CA | 3.0 | 1.5 | 900 | $3,500 | $3.89 | 23d | 1 | 1.43mi |
| 5256 Groveland Dr Unit 5260-1 San Diego, CA | 3.0 | 2.0 | 1200 | $3,095 | $2.58 | 26d | 1 | 1.43mi |
| 5256 Groveland Dr Unit 5258 House San Diego, CA | 3.0 | 2.0 | 1108 | $3,100 | $2.80 | 26d | 1 | 1.43mi |
| 3930 60th St San Diego, CA | 3.0 | 2.5 | 1300 | $2,795 | $2.15 | 16d | 1 | 1.45mi |
| 5415 Imperial Ave Unit 4 San Diego, CA | 3.0 | 1.0 | 895 | $2,550 | $2.85 | 4d | 1 | 1.46mi |
| 3744 Gayle St San Diego, CA | 3.0 | 2.0 | 1248 | $3,995 | $3.20 | 18d | 1 | 1.47mi |
| 5316 Imperial Ave San Diego, CA | 3.0 | 2.0 | 1000 | $2,950 | $2.95 | 0d | 1 | 1.48mi |
| 3972 60th St #134 San Diego, CA | 3.0 | 2.5 | 1147 | $2,975 | $2.59 | 26d | 1 | 1.48mi |
Listing history 3 events
-
2026-06-21days on market $250,000 Active 4 DOM
-
2026-06-18remarks 699-char remark
-
2026-06-18$250,000 Active 1 DOM
ⓘ Source: listings_history table (triggers on properties + properties_extension) + one-shot
backfill from property_details.listing_events for pre-trigger history.
Climate risk First Street
- Flood 1/10 Low FEMA zone X (unshaded) · 0% chance over 30 yrs
- Wildfire 1/10 Low
- Heat 4/10 Moderate 5 d/yr ≥89°F today · 14 d/yr by 30 yrs out
- Wind 1/10 Low
- Air quality 3/10 Moderate 2 unhealthy d/yr today · 2 by 30 yrs out
Nearby sold comps map
Loading sold comps map…
Walkable amenities ~0.75 mi
Loading nearby amenities…
Taxation est. · year 1
- Rental income
- $40,567
- − Mortgage interest
- −$14,004
- − Property taxes
- −$3,750
- − Insurance
- −$1,250
- − Repairs & maintenance
- −$3,245
- − Management
- −$3,245
- − Depreciation
- −$7,273
- Taxable income
- $7,799
- Est. tax owed @ 24.0%
- −$1,872
- After-tax cash flow
- $9,444/yr
For passive investors: Depreciation is non-cash, so a rental often shows a tax loss while cash-flowing — sheltering income. Rental losses are passive: they offset passive income freely, and up to $25,000/yr can offset ordinary (W-2) income if you actively participate and your MAGI is under $100k (phasing out to $0 by $150k); unused losses carry forward. On sale, claimed depreciation is recaptured at up to 25%, and gains may owe capital-gains tax (a 1031 exchange can defer both). Figures are a year-1 estimate at your 24.0% rate — not tax advice; consult a CPA.
Schools (NCES district)
- District
- San Diego Unified
- NCES district ID
- 0634320
- Math proficiency
- 19% ▼ -29.00%
- Reading proficiency
- 29% ▼ -28.00%
- Median HH income
- $61,673
- Composite
- 22.31/100
- National rank
- #8135
- State rank
- #393 of 517 in CA
Livability — San Diego
- Score
- 75/100
- State rank
- #123
- US rank
- #4206
Category grades
Schools grade is shown separately in the Schools card above.
Census & demographics
- Census place
- San Diego, CA
- County
- San Diego County · 3,178,799 people
- City population
- 1,397,612
- Metro
- San Diego-Chula Vista-Carlsbad, CA
- Population (ZIP)
- 71,411
- Household income
- $68,563
- Rent vs Own
- Severe rent burden
- 4800.0
Population outlook (San Diego County) Hauer SSP2
- Today (2025)
- 3,678,185 people
- By 2030
- 3,856,546 · +4.8%
- By 2040
- 4,171,407 · +13.4%
- By 2050
- 4,421,607 · +20.2%
- By 2075
- 4,831,599 · +31.4%
- By 2100
- 4,832,502 · +31.4%
Race, ethnicity, and origin ACS 2023
- Neighborhood character
- Diverse neighborhood (Simpson 0.69)
- Race & ethnicity
- Hispanic / Latino 49% Two or more races 23% Asian 18% White 15% Black 13% Native American 2%
- Hispanic origin (detail)
- Mexican 45%
- Common ancestry
- Ukrainian 1% Romanian 1% Lithuanian 1%
- Foreign-born
- 36% · Canada, Vietnam, China
- Languages at home
- 38% English-only · Spanish 39% Vietnamese 9% Other Asian/Pacific 5%
Political lean MEDSL · San Diego
- 2024 margin
- D (+16.8) · D 56.9% · R 40.1% · Other 2.9%
- 2008→2024 swing
- +6.6pp toward D · 2008: 10.2pp · 2024: 16.8pp
- All cycles
- 2024: D+16.8 2020: D+22.8 2016: D+17.8 2012: D+5.1 2008: D+10.2
Not yet ingested
- Civics
- —
Market trends
- HPI YoY
- ▼ -679.97%
- Current HPI
- 483.3536
- Rent YoY
- ▲ 2.65%
- Metro
- San Diego-Chula Vista-Carlsbad, CA
- State GDP YoY
- ▲ 3.21%
- F500 in state
- 116
Industry mix (Fortune 500 HQ in CA)
| Industry | F500 HQs | Revenue |
|---|---|---|
| Technology | 27 | $1,492B |
|
||
| Financial Services | 3 | $174B |
|
||
| Retail | 3 | $44B |
|
||
| Insurance | 3 | $26B |
|
||
| Media / Entertainment | 2 | $115B |
|
||
| Pharmaceuticals / Biotech | 2 | $62B |
|
||
Price history
+410.2% since first listed6 events — show timeline
- 2026-06-17 Listed $250,000 CRMLS
- 2014-09-02 Sold (MLS) $47,000 CRMLS
- 2014-09-02 Sold (MLS) $47,000 SDMLS
- 2014-08-14 Pending — SDMLS
- 2014-07-26 Listed $49,000 SDMLS
- 2014-07-26 Listed $49,000 CRMLS
Cash-flow waterfall
monthlySold comps — $/sqft
last 12 mo · ≤1 miLoading sold comps…