2837 S Walcott St · Indianapolis city (balance), IN
Flood risk 1/10 · Minimal
- FEMA flood zone
- X (unshaded)
- Chance of flooding over 30 yrs
- 0.0%
- Est. flood insurance / yr
- $507 – $1,088
Fire risk 1/10 · Minimal
- Est. fire insurance / yr
- $717 – $1,331
Heat risk 4/10 · Minor
- Hot days now (above 101°F)
- 7 days/yr
- Hot days in 30 yrs
- 19 days/yr
Wind risk 2/10 · Minimal
- Chance of severe wind over 30 yrs
- 0.0%
Air-quality risk 3/10 · Minor
- Unhealthy air days now
- 2 days/yr
- Unhealthy air days in 30 yrs
- 3 days/yr
Risk factors via First Street. Map © Google.
Why this score? — see what drove the B grade
The composite is a weighted blend of 9 inputs, each scored 0–100. Each bar is that input's sub-score; the figure is the points it added to the 100-point composite (weight × sub-score).
- Cash flow +29.1/30.0
- ARV discount +15.0/15.0
- DSCR +10.0/10.0
- 1% rule +7.5/10.0
- Rent growth +3.2/5.0
- Livability +2.5/5.0
- Condition / age +2.5/5.0
- Schools +1.4/10.0
- Appreciation +0.0/10.0
$115,000
🖨 Deal sheet (PDF) 📄 Offer letter ✓ Due diligence
Listing remarks
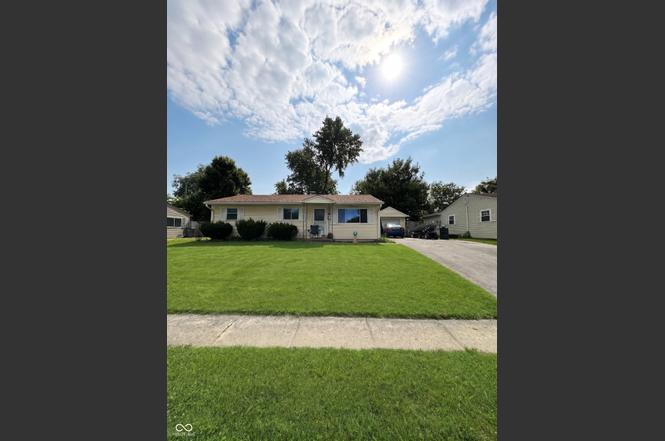
Don't miss this 4-bedroom, 1-bath home located on Indianapolis' south side, offering a flexible floor plan and plenty of possibilities for renovation and value-add improvements. This property is ready for rehab and would make an excellent fix-and-flip, rental investment, or owner-occupant project. The spacious layout provides multiple options for reconfiguring the home, including the potential to easily add a primary suite and additional bathroom. The furnace is less than 5 years old, helping reduce some of the major update costs. With solid bones and a floor plan that allows for creativity, this property is the perfect opportunity for investors looking to build equity and maximize returns.
Key facts
- Solid bones
- 5,968 sq ft lot
- Garage
Tags
Property features AI
Finance
- Other: Property is residential single-family; Lot approximately 0.14 acre (< 1/4 acre)
Exterior
- Parking: Detached garage (1 car, approximately 288 sq ft)
- Utilities: Public water; Municipal sewer connected; Solid waste service available
- Home design: Single-family residence; One story
- Construction: Vinyl siding; Slab foundation
- Exterior features: Patio; Porch; Full privacy fence; Sidewalks; Mature trees
Interior
- Kitchen: Electric oven; Refrigerator
- Bedrooms: Four bedrooms on the main level (sizes include 13x12, 9x12, 9x9, 13x9)
- Bathrooms: One full bathroom (main level)
- Heating & cooling: Electric forced-air heating; No central cooling
- Interior features: Attic access; Woodwork stained/painted; Smoke detector(s)
Neighborhood map
What this means for you Summary
Snapshot
- This is a 3-bed/1.0-bath single-family listed at $115k.
Deal economics
- At list price, monthly cash flow is $398 ($5k/yr) — positive.
- The deal already cash-flows at list — no discount required.
- Meets the 1% rule at list price ($1k rent vs $115k).
- Cap rate 10.4% vs local median 4.4% in Indianapolis city (balance) — top-decile yield for the area; either an underpriced asset or a hidden risk that comps aren't pricing in. Stress-test before assuming the spread holds.
Location & tenants
- Location reads: area grade B — affects rentability + tenant quality, not the cash-flow math above.
- Indianapolis Public Schools (urban): math 14% / reading 20% proficiency, ranked #286 of 301 in IN (top 95%) — low school quality limits family demand, transient renter base, plan for 1-2y turnover; 77% free/reduced lunch — lower-income household profile, screen leases tightly.
- Zoned schools: Frederick Douglass School 19 (math 9% / reading 13%, grade F, #909 of 994 statewide, top 92%, 444 students, 81% FRL); H L Harshman Middle School (math 3% / reading 16%, grade F, #316 of 330 statewide, top 96%, 549 students, 84% FRL).
- Market conditions: Rents rising (+2.9%/yr); 500 active listings in the ZIP; 40 comparable units currently listed for rent nearby; rentals at typical pace (median 20d on market — plan ~3-4 weeks tenant-placement turnaround); 1,906 units permitted in Marion County in 2024 (621 in 5+ unit buildings).
Forward outlook
- Local home prices are declining (-3.0%/yr); year-one equity from $795 of loan paydown is wiped out by about $3k of value loss. Plan a longer hold.
- Marion County population projected at +18% by 2050 — long-run rental-demand tailwind backs the buy-and-hold thesis.
- At projected returns (-3.0% appreciation + 2.9% rent growth), your $32k cash investment doubles in ~9 years — after that, you're playing with house money.
Negotiation context
- Only 2 days on market — expect competitive offers; lowballing is unlikely to land.
Questions for the listing agent
- Built in 1960 — when were the roof, HVAC, electrical panel, plumbing, and water heater last replaced?
- Is there a deadline driving the sale (1031 exchange, divorce, estate, relocation)? That informs how much negotiation room exists.
- What's the average days-on-market for RENTAL listings here right now (not sales)? A rising rental-DOM trend means longer vacancies and softer asking-rent achievability than the comps imply.
- What's the recent tenant-quality profile in this submarket — average credit score on applications, eviction rate, late-payment / NSF rate, and stable-employment percentage? A property-management company in the area should have these aggregated.
- How much new for-sale + rental construction is in the pipeline within 1–3 miles? Heavy new supply typically softens prices + rents 12–24 months out; constrained supply supports both.
Investment metrics
- 1% rule
- 1.25% ✓
- Cap rate
- 10.44%
- Cash-on-cash
- 14.83%
- DSCR
- 1.66
- GRM
- 6.7
CMA / ARV
- ARV (on-the-fly)
- $186,776
- Comps found
- 12
Show comp detail 12 sales within ~0.75 mi
| Address | Dist | Beds/Ba | Sqft | Sold | Price | $/sf | Match |
|---|---|---|---|---|---|---|---|
| 2845 Tindall St | 0.11mi | 3/1.0 | 1,200 (-5%) | 3mo | $180,000 | $150 | 84 |
| 2916 Dietz St | 0.12mi | 3/1.0 | 1,200 (-5%) | 4mo | $160,000 | $133 | 83 |
| 2905 Dietz St | 0.08mi | 3/1.0 | 1,144 (-9%) | 4mo | $150,000 | $131 | 77 |
| 1902 Knox St | 0.23mi | 3/1.5 | 1,176 (-7%) | 2mo | $148,500 | $126 | 74 |
| 1639 Comer Ave | 0.42mi | 3/2.0 | 1,327 (+5%) | 1mo | $100,000 | $75 | 67 |
| 3029 Villa Ave | 0.43mi | 3/2.0 | 1,198 (-5%) | 4mo | $195,000 | $163 | 64 |
| 1802 Martin St | 0.38mi | 3/1.0 | 1,407 (+12%) | 2mo | $136,000 | $97 | 62 |
| 1152 Knox St | 0.60mi | 2/1.0 (-1) | 1,200 (-5%) | 2mo | $197,000 | $164 | 57 |
| 3011 E Berwyn St | 0.75mi | 3/1.0 | 1,195 (-5%) | 0mo | $150,000 | $126 | 56 |
| 3027 Alice Ave | 0.63mi | 3/1.0 | 1,151 (-9%) | 2mo | $170,000 | $148 | 55 |
| 2415 Finley Ave | 0.62mi | 3/1.0 | 1,148 (-9%) | 3mo | $178,500 | $155 | 53 |
| 1426 E Bradbury Ave | 0.73mi | 3/2.0 | 1,320 (+5%) | 1mo | $208,000 | $158 | 53 |
Match score weights: distance 35% · size 25% · config 20% · recency 20%. Top-matched comps best support the ARV.
Projected returns pro-forma
-3.0% appreciation · 2.88% rent growth · sell at horizon
- IRR
- 5.2%
- Equity multiple
- 1.20×
- Total profit
- $6,514
- Equity at exit
- $17,147
- IRR
- 14.5%
- Equity multiple
- 2.17×
- Total profit
- $37,526
- Equity at exit
- $9,943
Cash invested: $32,200 (down + closing). Projections, not guarantees.
Landlord ↔ Tenant lean methodology
- Overall (STATE)
- 90 Strongly Landlord-Friendly
- State Indiana
- 90 Strongly Landlord-Friendly · R+11
- County
- — inherits STATE
- City
- — inherits STATE
ZIP-level market 46203
- Home prices YoY
- -26.7%
- Rents YoY
- 2.9%
- Active inventory
- 500
- Price-to-rent
- 6.7×
Monthly cashflow live
- Estimated rent
- $1,432 high interval (Pro) →
- Mortgage (P&I)
- −$603
- Tax from tax record
- −$82 /mo · $988/yr
- Insurance
- −$48
- HOA
- −$0
- Vacancy / Maint / Mgmt
- −$301
- Net cashflow
- $398
Break-even live
Sensitivity live
| Price | -10% $463 | -5% $430 | +0% $398 | +5% $365 | +10% $333 |
|---|---|---|---|---|---|
| Rent | -10% $285 | -5% $341 | +0% $398 | +5% $454 | +10% $511 |
| Rate | -1.0pp $456 | -0.5pp $427 | base $398 | +0.5pp $368 | +1.0pp $338 |
UW: 25.0% down · 7.5% · 30yr · 1.5% tax · 5.0% vac · 8.0% maint · 8.0% mgmt
Financing live
Cash to close
- Down payment
- $28,750
- Closing costs
- $3,450
- Reserves months
- —
- Total cash needed
- —
Loan-product check · same deal, 3 products live
Conventional
25% down · 7.5% · 30yr
- Down + closing
- —
- Monthly P&I
- —
- Monthly cashflow
- —
- DSCR
- —
- Eligible?
- —
Personal DTI + credit; lowest rate.
DSCR
20% down · 8.5% · 30yr
- Down + closing
- —
- Monthly P&I
- —
- Monthly cashflow
- —
- DSCR
- —
- Eligible?
- —
No personal income docs; deal must DSCR.
Hard money
10% down · 12.0% · 12mo
- Down + closing
- —
- Monthly P&I
- —
- Monthly cashflow
- —
- DSCR
- —
- Eligible?
- —
Short-term bridge; refi at stabilization.
Rent comps 40 comps
| Address | Beds | Baths | Sqft | Rent | $/sqft | DOM | Units | Dist |
|---|---|---|---|---|---|---|---|---|
| 2806 Dietz St Indianapolis, IN | 4.0 | 1.5 | 1200 | $1,345 | $1.12 | 25d | 1 | 0.09mi |
| 2714 Dawson St Indianapolis, IN | 3.0 | 1.0 | 912 | $1,500 | $1.64 | 0d | 1 | 0.15mi |
| 2633 S Randolph St Indianapolis, IN | 2.0 | 1.0 | 900 | $995 | $1.11 | 12d | 1 | 0.24mi |
| 2633 S Randolph St Unit b Indianapolis, IN | 2.0 | 1.0 | 900 | $995 | $1.11 | 25d | 1 | 0.24mi |
| 1549 Nelson Ave Indianapolis, IN | 3.0 | 1.0 | 950 | $1,380 | $1.45 | 46d | 1 | 0.35mi |
| 1621 Knox St Indianapolis, IN | 4.0 | 2.0 | 1411 | $930 | $0.66 | 6d | 1 | 0.36mi |
| 1144 McDougal St Indianapolis, IN | 3.0 | 1.0 | 876 | $1,500 | $1.71 | 24d | 1 | 0.58mi |
| 3311 Linden St Indianapolis, IN | 3.0 | 1.0 | 1056 | $1,150 | $1.09 | 46d | 1 | 0.75mi |
| 3334 Laurel St Indianapolis, IN | 3.0 | 1.0 | 1068 | $1,200 | $1.12 | 22d | 1 | 0.77mi |
| 1706 E Tabor St Unit 1708 Indianapolis, IN | 3.0 | 1.0 | 1000 | $1,300 | $1.30 | 9d | 1 | 0.78mi |
| 2430 E Kelly St Indianapolis, IN | 2.0 | 1.0 | 965 | $949 | $0.98 | 46d | 1 | 0.82mi |
| 3319 Olive St Indianapolis, IN | 3.0 | 2.0 | 1588 | $1,450 | $0.91 | 25d | 1 | 0.83mi |
| 3312 Olive St Indianapolis, IN | 3.0 | 2.0 | 1000 | $1,395 | $1.40 | 25d | 1 | 0.84mi |
| 1620 Norton Ave Indianapolis, IN | 3.0 | 1.0 | 928 | $1,395 | $1.50 | 0d | 1 | 0.85mi |
| 1620 Norton Ave Indianapolis, IN | 3.0 | 1.0 | 928 | $1,395 | $1.50 | 20d | 1 | 0.85mi |
| 2315 Bischoff Dr Beech Grove, IN | 2.0 | 1.0 | 1065 | $848 | $0.80 | 25d | 2 | 0.93mi |
| 2036 Calhoun St Indianapolis, IN | 2.0 | 1.0 | 880 | $1,200 | $1.36 | 9d | 1 | 0.99mi |
| 2020 Boyd Ave Indianapolis, IN | 3.0 | 1.5 | 1160 | $1,450 | $1.25 | 25d | 1 | 1.05mi |
| 2018 Boyd Ave Indianapolis, IN | 3.0 | 1.5 | 1160 | $1,350 | $1.16 | 46d | 1 | 1.05mi |
| 3633 S Rural St Indianapolis, IN | 3.0 | 2.5 | 1440 | $1,700 | $1.18 | 25d | 1 | 1.07mi |
| 1011 E Raymond St Indianapolis, IN | 2.0 | 2.0 | 1100 | $1,350 | $1.23 | 25d | 1 | 1.10mi |
| 410 N 20th Ave Beech Grove, IN | 3.0 | 1.0 | 1224 | $1,400 | $1.14 | 25d | 1 | 1.15mi |
| 376 Ticen St Beech Grove, IN | 3.0 | 1.5 | 1524 | $1,696 | $1.11 | 0d | 1 | 1.16mi |
| 1815 Dawson St Unit 1815 Indianapolis, IN | 2.0 | 1.0 | 1019 | $999 | $0.98 | 16d | 1 | 1.19mi |
| 2770 South East St Unit 302 Indianapolis, IN | 3.0 | 2.0 | 1158 | $1,015 | $0.88 | 5d | 1 | 1.20mi |
| 2770 S East St Apt 103 Indianapolis, IN | 3.0 | 2.0 | 1190 | $1,045 | $0.88 | 16d | 1 | 1.20mi |
| 2760 S East St Indianapolis, IN | 2.0–3.0 | 2.0 | 1072 | $1,045 | $0.97 | 5d | 3 | 1.21mi |
| 1258 E Naomi St Indianapolis, IN | 3.0 | 2.0 | 1608 | $1,450 | $0.90 | 9d | 1 | 1.27mi |
| 1973 Newcomer Ln Beech Grove, IN | 4.0 | 1.0 | 1368 | $1,500 | $1.10 | 24d | 1 | 1.29mi |
| 1117 E Naomi St Indianapolis, IN | 2.0 | 1.5 | 976 | $1,450 | $1.49 | 0d | 1 | 1.30mi |
| 1742 Thaddeus St Unit 1742-A Indianapolis, IN | 3.0 | 2.0 | 1350 | $1,600 | $1.19 | 16d | 1 | 1.31mi |
| 1729 Thaddeus St Unit 1729-B Indianapolis, IN | 3.0 | 2.0 | 1350 | $1,600 | $1.19 | 16d | 1 | 1.32mi |
| 1861 Barth Ave Unit 1861 Indianapolis, IN | 2.0 | 1.0 | 1300 | $1,600 | $1.23 | 25d | 1 | 1.34mi |
| 1543 S State Ave Indianapolis, IN | 2.0 | 1.0 | 1086 | $1,100 | $1.01 | 9d | 1 | 1.41mi |
| 1602 Quill St Unit B Indianapolis, IN | 3.0 | 2.0 | 1250 | $1,525 | $1.22 | 0d | 1 | 1.42mi |
| 1602 Quill St Unit B Indianapolis, IN | 3.0 | 2.0 | 1250 | $1,750 | $1.40 | 46d | 1 | 1.42mi |
| 1602 Quill St Unit B Indianapolis, IN | 3.0 | 2.0 | 1250 | $1,650 | $1.32 | 16d | 1 | 1.42mi |
| 1534 Dawson St Indianapolis, IN | 3.0 | 1.0 | 1040 | $1,499 | $1.44 | 25d | 1 | 1.43mi |
| 2109 Singleton St Indianapolis, IN | 3.0 | 2.0 | 1340 | $2,100 | $1.57 | 9d | 1 | 1.43mi |
| 4032 S Rural St Indianapolis, IN | 4.0 | 2.0 | 1728 | $1,980 | $1.15 | 0d | 1 | 1.45mi |
Listing history 4 events
-
2026-06-19status $115,000 Pending 2 DOM
-
2026-06-18days on market $115,000 Active 2 DOM
-
2026-06-16remarks 699-char remark
-
2026-06-16$115,000 Active 1 DOM
ⓘ Source: listings_history table (triggers on properties + properties_extension) + one-shot
backfill from property_details.listing_events for pre-trigger history.
Tax reassessment forecast IN · Partial reset (capped growth)
- Current annual tax
- $988 · $82/mo
- Projected year-2 tax
- $988 · $82/mo
- Expected delta
- $0/yr ($0/mo · 0.0%)
ⓘ Screening estimate from a state-policy table — verify with the county assessor before closing.
Climate risk First Street
- Flood 1/10 Low FEMA zone X (unshaded) · 0% chance over 30 yrs
- Wildfire 1/10 Low
- Heat 4/10 Moderate 7 d/yr ≥101°F today · 19 d/yr by 30 yrs out
- Wind 2/10 Low 0% chance of damaging wind over 30 yrs
- Air quality 3/10 Moderate 2 unhealthy d/yr today · 3 by 30 yrs out
Nearby sold comps map
Loading sold comps map…
Walkable amenities ~0.75 mi
Loading nearby amenities…
Taxation est. · year 1
- Rental income
- $17,181
- − Mortgage interest
- −$6,442
- − Property taxes
- −$988
- − Insurance
- −$575
- − Repairs & maintenance
- −$1,375
- − Management
- −$1,375
- − Depreciation
- −$3,345
- Taxable income
- $3,083
- Est. tax owed @ 24.0%
- −$740
- After-tax cash flow
- $4,034/yr
For passive investors: Depreciation is non-cash, so a rental often shows a tax loss while cash-flowing — sheltering income. Rental losses are passive: they offset passive income freely, and up to $25,000/yr can offset ordinary (W-2) income if you actively participate and your MAGI is under $100k (phasing out to $0 by $150k); unused losses carry forward. On sale, claimed depreciation is recaptured at up to 25%, and gains may owe capital-gains tax (a 1031 exchange can defer both). Figures are a year-1 estimate at your 24.0% rate — not tax advice; consult a CPA.
Schools (NCES district)
- District
- Indianapolis Public Schools
- NCES district ID
- 1804770
- Math proficiency
- 14% ▼ -7.00%
- Reading proficiency
- 20% ▼ -3.00%
- Median HH income
- $32,034
- Composite
- 13.69/100
- National rank
- #9499
- State rank
- #286 of 301 in IN
Livability — Indianapolis city (balance)
No livability data for this city. (Only ~50 U.S. cities are tracked.)
Census & demographics
- Census place
- Indianapolis city (balance), IN
- County
- Marion County · 998,460 people
- City population
- 881,119
- Metro
- Indianapolis-Carmel-Anderson, IN
- Population (ZIP)
- 37,758
- Household income
- $57,393
- Rent vs Own
- Severe rent burden
- 1499.0
Population outlook (Marion County) Hauer SSP2
- Today (2025)
- 1,025,572 people
- By 2030
- 1,065,727 · +3.9%
- By 2040
- 1,141,577 · +11.3%
- By 2050
- 1,208,920 · +17.9%
- By 2075
- 1,367,288 · +33.3%
- By 2100
- 1,438,201 · +40.2%
Race, ethnicity, and origin ACS 2023
- Neighborhood character
- Predominantly White (69%)
- Race & ethnicity
- White 69% Hispanic / Latino 14% Black 12% Two or more races 8% Asian 2% Native American 1%
- Hispanic origin (detail)
- Mexican 12% Puerto Rican 1%
- Common ancestry
- Slovak 2% Lithuanian 2% Italian 1%
- Foreign-born
- 8% · Canada
- Languages at home
- 88% English-only · Spanish 10% Other Indo-European 1%
Political lean MEDSL · Marion
- 2024 margin
- Strong D (+27.7) · D 63.0% · R 35.3% · Other 1.7%
- 2008→2024 swing
- -0.7pp no change · 2008: 28.4pp · 2024: 27.7pp
- All cycles
- 2024: D+27.7 2020: D+29.1 2016: D+22.8 2012: D+22.2 2008: D+28.4
Not yet ingested
- Civics
- —
Market trends
- HPI YoY
- ▼ -127.37%
- Current HPI
- 349.579
- Rent YoY
- ▲ 2.88%
- Metro
- Indianapolis-Carmel-Anderson, IN
- State GDP YoY
- ▲ 2.90%
- F500 in state
- 18
Industry mix (Fortune 500 HQ in IN)
| Industry | F500 HQs | Revenue |
|---|---|---|
| Industrial Machinery | 2 | $37B |
|
||
| Healthcare | 1 | $177B |
|
||
| Pharmaceuticals | 1 | $45B |
|
||
| Metals / Steel | 1 | $18B |
|
||
| Agriculture | 1 | $17B |
|
||
| Packaging | 1 | $12B |
|
||
Price history
1 event — show timeline
- 2026-06-16 Listed $115,000 MIBOR as Distributed by MLS Grid
Property tax history
+8.3%/yrLatest (2025): $988 · -3.0% YoY. Source: county tax records.
Cash-flow waterfall
monthlySold comps — $/sqft
last 12 mo · ≤1 miLoading sold comps…