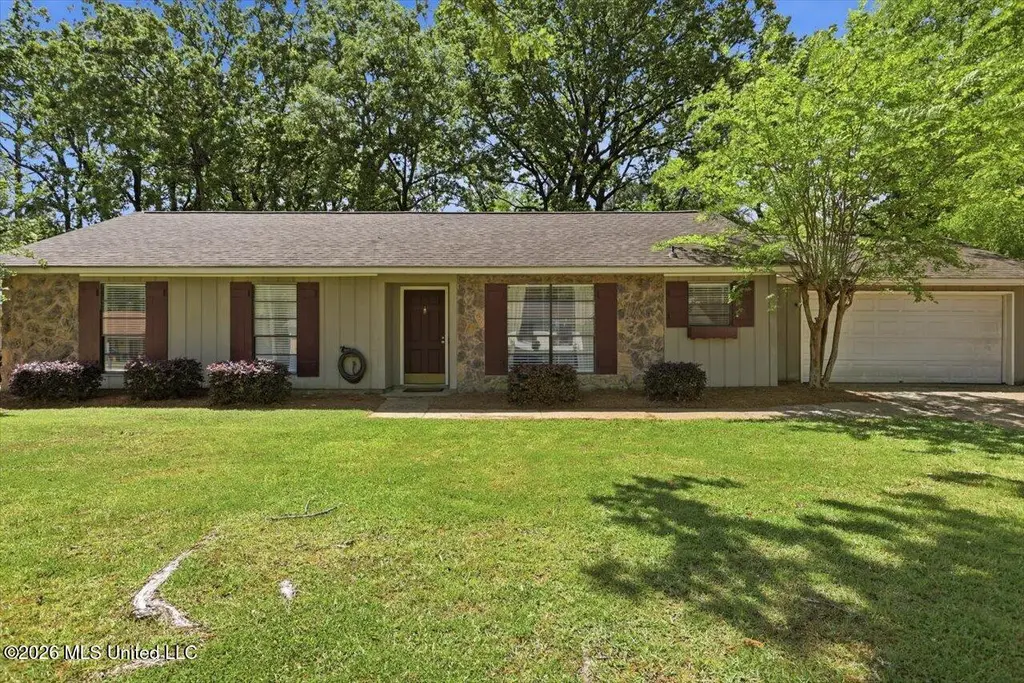
123 Cumberland Rd · Flowood, MS
Flood risk 1/10 · Minimal
- FEMA flood zone
- X (unshaded)
- Chance of flooding over 30 yrs
- 0.0%
- Est. flood insurance / yr
- $507 – $1,088
Fire risk 3/10 · Minor
- Est. fire insurance / yr
- $1,241 – $2,305
Heat risk 7/10 · Major
- Hot days now (above 108°F)
- 7 days/yr
- Hot days in 30 yrs
- 19 days/yr
Wind risk 8/10 · Major
- Chance of severe wind over 30 yrs
- 80.0%
Air-quality risk 2/10 · Minimal
- Unhealthy air days now
- 1 days/yr
- Unhealthy air days in 30 yrs
- 1 days/yr
Risk factors via First Street. Map © Google.
Why this score? — see what drove the C- grade
The composite is a weighted blend of 9 inputs, each scored 0–100. Each bar is that input's sub-score; the figure is the points it added to the 100-point composite (weight × sub-score).
- Cash flow +22.7/30.0
- DSCR +7.3/10.0
- ARV discount +4.8/15.0
- 1% rule +4.7/10.0
- Schools +4.6/10.0
- Livability +3.9/5.0
- Rent growth +3.2/5.0
- Condition / age +2.5/5.0
- Appreciation +0.0/10.0
$219,900
🖨 Deal sheet 📄 Offer letter ✓ Due diligence
Listing remarks MLS
This 3/2 clean, well maintained home has many updated features including ceramic tile, paint, fixtures, & carpet. The home has a 2 car garage with a large shaded, fenced backyard. This nice, desirable neighborhood is located just two miles from the Ross Barnett Reservoir, Spillway Rd. and Hwy. 25.
Key facts
- Ample counter space
- Generously sized lot
- Welcoming interior
Tags
Property features AI
Finance
- Financial info: Financial details not provided
- HOA & community: Community features: biking trails, near entertainment
Exterior
- Parking: 2-car garage; Driveway; Garage faces front; Concrete parking surface; Secured garage/parking
- Security: Smoke detectors; Secured garage/parking; Dead bolt locks
- Utilities: Public water; Public sewer; Electricity connected; Natural gas connected; Sewer connected; Water connected; Cable available
- Home design: Single-family house; One level (single story); Move-in ready; General residential zoning; Facing direction not specified; Entry level not specified
- Construction: Brick, siding, and stone exterior; Shingle roof; Slab foundation; Built year from public records (year not specified)
- Exterior features: Patio; Private yard; Back yard fencing; Yard lighting; Shed(s); Few trees; Fenced lot; Front yard
Interior
- Kitchen: Dishwasher; Exhaust fan; Free-standing electric oven; Free-standing electric range; Refrigerator; Eat-in kitchen
- Bedrooms: Bedrooms not specified
- Flooring: Laminate flooring; Tile flooring
- Bathrooms: 2 full bathrooms
- Heating & cooling: Central heating (natural gas); Fireplace heating; Central air conditioning; Ceiling fans for cooling
- Interior features: Ceiling fans; Eat-in kitchen; Entrance foyer; Blinds; Dead bolt locks; Sliding doors; Wood-burning fireplace in the living room
- Laundry & utility: Laundry area located in the garage; Gas water heater
Neighborhood map
What this means for you Summary
Snapshot
- This is a 3-bed/1.0-bath single-family listed at $220k.
Deal economics
- At list price, monthly cash flow is $377 ($5k/yr) — positive.
- The deal already cash-flows at list — no discount required.
- To meet the 1% rule (rent ≥ 1% of price), the offer needs to be $214k (2.5% below list).
- Recommended offer: $214k (2.5% below list) — sets the bar for 1% rule.
- Cap rate 8.4% vs local median 4.3% in Flowood — top-decile yield for the area; either an underpriced asset or a hidden risk that comps aren't pricing in. Stress-test before assuming the spread holds.
Location & tenants
- Location reads 77/100 on livability (#10 in MS, #3,075 nationally) — a middle-class / working-renter tenant base. Strengths: crime A+, cost of living A+, housing A+; Watch: amenities F, commute F.
- Rankin County School District (rural): math 56% / reading 48% proficiency, ranked #6 of 130 in MS (top 5%) — acceptable for families but not a draw, mixed tenant base, ~2y average lease.
- Zoned schools: Highland Bluff Elementary (math 52% / reading 50%, grade C-, #58 of 375 statewide, top 15%, 577 students, 100% FRL); Northwest Rankin Middle School (math 63% / reading 51%, grade B, #13 of 179 statewide, top 7%, 1,374 students, 100% FRL); Northwest Rankin High School (math 48% / reading 42%, grade D-, #34 of 197 statewide, top 17%, 1,898 students, 100% FRL) — zoned schools average 100% FRL vs 35% district-wide (65 pts higher); higher-poverty schools than district average — tighter screening recommended.
- Market conditions: Rents rising (+2.9%/yr); 433 active listings in the ZIP; 9 comparable units currently listed for rent nearby; rentals at typical pace (median 24d on market — plan ~3-4 weeks tenant-placement turnaround); solid renter incomes; 343 units permitted in Rankin County in 2024 (0 in 5+ unit buildings).
Forward outlook
- Local home prices are declining (-3.0%/yr); year-one equity from $2k of loan paydown is wiped out by about $7k of value loss. Plan a longer hold.
- Rankin County population projected at +17% by 2050 — long-run rental-demand tailwind backs the buy-and-hold thesis.
Negotiation context
- Only 5 days on market — expect competitive offers; lowballing is unlikely to land.
- 3 sale attempts since 24y ago with the ask held roughly flat each time — persistent listings suggest the price (not the market) is what's stuck; bring a comps-based counter.
Risks & watch-outs
- Climate carrying-cost: severe wind risk, 80% chance of damaging wind over 30y; extreme-heat days projected 7→19/yr by 2055 (HVAC capex compounding) — expect insurance premiums to compound above CPI over the hold.
Questions for the listing agent
- Built in 1979 — when were the roof, HVAC, electrical panel, plumbing, and water heater last replaced?
- Is there a deadline driving the sale (1031 exchange, divorce, estate, relocation)? That informs how much negotiation room exists.
- Schools are B-rated — typically a magnet for longer-tenancy family renters. What's the average tenant stay here, and is there a school-zone premium baked into asking?
- What's the average days-on-market for RENTAL listings here right now (not sales)? A rising rental-DOM trend means longer vacancies and softer asking-rent achievability than the comps imply.
- What's the recent tenant-quality profile in this submarket — average credit score on applications, eviction rate, late-payment / NSF rate, and stable-employment percentage? A property-management company in the area should have these aggregated.
- How much new for-sale + rental construction is in the pipeline within 1–3 miles? Heavy new supply typically softens prices + rents 12–24 months out; constrained supply supports both.
Investment metrics
- 1% rule
- 0.97% ✗
- Cap rate
- 8.35%
- Cash-on-cash
- 7.35%
- DSCR
- 1.33
- GRM
- 8.5
CMA / ARV
- ARV (on-the-fly)
- $207,612
- Comps found
- 12
Show comp detail 12 sales within ~0.75 mi
| Address | Dist | Beds/Ba | Sqft | Sold | Price | $/sf | Match |
|---|---|---|---|---|---|---|---|
| 123 Cumberland Rd | 0.00mi | 3/2.0 | 1,346 (+2%) | 1mo | $219,900 | $163 | 91 |
| 102 Cumberland Rd | 0.10mi | 3/2.0 | 1,335 (+2%) | 0mo | $145,000 | $109 | 88 |
| 117 Cumberland Rd | 0.05mi | 3/2.0 | 1,339 (+2%) | 3mo | $219,900 | $164 | 88 |
| 1 Brandy Village Cv | 0.30mi | 3/2.0 | 1,331 (+1%) | 2mo | $218,000 | $164 | 78 |
| 102 Bellegrove Pl | 0.42mi | 3/2.0 | 1,315 (+0%) | 7mo | $209,900 | $160 | 71 |
| 191 Bellegrove Cir | 0.54mi | 3/2.0 | 1,242 (-6%) | 3mo | $193,500 | $156 | 59 |
| 14 S Brandy Ct | 0.28mi | 3/2.0 | 1,144 (-13%) | 3mo | $167,500 | $146 | 59 |
| 117 Shenandoah Rd | 0.50mi | 3/2.0 | 1,426 (+8%) | 1mo | $165,000 | $116 | 58 |
| 169 Bellegrove Cir | 0.57mi | 3/2.0 | 1,394 (+6%) | 2mo | $220,000 | $158 | 58 |
| 308 N Grove Circle Cir | 0.20mi | 2/2.0 (-1) | 1,150 (-12%) | 8mo | $169,000 | $147 | 54 |
| 112 Wildwood Ln | 0.46mi | 3/2.0 | 1,475 (+12%) | 6mo | $210,000 | $142 | 49 |
| 102 Live Oak Cv | 0.50mi | 3/2.0 | 1,485 (+13%) | 7mo | $238,000 | $160 | 45 |
Match score weights: distance 35% · size 25% · config 20% · recency 20%. Top-matched comps best support the ARV.
Projected returns pro-forma
-3.0% appreciation · 2.9% rent growth · sell at horizon
- IRR
- -5.2%
- Equity multiple
- 0.81×
- Total profit
- $-11,925
- Equity at exit
- $32,788
- IRR
- 4.3%
- Equity multiple
- 1.31×
- Total profit
- $19,282
- Equity at exit
- $19,013
Cash invested: $61,572 (down + closing). Projections, not guarantees.
Landlord ↔ Tenant lean methodology
- Overall (STATE)
- 90 Strongly Landlord-Friendly
- State Mississippi
- 90 Strongly Landlord-Friendly · R+11
- County
- — inherits STATE
- City
- — inherits STATE
ZIP-level market 39047
- Home prices YoY
- -32.6%
- Rents YoY
- 2.9%
- Active inventory
- 433
- Price-to-rent
- 8.5×
Monthly cashflow live
- Estimated rent
- $2,144 high interval (Pro) →
- Mortgage (P&I)
- −$1,153
- Tax from tax record
- −$72 /mo · $860/yr
- Insurance
- −$92
- HOA
- −$0
- Vacancy / Maint / Mgmt
- −$450
- Net cashflow
- $377
Break-even live
UW: 25.0% down · 7.5% · 30yr · 1.5% tax · 5.0% vac · 8.0% maint · 8.0% mgmt
Financing live
Cash to close
- Down payment
- $54,975
- Closing costs
- $6,597
- Reserves months
- —
- Total cash needed
- —
Loan-product check · same deal, 3 products live
Conventional
25% down · 7.5% · 30yr
- Down + closing
- —
- Monthly P&I
- —
- Monthly cashflow
- —
- DSCR
- —
- Eligible?
- —
Personal DTI + credit; lowest rate.
DSCR
20% down · 8.5% · 30yr
- Down + closing
- —
- Monthly P&I
- —
- Monthly cashflow
- —
- DSCR
- —
- Eligible?
- —
No personal income docs; deal must DSCR.
Hard money
10% down · 12.0% · 12mo
- Down + closing
- —
- Monthly P&I
- —
- Monthly cashflow
- —
- DSCR
- —
- Eligible?
- —
Short-term bridge; refi at stabilization.
Rent comps 9 comps
| Address | Beds | Baths | Sqft | Rent | $/sqft | DOM | Units | Dist |
|---|---|---|---|---|---|---|---|---|
| 133 Cumberland Rd Brandon, MS | 4.0 | 3.0 | 1846 | $2,225 | $1.21 | 23d | 1 | 0.07mi |
| 413 Shenandoah Rd N Brandon, MS | 4.0 | 2.0 | 1715 | $2,056 | $1.20 | 13d | 1 | 0.12mi |
| 183 Cumberland Rd Brandon, MS | 3.0 | 2.0 | 1097 | $1,750 | $1.60 | 21d | 1 | 0.23mi |
| 218 Shenandoah Rd N Brandon, MS | 3.0 | 2.0 | 1625 | $2,006 | $1.23 | 43d | 1 | 0.36mi |
| 199 Dogwood Cir Brandon, MS | 3.0 | 2.0 | 1550 | $1,900 | $1.23 | 44d | 1 | 0.54mi |
| 154 Plum Tree Rd Brandon, MS | 3.0 | 2.0 | 1289 | $1,931 | $1.50 | 23d | 1 | 0.67mi |
| 520 Vine Dr Flowood, MS | 2.0–3.0 | 2.0 | 1114 | $1,745 | $1.57 | 13d | 8 | 0.99mi |
| 500 Avalon Way Brandon, MS | 2.0–3.0 | 2.0 | 1287 | $2,052 | $1.59 | 13d | 6 | 1.26mi |
| 352 Brendalwood Cv Brandon, MS | 2.0 | 1.5 | 1248 | $1,157 | $0.93 | 43d | 1 | 1.42mi |
Listing history 7 events
-
2026-04-15status Pending
-
2026-04-10$219,900 Active
-
2022-05-03historical
-
2022-05-03status Pending
-
2022-04-25$205,000 Active
-
2002-05-10soldstatus 302-char remark
Show marketing remark (302 chars)
This 3/2 clean, well maintained home has many updated features including ceramic tile, paint, fixtures, & carpet. The home has a 2 car garage with a large shaded, fenced backyard. This nice, desirable neighborhood is located just two miles from the Ross Barnett Reservoir, Spillway Rd. and Hwy. 25.
-
2002-02-04$92,500 302-char remark
Show marketing remark (302 chars)
This 3/2 clean, well maintained home has many updated features including ceramic tile, paint, fixtures, & carpet. The home has a 2 car garage with a large shaded, fenced backyard. This nice, desirable neighborhood is located just two miles from the Ross Barnett Reservoir, Spillway Rd. and Hwy. 25.
ⓘ Source: listings_history table (triggers on properties + properties_extension) + one-shot
backfill from property_details.listing_events for pre-trigger history.
Tax reassessment forecast MS · Resets to sale price
- Current annual tax
- $860 · $72/mo
- Projected year-2 tax
- $1,737 · $145/mo
- Expected delta
- +$878/yr (+$73/mo · 102.1%)
ⓘ Screening estimate from a state-policy table — verify with the county assessor before closing.
Climate risk First Street
- Flood 1/10 Low FEMA zone X (unshaded) · 0% chance over 30 yrs
- Wildfire 3/10 Moderate
- Heat 7/10 Severe 7 d/yr ≥108°F today · 19 d/yr by 30 yrs out
- Wind 8/10 Severe 80% chance of damaging wind over 30 yrs
- Air quality 2/10 Low 1 unhealthy d/yr today · 1 by 30 yrs out
Nearby sold comps map
Loading sold comps map…
Walkable amenities ~0.75 mi
Loading nearby amenities…
Taxation est. · year 1
- Rental income
- $25,724
- − Mortgage interest
- −$12,318
- − Property taxes
- −$860
- − Insurance
- −$1,100
- − Repairs & maintenance
- −$2,058
- − Management
- −$2,058
- − Depreciation
- −$6,397
- Taxable income
- $934
- Est. tax owed @ 24.0%
- −$224
- After-tax cash flow
- $4,301/yr
For passive investors: Depreciation is non-cash, so a rental often shows a tax loss while cash-flowing — sheltering income. Rental losses are passive: they offset passive income freely, and up to $25,000/yr can offset ordinary (W-2) income if you actively participate and your MAGI is under $100k (phasing out to $0 by $150k); unused losses carry forward. On sale, claimed depreciation is recaptured at up to 25%, and gains may owe capital-gains tax (a 1031 exchange can defer both). Figures are a year-1 estimate at your 24.0% rate — not tax advice; consult a CPA.
Schools (NCES district)
- District
- Rankin County School District
- NCES district ID
- 2803830
- Math proficiency
- 56% ▼ -4.00%
- Reading proficiency
- 48% ▼ -6.00%
- Median HH income
- $61,867
- Composite
- 45.62/100
- National rank
- #2587
- State rank
- #6 of 130 in MS
Livability — Flowood
- Score
- 77/100
- State rank
- #10
- US rank
- #3075
Category grades
Schools grade is shown separately in the Schools card above.
Census & demographics
- County
- Rankin County · 123,614 people
- City population
- 9,222
- Metro
- Jackson, MS
- Population (ZIP)
- 40,808
- Household income
- $100,347
- Rent vs Own
- Severe rent burden
- 551.0
Population outlook (Rankin County) Hauer SSP2
- Today (2025)
- 164,317 people
- By 2030
- 171,013 · +4.1%
- By 2040
- 182,723 · +11.2%
- By 2050
- 192,376 · +17.1%
- By 2075
- 209,535 · +27.5%
- By 2100
- 209,534 · +27.5%
Race, ethnicity, and origin ACS 2023
- Neighborhood character
- Predominantly White (77%)
- Race & ethnicity
- White 77% Black 16% Two or more races 4% Hispanic / Latino 2% Asian 1%
- Common ancestry
- Italian 4% Slovak 3% Serbian 3%
- Foreign-born
- 3% · Canada
- Languages at home
- 95% English-only · Spanish 3% Other Indo-European 1% Other Asian/Pacific 1%
Political lean MEDSL · Rankin
- 2024 margin
- Solid R (+47.1) · D 25.9% · R 73.0% · Other 1.0%
- 2008→2024 swing
- +6.4pp toward D · 2008: -53.5pp · 2024: -47.1pp
- All cycles
- 2024: R+47.1 2020: R+45.4 2016: R+52.9 2012: R+51.9 2008: R+53.5
Not yet ingested
- Civics
- —
Market trends
- HPI YoY
- ▼ -79.01%
- Current HPI
- 162.9709
- Rent YoY
- ▲ 2.90%
- Metro
- Jackson, MS
- State GDP YoY
- —
- F500 in state
- 0
Price history
+137.7% since first listed7 events — show timeline
- 2026-04-15 Pending — MLSU
- 2026-04-10 Listed $219,900 MLSU
- 2022-05-03 Listing Removed — MLSU
- 2022-05-03 Pending — MLSU
- 2022-04-25 Listed $205,000 MLSU
- 2002-05-10 Sold (MLS) — MLSU
- 2002-02-04 Listed $92,500 MLSU
Property tax history
+5.0%/yrLatest (2025): $860 · +7.5% YoY. Source: county tax records.
Cash-flow waterfall
monthlySold comps — $/sqft
last 12 mo · ≤1 miLoading sold comps…