 Duplex
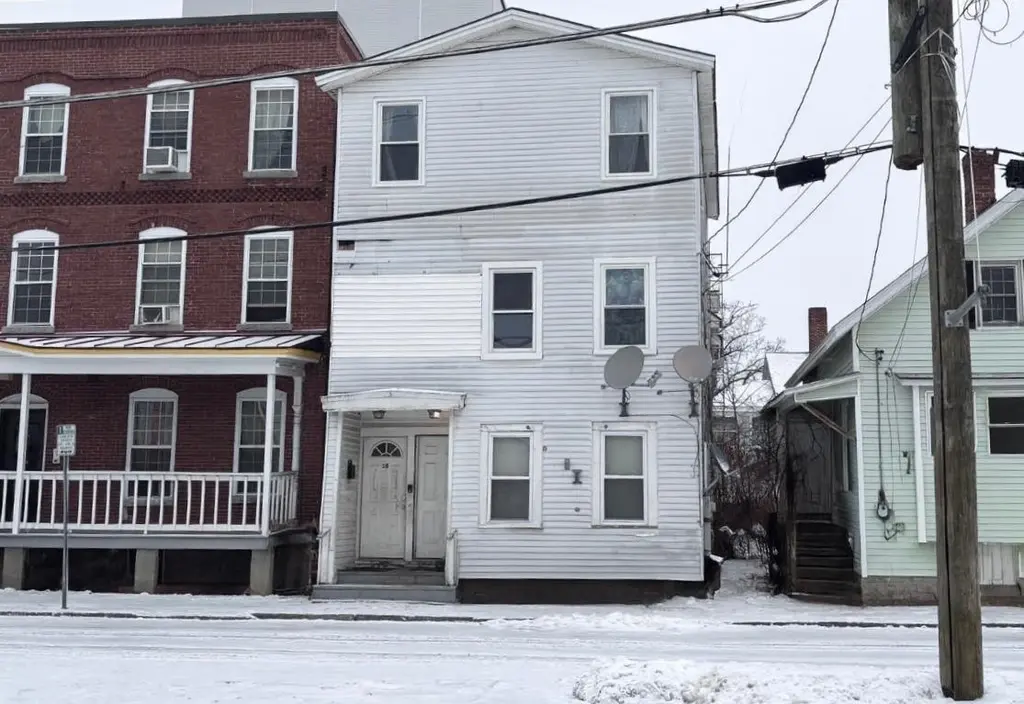
18-20 Maple St · Nashua, NH
Flood risk 1/10 · Minimal
- FEMA flood zone
- X (unshaded)
- Chance of flooding over 30 yrs
- 0.0%
- Est. flood insurance / yr
- $473 – $860
Fire risk 1/10 · Minimal
- Est. fire insurance / yr
- $507 – $941
Heat risk 5/10 · Moderate
- Hot days now (above 96°F)
- 7 days/yr
- Hot days in 30 yrs
- 17 days/yr
Wind risk 6/10 · Moderate
- Chance of severe wind over 30 yrs
- 27.0%
Air-quality risk 2/10 · Minimal
- Unhealthy air days now
- 1 days/yr
- Unhealthy air days in 30 yrs
- 2 days/yr
Risk factors via First Street. Map © Google.
Why this score? — see what drove the C- grade
The composite is a weighted blend of 9 inputs, each scored 0–100. Each bar is that input's sub-score; the figure is the points it added to the 100-point composite (weight × sub-score).
- Cash flow +15.6/30.0
- ARV discount +13.1/15.0
- DSCR +4.8/10.0
- 1% rule +4.3/10.0
- Livability +4.2/5.0
- Rent growth +3.1/5.0
- Schools +3.1/10.0
- Condition / age +2.2/5.0
- Appreciation +0.0/10.0
$480,000
🖨 Deal sheet 📄 Offer letter ✓ Due diligence
Multi-family units
County records classify this as Multi-Family (2-4 Unit). Listing-text estimate: 2 units. confirmed
Listing remarks MLS
Good sized Multi family close to downtown shopping and dining. Fast to the highway. Parking lot adjacent to property, Good income, Sold "AS IS" lot size is. 036
Key facts
- Parking lot adjacent
- Close to downtown
- 1,306 sq ft lot
Tags
Neighborhood map
What this means for you Summary
Snapshot
- This is a 2 × ?-bed/?-bath units multifamily listed at $480k. Condition is rated fair.
Deal economics
- At list price, monthly cash flow is $199 ($2k/yr) — positive. Per door: $100/mo.
- The deal already cash-flows at list — no discount required.
- To meet the 1% rule (rent ≥ 1% of price), the offer needs to be $445k (7.3% below list).
- Recommended offer: $422k (12.0% below list) — sets the bar for market timing.
- Cap rate 6.8% vs local median 2.9% in Nashua — top-decile yield for the area; either an underpriced asset or a hidden risk that comps aren't pricing in. Stress-test before assuming the spread holds.
Location & tenants
- Location reads 83/100 on livability (#11 in NH, #983 nationally) — a professional / high-income tenant draw. Strengths: commute A+, housing A+, health & safety A+; Watch: amenities D+.
- Nashua School District (urban): math 27% / reading 40% proficiency, ranked #77 of 98 in NH (top 79%) — families likely to look elsewhere, expect single-tenant / working-renter base with shorter leases.
- Market conditions: Rents rising (+2.2%/yr); 45 active listings in the ZIP; solid renter incomes; 981 units permitted in Hillsborough County in 2024 (381 in 5+ unit buildings).
- At $4,451/mo this rent would consume 55% of the median local household income ($96k/yr) (locally 453% of renters already pay >50% of income on rent) — very limited rent-growth headroom before tenants either downsize or default.
Forward outlook
- Local home prices are declining (-3.0%/yr); year-one equity from $3k of loan paydown is wiped out by about $14k of value loss. Plan a longer hold.
- Hillsborough County population projected to shrink 8% by 2050 — rents likely to lag national; underwrite the cash flow, not the appreciation.
Negotiation context
- It's been on market 168 days — a 12% lower offer ($422k) is reasonable based on typical stale-listing flexibility.
Risks & watch-outs
- Watch-outs: built in 1880 — expect roof / HVAC / electrical / plumbing capex.
- Climate carrying-cost: major wind risk, 27% chance of damaging wind over 30y; extreme-heat days projected 7→17/yr by 2055 (HVAC capex compounding) — expect insurance premiums to compound above CPI over the hold.
Questions for the listing agent
- It's been on market 168 days. Have you received any prior offers? Is the seller open to a 12% concession, seller financing, or rate buy-down credit?
- Can we see the unit-by-unit rent roll, current vacancy, and any below-market leases? What's the average tenancy length?
- What capital expenditures (roof, boiler, parking lot, exteriors) have been made in the last 5 years, and what's planned in the next 2?
- Have any recent inspections been done? Can we get a copy of the seller's disclosures and any deferred-maintenance estimates?
- Built in 1880 — when were the roof, HVAC, electrical panel, plumbing, and water heater last replaced?
- Why hasn't it sold? Are there any deal-killer items the seller is aware of (foundation, flood, title, zoning, code violations)?
- Is there a deadline driving the sale (1031 exchange, divorce, estate, relocation)? That informs how much negotiation room exists.
- Schools are B-rated — typically a magnet for longer-tenancy family renters. What's the average tenant stay here, and is there a school-zone premium baked into asking?
- What's the average days-on-market for RENTAL listings here right now (not sales)? A rising rental-DOM trend means longer vacancies and softer asking-rent achievability than the comps imply.
- What's the recent tenant-quality profile in this submarket — average credit score on applications, eviction rate, late-payment / NSF rate, and stable-employment percentage? A property-management company in the area should have these aggregated.
- How much new apartment / multifamily construction is in the pipeline within 1–3 miles? Heavy new supply (>2% of stock underway) typically softens rents 12–24 months out; light construction supports rent growth.
Investment metrics
- 1% rule
- 0.93% ✗
- Cap rate
- 6.79%
- Cash-on-cash
- 1.78%
- DSCR
- 1.08
- GRM
- 9.0
CMA / ARV
- ARV (median comp)
- $547,847
- List price
- $480,000
- Delta
- -12.38%
- Verdict
- UNDERPRICED
- Comps
- 20 within 1.0 mi
Show comp detail 4 sales within ~0.75 mi
| Address | Dist | Beds/Ba | Sqft | Sold | Price | $/sf | Match |
|---|---|---|---|---|---|---|---|
| 22 Beech St | 0.08mi | 7/3.0 (-1) | 2,795 (+7%) | 0mo | $660,000 | $236 | 79 |
| 60 Whitney St | 0.63mi | 7/3.0 (-1) | 2,463 (-5%) | 13mo | $610,000 | $248 | 46 |
| 76 Ledge St | 0.55mi | 8/3.0 | 2,293 (-12%) | 22mo | $595,000 | $259 | 36 |
| 18 Cross St | 0.59mi | 7/3.0 (-1) | 2,857 (+10%) | 19mo | $676,700 | $237 | 35 |
Match score weights: distance 35% · size 25% · config 20% · recency 20%. Top-matched comps best support the ARV.
Projected returns pro-forma
-3.0% appreciation · 2.23% rent growth · sell at horizon
- IRR
- -14.3%
- Equity multiple
- 0.49×
- Total profit
- $-68,454
- Equity at exit
- $71,570
- IRR
- -6.9%
- Equity multiple
- 0.58×
- Total profit
- $-56,832
- Equity at exit
- $41,502
Cash invested: $134,400 (down + closing). Projections, not guarantees.
Landlord ↔ Tenant lean methodology
- Overall (STATE)
- 56 Moderately Landlord-Leaning
- State New Hampshire
- 56 Moderately Landlord-Leaning · D+1
- County
- — inherits STATE
- City
- — inherits STATE
ZIP-level market 03064
- Rents YoY
- 2.2%
- Active inventory
- 45
- Price-to-rent
- 18.0×
Monthly cashflow live
- Estimated rent
- $4,451 high interval (Pro) →
- Mortgage (P&I)
- −$2,517
- Tax est. 1.5%
- −$600 /mo · $7,200/yr
- Insurance
- −$200
- HOA
- −$0
- Vacancy / Maint / Mgmt
- −$935
- Net cashflow
- $199
Break-even live
2-unit breakdown (identical units grouped — click to expand)
| Units | Beds | Baths | Est. rent |
|---|---|---|---|
| 2× units | 0 | 0 | $4,452 |
| #1 | 0 | 0 | $2,226 |
| #2 | 0 | 0 | $2,226 |
| Total (2 units) | $4,451 | ||
UW: 25.0% down · 7.5% · 30yr · 1.5% tax · 5.0% vac · 8.0% maint · 8.0% mgmt
Financing live
Cash to close
- Down payment
- $120,000
- Closing costs
- $14,400
- Reserves months
- —
- Total cash needed
- —
Loan-product check · same deal, 3 products live
Conventional
25% down · 7.5% · 30yr
- Down + closing
- —
- Monthly P&I
- —
- Monthly cashflow
- —
- DSCR
- —
- Eligible?
- —
Personal DTI + credit; lowest rate.
DSCR
20% down · 8.5% · 30yr
- Down + closing
- —
- Monthly P&I
- —
- Monthly cashflow
- —
- DSCR
- —
- Eligible?
- —
No personal income docs; deal must DSCR.
Hard money
10% down · 12.0% · 12mo
- Down + closing
- —
- Monthly P&I
- —
- Monthly cashflow
- —
- DSCR
- —
- Eligible?
- —
Short-term bridge; refi at stabilization.
Listing history 15 events
-
2026-06-18days on market $480,000 Active 168 DOM
-
2026-06-17days on market $480,000 Active 167 DOM
-
2026-06-16days on market $480,000 Active 166 DOM
-
2026-06-15days on market $480,000 Active 165 DOM
-
2026-06-14days on market $480,000 Active 163 DOM
-
2026-06-10days on market $480,000 Active 160 DOM
-
2026-06-09days on market $480,000 Active 159 DOM
-
2026-06-08days on market $480,000 Active 158 DOM
-
2026-06-07days on market $480,000 Active 157 DOM
-
2026-06-03pricedays on market $480,000 Active 153 DOM
-
2026-06-02days on market $515,000 Active 152 DOM
-
2026-06-01days on market $515,000 Active 151 DOM
-
2026-05-31days on market $515,000 Active 150 DOM
-
2026-05-30days on market $515,000 Active 149 DOM
-
2026-01-01$515,000 Active 171-char remark
Show marketing remark (171 chars)
Good sized Multi family close to downtown shopping and dining. Fast to the highway. Parking lot adjacent to property, Good income, Sold "AS IS" lot size is. 036
ⓘ Source: listings_history table (triggers on properties + properties_extension) + one-shot
backfill from property_details.listing_events for pre-trigger history.
Climate risk First Street
- Flood 1/10 Low FEMA zone X (unshaded) · 0% chance over 30 yrs
- Wildfire 1/10 Low
- Heat 5/10 Major 7 d/yr ≥96°F today · 17 d/yr by 30 yrs out
- Wind 6/10 Major 27% chance of damaging wind over 30 yrs
- Air quality 2/10 Low 1 unhealthy d/yr today · 2 by 30 yrs out
Nearby sold comps map
Loading sold comps map…
Walkable amenities ~0.75 mi
Loading nearby amenities…
Taxation est. · year 1
- Rental income
- $53,412
- − Mortgage interest
- −$26,887
- − Property taxes
- −$7,200
- − Insurance
- −$2,400
- − Repairs & maintenance
- −$4,273
- − Management
- −$4,273
- − Depreciation
- −$13,964
- Taxable loss
- −$5,585
- Est. tax savings @ 24.0%
- +$1,340
- After-tax cash flow
- $3,730/yr
For passive investors: Depreciation is non-cash, so a rental often shows a tax loss while cash-flowing — sheltering income. Rental losses are passive: they offset passive income freely, and up to $25,000/yr can offset ordinary (W-2) income if you actively participate and your MAGI is under $100k (phasing out to $0 by $150k); unused losses carry forward. On sale, claimed depreciation is recaptured at up to 25%, and gains may owe capital-gains tax (a 1031 exchange can defer both). Figures are a year-1 estimate at your 24.0% rate — not tax advice; consult a CPA.
Condition & rehab AI · 2 photos
This multi-family property requires significant exterior repairs and maintenance, including siding and roof replacement, to improve its condition and value.
Repairs flagged
- Major siding — Significant wear and tear
- Major roof — Signs of wear and tear
Value-add opportunities
- Both paint exterior — Fresh paint can improve curb appeal and value
- Both repair and replace siding — New siding will improve the home's appearance and value
- Both repair and replace roof — A new roof will extend the home's lifespan and improve its value
Renovation cost estimate screening
| Repair item | Severity | Est. cost |
|---|---|---|
| siding · Significant wear and tear | Major | $15,000–50,000 |
| roof · Signs of wear and tear | Major | $15,000–50,000 |
| Total estimated repair cost · 2 items | $30,000–100,000 |
Value-add ROI direction
- Both paint exterior — Fresh paint can improve curb appeal and value ↑
- Both repair and replace siding — New siding will improve the home's appearance and value ↑
- Both repair and replace roof — A new roof will extend the home's lifespan and improve its value ↑
ⓘ Cost ranges are severity-bucket heuristics (US national rule-of-thumb). Get contractor quotes + a written scope before underwriting a rehab budget.
Schools (NCES district)
- District
- Nashua School District
- NCES district ID
- 3304980
- Math proficiency
- 27% ▼ -12.00%
- Reading proficiency
- 40% ▼ -6.00%
- Median HH income
- $66,393
- Composite
- 30.62/100
- National rank
- #6189
- State rank
- #77 of 98 in NH
Livability — Nashua
- Score
- 83/100
- State rank
- #11
- US rank
- #983
Category grades
Schools grade is shown separately in the Schools card above.
Census & demographics
- Census place
- Nashua, NH
- County
- Hillsborough County · 309,362 people
- City population
- 91,294
- Metro
- Manchester-Nashua, NH
- Population (ZIP)
- 14,391
- Household income
- $96,393
- Rent vs Own
- Severe rent burden
- 453.0
Population outlook (Hillsborough County) Hauer SSP2
- Today (2025)
- 412,771 people
- By 2030
- 410,974 · -0.4%
- By 2040
- 399,959 · -3.1%
- By 2050
- 381,542 · -7.6%
- By 2075
- 339,855 · -17.7%
- By 2100
- 289,270 · -29.9%
Race, ethnicity, and origin ACS 2023
- Neighborhood character
- Predominantly White (78%)
- Race & ethnicity
- White 78% Two or more races 13% Hispanic / Latino 12% Asian 3% Black 1%
- Hispanic origin (detail)
- Mexican 1% Puerto Rican 7% Dominican 1%
- Common ancestry
- Lithuanian 10% Slovak 4% Romanian 2%
- Foreign-born
- 11% · Canada, Philippines, China
- Languages at home
- 83% English-only · Spanish 9% Other Indo-European 2% Other Asian/Pacific 2%
Political lean MEDSL · Hillsborough
- 2024 margin
- Toss-up / Even · D 50.9% · R 48.0% · Other 1.0%
- 2008→2024 swing
- -0.9pp no change · 2008: 3.8pp · 2024: 2.9pp
- All cycles
- 2024: D+2.9 2020: D+7.7 2016: R+0.2 2012: D+1.7 2008: D+3.8
Not yet ingested
- Civics
- —
Market trends
- HPI YoY
- ▼ -167.44%
- Current HPI
- 308.7733
- Rent YoY
- ▲ 2.23%
- Metro
- Manchester-Nashua, NH
- State GDP YoY
- —
- F500 in state
- 0
Price history
1 event — show timeline
- 2026-01-01 Listed $515,000 PrimeMLS
Cash-flow waterfall
monthlySold comps — $/sqft
last 12 mo · ≤1 miLoading sold comps…