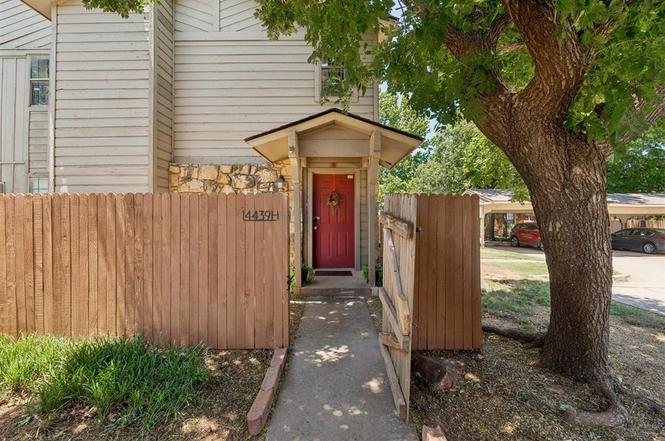
14439 N Pennsylvania Ave Unit 30H · Oklahoma City, OK
Flood risk No data
- FEMA flood zone
- —
- Chance of flooding over 30 yrs
- —
- Est. flood insurance / yr
- —
Fire risk No data
- Est. fire insurance / yr
- —
Heat risk No data
- Hot days now (above threshold)
- —
- Hot days in 30 yrs
- —
Wind risk No data
- Chance of severe wind over 30 yrs
- —
Air-quality risk No data
- Unhealthy air days now
- —
- Unhealthy air days in 30 yrs
- —
Risk factors via First Street. Map © Google.
Why this score? — see what drove the D grade
The composite is a weighted blend of 9 inputs, each scored 0–100. Each bar is that input's sub-score; the figure is the points it added to the 100-point composite (weight × sub-score).
- Cash flow +8.6/30.0
- ARV discount +7.5/15.0
- Appreciation +6.4/10.0
- 1% rule +4.4/10.0
- Livability +4.0/5.0
- Rent growth +3.8/5.0
- Schools +3.6/10.0
- Condition / age +2.5/5.0
- DSCR +2.4/10.0
$125,000
🖨 Deal sheet 📄 Offer letter ✓ Due diligence
Listing remarks MLS
Newer heat and air, appliances, paint, carpet! Completely updated and awesome. The fireplace is beautiful and the sitting area/second living is excellent! Colors are very pretty and go with the new carpet! Great area to live! Lower entry leads to the condo upstairs. Enjoy the view from the balcony on the master bedroom! Newer tub in the bath! Outside ins, pool, rec fac, water, cable incl in HOA!
Key facts
- Community pool
- Versatile loft space
- Private patio
Tags
Property features AI
Finance
- Other: Existing property; No storm shelter; Interior living area recorded as 855 (source: assessor)
- Financial info: Loan qualifying allowed; Not assumable
- HOA & community: Mandatory association dues; Association fee includes gated entry, greenbelt, partial utilities, pool, and recreation facility
Exterior
- Parking: Other parking
- Security: Gated entry (community amenity); Security system
- Utilities: Cable available; Electricity available; Public utilities
- Home design: Condominium; Upper-level unit; Residential property
- Construction: Stone exterior; Composition roof; Slab foundation
- Exterior features: Covered patio; Open patio; Storage; Interior lot
Interior
- Kitchen: Dishwasher; Microwave; Refrigerator; Electric range/oven
- Bedrooms: 1 bedroom (upper level condo)
- Flooring: Carpet; Laminate; Tile
- Bathrooms: 1 full bathroom
- Heating & cooling: Electric heating
- Interior features: Ceiling fans; Window treatments; Loft; Security system; Fireplace insert
- Laundry & utility: Washer and dryer included; Water heater
Neighborhood map
What this means for you Summary
Snapshot
- This is a 1-bed/1.0-bath condo listed at $125k.
Deal economics
- At list price, monthly cash flow is $-107 ($-1k/yr) — negative.
- To cash-flow at today's rent, offer at most $106k (15.1% below list).
- To meet the 1% rule (rent ≥ 1% of price), the offer needs to be $118k (6.0% below list).
- Recommended offer: $106k (15.1% below list) — sets the bar for cash-flow.
- Cap rate 5.3% vs local median 3.7% in Oklahoma City — top-decile yield for the area; either an underpriced asset or a hidden risk that comps aren't pricing in. Stress-test before assuming the spread holds.
Location & tenants
- Location reads 80/100 on livability (#3 in OK, #1,635 nationally) — a professional / high-income tenant draw. Strengths: amenities A+, commute A+, cost of living A+; Watch: crime F.
- Edmond (suburban): math 38% / reading 40% proficiency, ranked #11 of 270 in OK (top 4%) — families likely to look elsewhere, expect single-tenant / working-renter base with shorter leases.
- Zoned schools: Scissortail Elementary School (331 students, 0% FRL); Santa Fe Hs (math 36% / reading 52%, grade F, #18 of 447 statewide, top 4%, 2,796 students, 0% FRL) — zoned schools average 0% FRL vs 22% district-wide (22 pts lower); this property's tenant base skews higher-income than the district average.
- Market conditions: Rents rising fast (+5.2%/yr); 42 active listings in the ZIP; 26 comparable units currently listed for rent nearby; rentals leasing fast (median 2d on market — plan ~1-2 weeks tenant-placement turnaround); 5,365 units permitted in Oklahoma County in 2024 (569 in 5+ unit buildings).
Forward outlook
- In year one you build about $4k of equity ($864 loan paydown + $3k appreciation (2.7% local appreciation)).
- Oklahoma County population projected at +41% by 2050 — long-run rental-demand tailwind backs the buy-and-hold thesis.
- By year 8, paydown + projected appreciation supports a ~$32k cash-out refi (75% LTV) — recoverable capital for the next deal without selling this one.
Negotiation context
- Only 1 days on market — expect competitive offers; lowballing is unlikely to land.
- 2 sale attempts since 11y ago with the ask held roughly flat each time — persistent listings suggest the price (not the market) is what's stuck; bring a comps-based counter.
- Current owner paid $65k; list at $125k implies a 92% gain — meaningful room to come down on a strong offer.
Questions for the listing agent
- What do current leases actually rent for vs. the listed asking? Can we see a recent rent roll and the last 12 months of T-12 income?
- What does the HOA fee cover, when was the last increase, and are there any pending special assessments or reserve-fund shortfalls?
- Any open or pending special assessments — roof, HVAC, plumbing, elevator, façade? What's the per-unit balance and payoff schedule, and is the seller paying it off at close or rolling it to the buyer?
- Is there a deadline driving the sale (1031 exchange, divorce, estate, relocation)? That informs how much negotiation room exists.
- Schools are F-rated, which usually means shorter tenancies and higher turnover. Who's the typical renter profile here, and what's been the actual vacancy rate?
- Crime grade is F in this area — have there been break-ins, vandalism, or insurance claims at this property in the last 3 years? What carrier currently insures it and at what premium?
- The area grade is low — what's the realistic commute time and amenity access for the typical tenant pool here? Any planned neighborhood developments (good or bad) we should know about?
- What's the average days-on-market for RENTAL listings here right now (not sales)? A rising rental-DOM trend means longer vacancies and softer asking-rent achievability than the comps imply.
- What's the recent tenant-quality profile in this submarket — average credit score on applications, eviction rate, late-payment / NSF rate, and stable-employment percentage? A property-management company in the area should have these aggregated.
- How much new apartment / multifamily construction is in the pipeline within 1–3 miles? Heavy new supply (>2% of stock underway) typically softens rents 12–24 months out; light construction supports rent growth.
Investment metrics
- 1% rule
- 0.94% ✗
- Cap rate
- 5.27%
- Cash-on-cash
- -3.65%
- DSCR
- 0.84
- GRM
- 8.9
CMA / ARV
No comps found within radius.
Projected returns pro-forma
2.71% appreciation · 5.21% rent growth · sell at horizon
- IRR
- 4.6%
- Equity multiple
- 1.26×
- Total profit
- $9,179
- Equity at exit
- $54,200
- IRR
- 9.1%
- Equity multiple
- 2.40×
- Total profit
- $49,033
- Equity at exit
- $82,001
Cash invested: $35,000 (down + closing). Projections, not guarantees.
Landlord ↔ Tenant lean methodology
- Overall (STATE)
- 83 Strongly Landlord-Friendly
- State Oklahoma
- 83 Strongly Landlord-Friendly · R+20
- County
- — inherits STATE
- City
- — inherits STATE
ZIP-level market 73134
- Home prices YoY
- 1.2%
- Rents YoY
- 5.2%
- Active inventory
- 42
- Price-to-rent
- 8.9×
Monthly cashflow live
- Estimated rent
- $1,175 high interval (Pro) →
- Mortgage (P&I)
- −$656
- Tax from tax record
- −$100 /mo · $1,206/yr
- Insurance
- −$52
- HOA
- −$227
- Vacancy / Maint / Mgmt
- −$247
- Net cashflow
- $-107
Break-even live
UW: 25.0% down · 7.5% · 30yr · 1.5% tax · 5.0% vac · 8.0% maint · 8.0% mgmt
Financing live
Cash to close
- Down payment
- $31,250
- Closing costs
- $3,750
- Reserves months
- —
- Total cash needed
- —
Loan-product check · same deal, 3 products live
Conventional
25% down · 7.5% · 30yr
- Down + closing
- —
- Monthly P&I
- —
- Monthly cashflow
- —
- DSCR
- —
- Eligible?
- —
Personal DTI + credit; lowest rate.
DSCR
20% down · 8.5% · 30yr
- Down + closing
- —
- Monthly P&I
- —
- Monthly cashflow
- —
- DSCR
- —
- Eligible?
- —
No personal income docs; deal must DSCR.
Hard money
10% down · 12.0% · 12mo
- Down + closing
- —
- Monthly P&I
- —
- Monthly cashflow
- —
- DSCR
- —
- Eligible?
- —
Short-term bridge; refi at stabilization.
Rent comps 26 comps
| Address | Beds | Baths | Sqft | Rent | $/sqft | DOM | Units | Dist |
|---|---|---|---|---|---|---|---|---|
| 14327 N Pennsylvania Ave Unit 36G Oklahoma City, OK | 2.0 | 1.0 | 950 | $1,100 | $1.16 | 1d | 1 | 0.05mi |
| 2300 NW 145th St Oklahoma City, OK | 1.0–3.0 | 1.0–2.0 | 1000 | $1,615 | $1.61 | 1d | 12 | 0.10mi |
| 14443 N Pennsylvania Ave Oklahoma City, OK | 1.0 | 1.0 | 768 | $900 | $1.17 | 23d | 1 | 0.22mi |
| 2400 Watermark Blvd Oklahoma City, OK | 1.0 | 1.0 | 830 | $1,329 | $1.60 | 23d | 1 | 0.30mi |
| 14520 N Pennsylvania Ave Oklahoma City, OK | 1.0–3.0 | 1.0–2.0 | 1024 | $930 | $0.91 | 1d | 12 | 0.37mi |
| 14201 N Kentucky Ave Oklahoma City, OK | 1.0–2.0 | 1.0–2.0 | 905 | $1,628 | $1.80 | 1d | 18 | 0.37mi |
| 1919 NW 142nd St Oklahoma City, OK | 2.0 | 2.0 | 1100 | $1,280 | $1.16 | 23d | 1 | 0.38mi |
| 14320 Mezzaluna Ave Oklahoma City, OK | 1.0 | 1.0 | 966 | $1,429 | $1.48 | 23d | 1 | 0.40mi |
| 14320 Mezzaluna Ave Oklahoma City, OK | 1.0 | 1.0 | 879 | $1,329 | $1.51 | 11d | 1 | 0.40mi |
| 14900 N Pennsylvania Ave Oklahoma City, OK | 1.0–3.0 | 1.0–2.0 | 1027 | $1,010 | $0.98 | 1d | 19 | 0.44mi |
| 14712 Mezzaluna Blvd Oklahoma City, OK | 1.0–2.0 | 1.0–2.0 | 898 | $1,299 | $1.45 | 23d | 25 | 0.45mi |
| 14300 N Pennsylvania Ave Oklahoma City, OK | 1.0–2.0 | 1.0–2.0 | 844 | $799 | $0.95 | 1d | 1 | 0.50mi |
| 2600 Watermark Blvd Oklahoma City, OK | 1.0–2.0 | 1.0–2.5 | 1066 | $1,069 | $1.00 | 1d | 10 | 0.51mi |
| 2701 Watermark Blvd Oklahoma City, OK | 1.0–3.0 | 1.0–2.0 | 1047 | $1,161 | $1.11 | 1d | 19 | 0.61mi |
| 14300 N May Ave Oklahoma City, OK | 1.0–3.0 | 1.0–2.0 | 923 | $890 | $0.96 | 2d | 15 | 0.67mi |
| 14200 N May Ave Oklahoma City, OK | 1.0–3.0 | 1.0–2.0 | 1031 | $880 | $0.85 | 1d | 17 | 0.71mi |
| 15501 N Pennsylvania Ave Edmond, OK | 2.0 | 2.0 | 958 | $1,379 | $1.44 | 14d | 1 | 0.77mi |
| 2609 Featherstone Rd Oklahoma City, OK | 1.0–2.0 | 1.0–2.0 | 769 | $699 | $0.91 | 1d | 34 | 0.83mi |
| 13600 N Blackwelder Ave Oklahoma City, OK | 3.0 | 1.0–2.0 | 850 | $1,348 | $1.58 | 1d | 27 | 0.91mi |
| 12831 Stratford Dr Oklahoma City, OK | 1.0–3.0 | 1.0–2.0 | 1122 | $854 | $0.76 | 1d | 22 | 1.00mi |
| 12701 N Pennsylvania Ave Oklahoma City, OK | 3.0 | 1.0–2.0 | 912 | $1,122 | $1.23 | 1d | 15 | 1.04mi |
| 12821 Stratford Dr Oklahoma City, OK | 2.0 | 2.0 | 1043 | $1,078 | $1.03 | 1d | 1 | 1.14mi |
| 3101 NW 150th St Oklahoma City, OK | 1.0–2.0 | 1.0–2.0 | 811 | $895 | $1.10 | 1d | 12 | 1.19mi |
| 2301 NW 122nd St Oklahoma City, OK | 1.0 | 1.0 | 723 | $940 | $1.30 | 1d | 28 | 1.31mi |
| 2401 NW 122nd St Oklahoma City, OK | 1.0–2.0 | 1.0–2.0 | 844 | $749 | $0.89 | 23d | 1 | 1.34mi |
| 2700 Indian Creek Blvd Oklahoma City, OK | 1.0–3.0 | 1.0–2.0 | 1261 | $779 | $0.62 | 2d | 5 | 1.44mi |
HOA detail condo
- Monthly dues
- $227 · $2,724/yr
- Likely covers
- watercablepool
- Assessments
- None detected in remarks — confirm with the listing agent.
Listing history 2 events
-
2026-06-18remarks 699-char remark
-
2026-06-18$125,000 Active 1 DOM
ⓘ Source: listings_history table (triggers on properties + properties_extension) + one-shot
backfill from property_details.listing_events for pre-trigger history.
Tax reassessment forecast OK · Resets to sale price
- Current annual tax
- $1,206 · $100/mo
- Projected year-2 tax
- $1,206 · $100/mo
- Expected delta
- $0/yr ($0/mo · 0.0%)
ⓘ Screening estimate from a state-policy table — verify with the county assessor before closing.
Nearby sold comps map
Loading sold comps map…
Walkable amenities ~0.75 mi
Loading nearby amenities…
Taxation est. · year 1
- Rental income
- $14,104
- − Mortgage interest
- −$7,002
- − Property taxes
- −$1,206
- − Insurance
- −$625
- − Repairs & maintenance
- −$1,128
- − Management
- −$1,128
- − HOA
- −$2,724
- − Depreciation
- −$3,636
- Taxable loss
- −$3,346
- Est. tax savings @ 24.0%
- +$803
- After-tax cash flow
- $-476/yr
For passive investors: Depreciation is non-cash, so a rental often shows a tax loss while cash-flowing — sheltering income. Rental losses are passive: they offset passive income freely, and up to $25,000/yr can offset ordinary (W-2) income if you actively participate and your MAGI is under $100k (phasing out to $0 by $150k); unused losses carry forward. On sale, claimed depreciation is recaptured at up to 25%, and gains may owe capital-gains tax (a 1031 exchange can defer both). Figures are a year-1 estimate at your 24.0% rate — not tax advice; consult a CPA.
Schools (NCES district)
- District
- Edmond
- NCES district ID
- 4010590
- Math proficiency
- 38% ▼ -12.00%
- Reading proficiency
- 40% ▼ -12.00%
- Median HH income
- $73,212
- Composite
- 35.88/100
- National rank
- #4814
- State rank
- #11 of 270 in OK
Livability — Oklahoma City
- Score
- 80/100
- State rank
- #3
- US rank
- #1635
Category grades
Schools grade is shown separately in the Schools card above.
Census & demographics
- Census place
- Oklahoma City, OK
- County
- Oklahoma County · 771,644 people
- City population
- 498,656
- Metro
- Oklahoma City, OK
- Population (ZIP)
- 7,522
- Household income
- $66,307
- Rent vs Own
- Severe rent burden
- 934.0
Population outlook (Oklahoma County) Hauer SSP2
- Today (2025)
- 911,875 people
- By 2030
- 982,413 · +7.7%
- By 2040
- 1,130,468 · +24.0%
- By 2050
- 1,288,422 · +41.3%
- By 2075
- 1,711,482 · +87.7%
- By 2100
- 2,088,448 · +129.0%
Race, ethnicity, and origin ACS 2023
- Neighborhood character
- Diverse neighborhood (Simpson 0.69)
- Race & ethnicity
- White 49% Black 20% Hispanic / Latino 14% Two or more races 8% Asian 7% Native American 4%
- Hispanic origin (detail)
- Mexican 12%
- Common ancestry
- Iranian 2% Italian 2% Lithuanian 1%
- Foreign-born
- 10% · Canada, Vietnam
- Languages at home
- 86% English-only · Spanish 7% Other Indo-European 2% Vietnamese 2%
Political lean MEDSL · Oklahoma
- 2024 margin
- Toss-up / Even · D 48.0% · R 49.7% · Other 2.3%
- 2008→2024 swing
- +15.1pp toward D · 2008: -16.8pp · 2024: -1.7pp
- All cycles
- 2024: R+1.7 2020: R+1.1 2016: R+10.5 2012: R+16.7 2008: R+16.8
Not yet ingested
- Civics
- —
Market trends
- HPI YoY
- ▲ 2.71%
- Current HPI
- 219.5373
- Rent YoY
- ▲ 5.21%
- Metro
- Oklahoma City, OK
- State GDP YoY
- ▲ 1.55%
- F500 in state
- 6
Industry mix (Fortune 500 HQ in OK)
| Industry | F500 HQs | Revenue |
|---|---|---|
| Energy | 3 | $48B |
|
||
Price history
+184.1% since first listed6 events — show timeline
- 2026-06-18 Listed $125,000 MLSOK
- 2015-08-07 Sold (MLS) $65,000 MLSOK
- 2015-07-22 Pending — MLSOK
- 2015-05-29 Listed $69,900 MLSOK
- 2010-05-19 Sold (Public Records) $58,000 Public Records
- 2003-09-23 Sold (Public Records) $44,000 Public Records
Property tax history
+4.3%/yrLatest (2025): $1,206 · +5.3% YoY. Source: county tax records.
Cash-flow waterfall
monthlySold comps — $/sqft
last 12 mo · ≤1 miLoading sold comps…