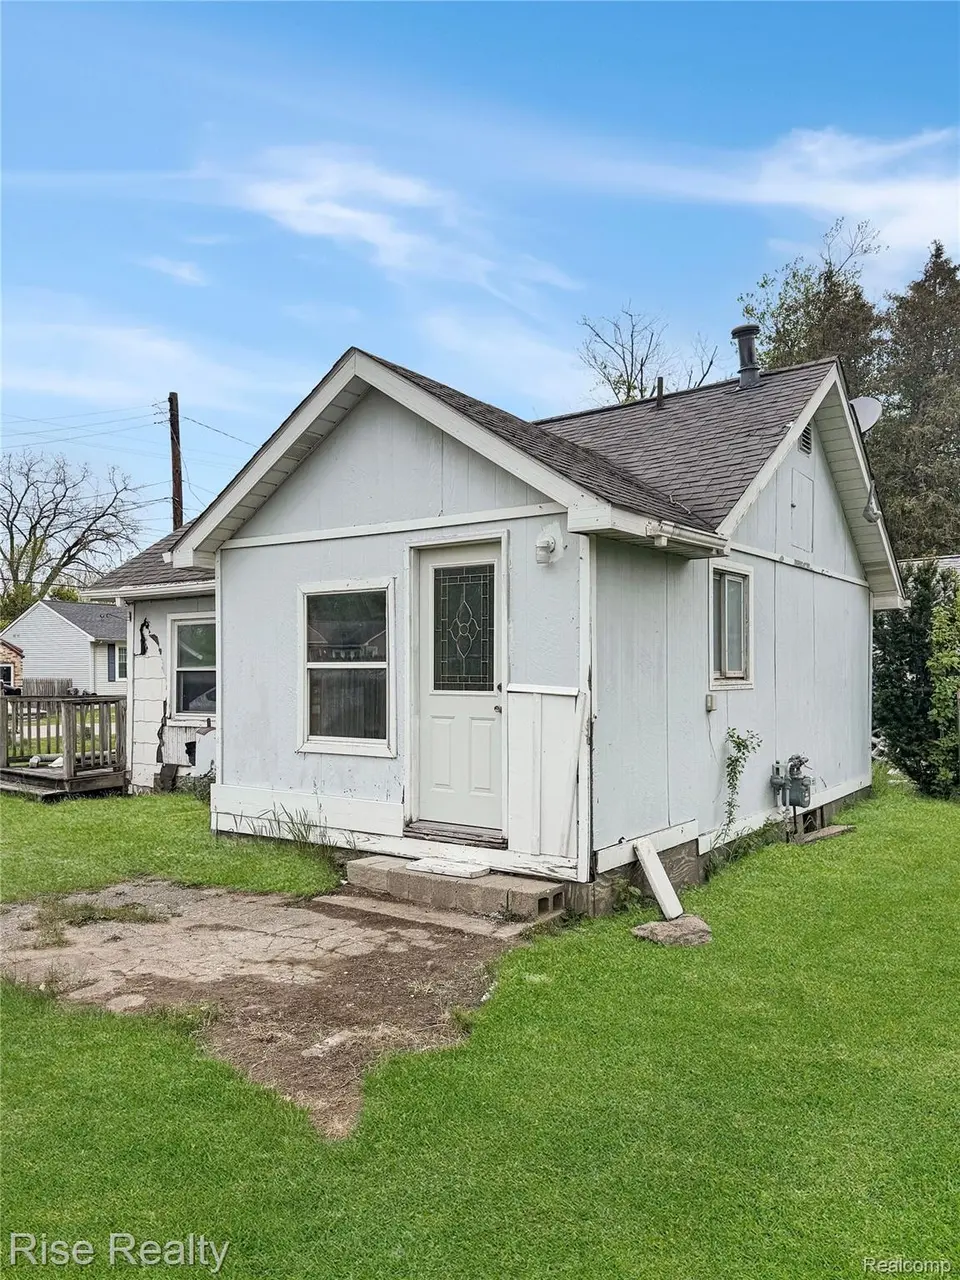
4065 Pringle Ave · Burton, MI
Flood risk 1/10 · Minimal
- FEMA flood zone
- X (unshaded)
- Chance of flooding over 30 yrs
- 0.0%
- Est. flood insurance / yr
- $507 – $1,088
Fire risk 1/10 · Minimal
- Est. fire insurance / yr
- $784 – $1,456
Heat risk 2/10 · Minimal
- Hot days now (above 96°F)
- 7 days/yr
- Hot days in 30 yrs
- 15 days/yr
Wind risk 2/10 · Minimal
- Chance of severe wind over 30 yrs
- —
Air-quality risk 3/10 · Minor
- Unhealthy air days now
- 3 days/yr
- Unhealthy air days in 30 yrs
- 4 days/yr
Risk factors via First Street. Map © Google.
Why this score? — see what drove the B grade
The composite is a weighted blend of 9 inputs, each scored 0–100. Each bar is that input's sub-score; the figure is the points it added to the 100-point composite (weight × sub-score).
- Cash flow +30.0/30.0
- ARV discount +15.0/15.0
- 1% rule +10.0/10.0
- DSCR +10.0/10.0
- Livability +3.1/5.0
- Rent growth +2.5/5.0
- Condition / age +2.5/5.0
- Schools +1.4/10.0
- Appreciation +0.0/10.0
$29,500
🖨 Deal sheet 📄 Offer letter ✓ Due diligence
Listing remarks MLS
Investor special! Room for sweat equity, fix and flip or make an affordable rental. In great location close to schools on a quiet paved street. Has brand new electrical meter connection, and gas line/meter connection to the home.
Key facts
- Great location
- Quiet paved street
- 6,098 sq ft lot
Tags
Property features AI
Exterior
- Parking: No garage
- Utilities: Public water; Public sewer
- Home design: Single-family residence; One story; Ground-level entry with steps; Wood siding
- Construction: Asphalt roof; Block foundation; Built with wood siding
- Exterior features: Paved road access
Interior
- Bathrooms: 1 full bathroom
- Heating & cooling: Forced air heating (natural gas); No cooling
- Interior features: Crawl space basement; 4 total rooms
Neighborhood map
What this means for you Summary
Snapshot
- This is a 1-bed/1.0-bath single-family listed at $30k.
Deal economics
- At list price, monthly cash flow is $428 ($5k/yr) — positive.
- The deal already cash-flows at list — no discount required.
- Meets the 1% rule at list price ($800 rent vs $30k).
- Cap rate 23.7% vs local median 3.8% in Burton — top-decile yield for the area; either an underpriced asset or a hidden risk that comps aren't pricing in. Stress-test before assuming the spread holds.
Location & tenants
- Location reads 61/100 on livability (#555 in MI) — a middle-class / working-renter tenant base. Strengths: cost of living A+, housing A+; Watch: employment D, schools F, crime F.
- Bendle Public Schools (suburban): math 6% / reading 29% proficiency, ranked #487 of 540 in MI (top 90%) — low school quality limits family demand, transient renter base, plan for 1-2y turnover; 81% free/reduced lunch — lower-income household profile, screen leases tightly.
- Market conditions: 53 active listings in the ZIP; 1 comparable units currently listed for rent nearby; 419 units permitted in Genesee County in 2024 (68 in 5+ unit buildings).
Forward outlook
- Local home prices are declining (-3.0%/yr); year-one equity from $204 of loan paydown is wiped out by about $885 of value loss. Plan a longer hold.
- Genesee County population projected at -27% by 2050 — secular population decline; favor cash flow + early exit over multi-decade hold.
- At projected returns (-3.0% appreciation + 3.0% rent growth), your $8k cash investment doubles in ~2 years — after that, you're playing with house money.
Negotiation context
- Only 5 days on market — expect competitive offers; lowballing is unlikely to land.
- 6 sale attempts since 25y ago with the ask held roughly flat each time — persistent listings suggest the price (not the market) is what's stuck; bring a comps-based counter.
- Current owner paid $25k; 18% above their basis — modest negotiation headroom, anchor on the comps not their cost.
Risks & watch-outs
- Watch-outs: built in 1950 — expect roof / HVAC / electrical / plumbing capex.
Questions for the listing agent
- Built in 1950 — when were the roof, HVAC, electrical panel, plumbing, and water heater last replaced?
- Is there a deadline driving the sale (1031 exchange, divorce, estate, relocation)? That informs how much negotiation room exists.
- Schools are F-rated, which usually means shorter tenancies and higher turnover. Who's the typical renter profile here, and what's been the actual vacancy rate?
- Crime grade is F in this area — have there been break-ins, vandalism, or insurance claims at this property in the last 3 years? What carrier currently insures it and at what premium?
- What's the average days-on-market for RENTAL listings here right now (not sales)? A rising rental-DOM trend means longer vacancies and softer asking-rent achievability than the comps imply.
- What's the recent tenant-quality profile in this submarket — average credit score on applications, eviction rate, late-payment / NSF rate, and stable-employment percentage? A property-management company in the area should have these aggregated.
- How much new for-sale + rental construction is in the pipeline within 1–3 miles? Heavy new supply typically softens prices + rents 12–24 months out; constrained supply supports both.
Investment metrics
- 1% rule
- 2.71% ✓
- Cap rate
- 23.71%
- Cash-on-cash
- 62.20%
- DSCR
- 3.77
- GRM
- 3.1
CMA / ARV
- ARV (on-the-fly)
- $45,864
- Comps found
- 11
Show comp detail 11 sales within ~0.75 mi
| Address | Dist | Beds/Ba | Sqft | Sold | Price | $/sf | Match |
|---|---|---|---|---|---|---|---|
| 4065 Pringle Ave | 0.00mi | 1/1.0 | 504 (0%) | 0mo | $26,000 | $52 | 100 |
| 4065 Pringle Ave | 0.00mi | 1/1.0 | 504 (0%) | 13mo | $25,000 | $50 | 89 |
| 2207 E Boatfield Ave | 0.28mi | 2/1.0 (+1) | 528 (+5%) | 5mo | $75,000 | $142 | 70 |
| 2172 E Buder Ave | 0.39mi | 2/1.0 (+1) | 520 (+3%) | 14mo | $44,900 | $86 | 60 |
| 2117 E Buder Ave | 0.48mi | 2/1.0 (+1) | 528 (+5%) | 10mo | $48,000 | $91 | 57 |
| 2156 E Parkwood Ave | 0.38mi | 2/1.0 (+1) | 572 (+14%) | 3mo | $68,000 | $119 | 52 |
| 2143 E Scottwood Ave | 0.41mi | 2/1.0 (+1) | 572 (+14%) | 20mo | $80,000 | $140 | 37 |
| 2176 Red Arrow Rd | 0.64mi | 2/1.0 (+1) | 529 (+5%) | 24mo | $47,500 | $90 | 37 |
| 2116 Webber Ave | 0.63mi | 1/1.0 | 440 (-13%) | 16mo | $23,000 | $52 | 36 |
| 2188 E Buder Ave | 0.36mi | 2/1.0 (+1) | 576 (+14%) | 23mo | $83,000 | $144 | 35 |
| 2157 E Williamson Ave | 0.49mi | 2/1.0 (+1) | 575 (+14%) | 24mo | $75,000 | $130 | 29 |
Match score weights: distance 35% · size 25% · config 20% · recency 20%. Top-matched comps best support the ARV.
Projected returns pro-forma
-3.0% appreciation · 3.0% rent growth · sell at horizon
- IRR
- 61.1%
- Equity multiple
- 3.72×
- Total profit
- $22,500
- Equity at exit
- $4,399
- IRR
- 65.7%
- Equity multiple
- 7.63×
- Total profit
- $54,753
- Equity at exit
- $2,551
Cash invested: $8,260 (down + closing). Projections, not guarantees.
Landlord ↔ Tenant lean methodology
- Overall (STATE)
- 62 Landlord-Friendly
- State Michigan
- 62 Landlord-Friendly · EVEN
- County
- — inherits STATE
- City
- — inherits STATE
ZIP-level market 48529
- Home prices YoY
- -26.5%
- Active inventory
- 53
- Price-to-rent
- 3.1×
Monthly cashflow live
- Estimated rent
- $800 medium interval (Pro) →
- Mortgage (P&I)
- −$155
- Tax est. 1.5%
- −$37 /mo · $442/yr
- Insurance
- −$12
- HOA
- −$0
- Vacancy / Maint / Mgmt
- −$168
- Net cashflow
- $428
Break-even live
UW: 25.0% down · 7.5% · 30yr · 1.5% tax · 5.0% vac · 8.0% maint · 8.0% mgmt
Financing live
Cash to close
- Down payment
- $7,375
- Closing costs
- $885
- Reserves months
- —
- Total cash needed
- —
Loan-product check · same deal, 3 products live
Conventional
25% down · 7.5% · 30yr
- Down + closing
- —
- Monthly P&I
- —
- Monthly cashflow
- —
- DSCR
- —
- Eligible?
- —
Personal DTI + credit; lowest rate.
DSCR
20% down · 8.5% · 30yr
- Down + closing
- —
- Monthly P&I
- —
- Monthly cashflow
- —
- DSCR
- —
- Eligible?
- —
No personal income docs; deal must DSCR.
Hard money
10% down · 12.0% · 12mo
- Down + closing
- —
- Monthly P&I
- —
- Monthly cashflow
- —
- DSCR
- —
- Eligible?
- —
Short-term bridge; refi at stabilization.
Rent comps 1 comps
| Address | Beds | Baths | Sqft | Rent | $/sqft | DOM | Units | Dist |
|---|---|---|---|---|---|---|---|---|
| 2266 Donovan St Burton, MI | 2.0 | 1.0 | 700 | $800 | $1.14 | 13d | 1 | 0.34mi |
Listing history 16 events
-
2026-05-18$29,500 Active
Show marketing remark (229 chars)
Investor special! Room for sweat equity, fix and flip or make an affordable rental. In great location close to schools on a quiet paved street. Has brand new electrical meter connection, and gas line/meter connection to the home.
-
2026-05-18$29,500 Active 229-char remark
Show marketing remark (229 chars)
Investor special! Room for sweat equity, fix and flip or make an affordable rental. In great location close to schools on a quiet paved street. Has brand new electrical meter connection, and gas line/meter connection to the home.
-
2025-05-07soldstatus $25,000 Closed 348-char remark
Show marketing remark (348 chars)
Bring your tool belt and creativity! This Bendle ranch handyman special is a great opportunity with tons of equity on day one! This home is situated on a great lot within walking distance to Bendle Schools and features a large bedroom, large kitchen & family room, and shed. Don't miss out on the excellent investment opportunity that awaits!
-
2025-05-07soldstatus $25,000 Closed
Show marketing remark (348 chars)
Bring your tool belt and creativity! This Bendle ranch handyman special is a great opportunity with tons of equity on day one! This home is situated on a great lot within walking distance to Bendle Schools and features a large bedroom, large kitchen & family room, and shed. Don't miss out on the excellent investment opportunity that awaits!
-
2025-04-30historical Active Under Contract
Show marketing remark (348 chars)
Bring your tool belt and creativity! This Bendle ranch handyman special is a great opportunity with tons of equity on day one! This home is situated on a great lot within walking distance to Bendle Schools and features a large bedroom, large kitchen & family room, and shed. Don't miss out on the excellent investment opportunity that awaits!
-
2025-04-30historical Accepting Backup Offers 348-char remark
Show marketing remark (348 chars)
Bring your tool belt and creativity! This Bendle ranch handyman special is a great opportunity with tons of equity on day one! This home is situated on a great lot within walking distance to Bendle Schools and features a large bedroom, large kitchen & family room, and shed. Don't miss out on the excellent investment opportunity that awaits!
-
2025-02-04price $27,000 348-char remark
Show marketing remark (348 chars)
Bring your tool belt and creativity! This Bendle ranch handyman special is a great opportunity with tons of equity on day one! This home is situated on a great lot within walking distance to Bendle Schools and features a large bedroom, large kitchen & family room, and shed. Don't miss out on the excellent investment opportunity that awaits!
-
2025-02-03price $27,000
-
2025-01-18$30,000 Active
-
2025-01-17$30,000 Active 348-char remark
Show marketing remark (348 chars)
Bring your tool belt and creativity! This Bendle ranch handyman special is a great opportunity with tons of equity on day one! This home is situated on a great lot within walking distance to Bendle Schools and features a large bedroom, large kitchen & family room, and shed. Don't miss out on the excellent investment opportunity that awaits!
-
2001-07-10soldstatus $35,000
-
2001-06-20soldstatus $37,000
-
2001-06-20soldstatus $37,000
-
2001-06-06historical
-
2001-05-22$38,500
-
2001-05-22$38,500
ⓘ Source: listings_history table (triggers on properties + properties_extension) + one-shot
backfill from property_details.listing_events for pre-trigger history.
Climate risk First Street
- Flood 1/10 Low FEMA zone X (unshaded) · 0% chance over 30 yrs
- Wildfire 1/10 Low
- Heat 2/10 Low 7 d/yr ≥96°F today · 15 d/yr by 30 yrs out
- Wind 2/10 Low
- Air quality 3/10 Moderate 3 unhealthy d/yr today · 4 by 30 yrs out
Nearby sold comps map
Loading sold comps map…
Walkable amenities ~0.75 mi
Loading nearby amenities…
Taxation est. · year 1
- Rental income
- $9,600
- − Mortgage interest
- −$1,652
- − Property taxes
- −$442
- − Insurance
- −$148
- − Repairs & maintenance
- −$768
- − Management
- −$768
- − Depreciation
- −$858
- Taxable income
- $4,963
- Est. tax owed @ 24.0%
- −$1,191
- After-tax cash flow
- $3,946/yr
For passive investors: Depreciation is non-cash, so a rental often shows a tax loss while cash-flowing — sheltering income. Rental losses are passive: they offset passive income freely, and up to $25,000/yr can offset ordinary (W-2) income if you actively participate and your MAGI is under $100k (phasing out to $0 by $150k); unused losses carry forward. On sale, claimed depreciation is recaptured at up to 25%, and gains may owe capital-gains tax (a 1031 exchange can defer both). Figures are a year-1 estimate at your 24.0% rate — not tax advice; consult a CPA.
Schools (NCES district)
- District
- Bendle Public Schools
- NCES district ID
- 2604740
- Math proficiency
- 6% ▼ -7.00%
- Reading proficiency
- 29% ▼ -1.00%
- Median HH income
- $35,492
- Composite
- 14.36/100
- National rank
- #9438
- State rank
- #487 of 540 in MI
Livability — Burton
- Score
- 61/100
- State rank
- #555
- US rank
- #17380
Category grades
Schools grade is shown separately in the Schools card above.
Census & demographics
- Census place
- Burton, MI
- City population
- 26,014
- Population (ZIP)
- 8,959
Population outlook (Genesee County) Hauer SSP2
- Today (2025)
- 381,312 people
- By 2030
- 362,731 · -4.9%
- By 2040
- 321,550 · -15.7%
- By 2050
- 279,212 · -26.8%
- By 2075
- 193,336 · -49.3%
- By 2100
- 128,118 · -66.4%
Race, ethnicity, and origin ACS 2023
- Neighborhood character
- Predominantly White (82%)
- Race & ethnicity
- White 82% Black 9% Hispanic / Latino 6% Two or more races 4%
- Hispanic origin (detail)
- Mexican 6%
- Common ancestry
- Romanian 6% Lithuanian 4% Slovak 4%
- Foreign-born
- 1% · Canada
- Languages at home
- 99% English-only · Spanish 1%
Political lean MEDSL · Genesee
- 2024 margin
- Toss-up / Even · D 51.4% · R 47.2% · Other 1.4%
- 2008→2024 swing
- -28.3pp toward R · 2008: 32.5pp · 2024: 4.2pp
- All cycles
- 2024: D+4.2 2020: D+9.3 2016: D+9.5 2012: D+28.2 2008: D+32.5
Not yet ingested
- Civics
- —
Market trends
- HPI YoY
- ▼ -82.30%
- Current HPI
- 228.5338
- Rent YoY
- —
- Metro
- —
- State GDP YoY
- ▲ 1.37%
- F500 in state
- 28
Industry mix (Fortune 500 HQ in MI)
| Industry | F500 HQs | Revenue |
|---|---|---|
| Automotive Parts | 3 | $48B |
|
||
| Automotive | 2 | $372B |
|
||
| Chemicals | 1 | $45B |
|
||
| Automotive Retail | 1 | $29B |
|
||
| Healthcare / Medical Devices | 1 | $23B |
|
||
| Automotive Technology | 1 | $20B |
|
||
Price history
-23.4% since first listed16 events — show timeline
- 2026-05-18 Listed $29,500 REALCOMP
- 2026-05-18 Listed $29,500 MiRealSource-MiMLS
- 2025-05-07 Sold (MLS) $25,000 REALCOMP
- 2025-05-07 Sold (MLS) $25,000 MiRealSource-MiMLS
- 2025-04-30 Contingent — REALCOMP
- 2025-04-30 Contingent — MiRealSource-MiMLS
- 2025-02-04 Price Changed $27,000 MiRealSource-MiMLS
- 2025-02-03 Price Changed $27,000 REALCOMP
- 2025-01-18 Listed $30,000 REALCOMP
- 2025-01-17 Listed $30,000 MiRealSource-MiMLS
- 2001-07-10 Sold (Public Records) $35,000 Public Records
- 2001-06-20 Sold (MLS) $37,000 MiRealSource-MiMLS
- 2001-06-20 Sold (MLS) $37,000 REALCOMP
- 2001-06-06 Listing Removed — MiRealSource-MiMLS
- 2001-05-22 Listed $38,500 MiRealSource-MiMLS
- 2001-05-22 Listed $38,500 REALCOMP
Property tax history
+10.2%/yrLatest (2025): $2,204 · +32.6% YoY. Source: county tax records.
Cash-flow waterfall
monthlySold comps — $/sqft
last 12 mo · ≤1 miLoading sold comps…