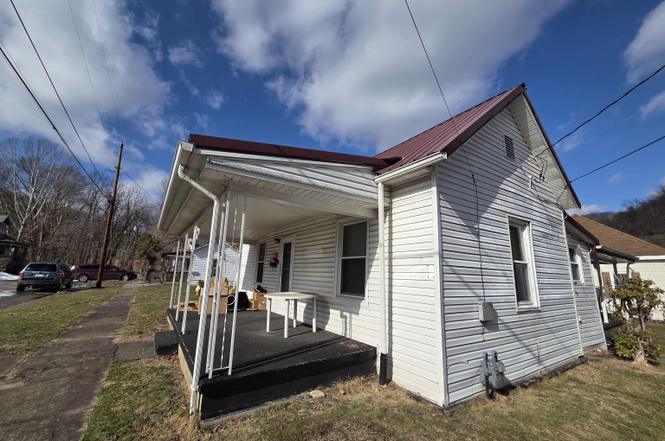
204-208 W 7th St · Weston, WV
Flood risk 9/10 · Severe
- FEMA flood zone
- X (unshaded)
- Chance of flooding over 30 yrs
- 0.99%
- Est. flood insurance / yr
- $507 – $1,088
Fire risk 3/10 · Minor
- Est. fire insurance / yr
- $787 – $1,461
Heat risk 4/10 · Minor
- Hot days now (above 100°F)
- 7 days/yr
- Hot days in 30 yrs
- 19 days/yr
Wind risk 1/10 · Minimal
- Chance of severe wind over 30 yrs
- 1.0%
Air-quality risk 2/10 · Minimal
- Unhealthy air days now
- 0 days/yr
- Unhealthy air days in 30 yrs
- 1 days/yr
Risk factors via First Street. Map © Google.
Why this score? — see what drove the B grade
The composite is a weighted blend of 9 inputs, each scored 0–100. Each bar is that input's sub-score; the figure is the points it added to the 100-point composite (weight × sub-score).
- Cash flow +25.6/30.0
- ARV discount +15.0/15.0
- DSCR +8.5/10.0
- 1% rule +6.8/10.0
- Appreciation +5.6/10.0
- Livability +3.7/5.0
- Rent growth +2.5/5.0
- Condition / age +2.5/5.0
- Schools +1.9/10.0
$85,000
🖨 Deal sheet 📄 Offer letter ✓ Due diligence
Listing remarks
Opportunity is knocking! This one-level living fixer-upper offers great space and endless potential for the buyer ready to bring their vision to life. With a functional layout and generously sized rooms, this home is the perfect canvas to create the style and finishes you?ve always wanted. Located within city limits and just a short stroll to local shops, dining, and everyday conveniences, you?ll love the accessibility and neighborhood charm. Outside, you?ll find a detached garage providing additional storage or workshop space, plus an extra lot offering room to expand the home?s footprint, build, or create the outdoor oasis of your dreams. A brand-new metal roof adds value and peace of min
Key facts
- Extra lot
- One-level living
- Brand-new metal roof
Tags
Property features AI
Exterior
- Parking: Detached 1-car garage
- Security: Smoke detector(s)
- Utilities: Public water; Public sewer
- Home design: Single-family detached residence; Single-story
- Construction: Block, frame and vinyl siding construction; Metal roof; Built with crawl space foundation
- Exterior features: Patio; Porch; Cleared lot; Corner lot; Has a view; Smoke detector(s)
Interior
- Kitchen: Refrigerator; Range
- Flooring: Vinyl flooring
- Bathrooms: 1 full bathroom
- Heating & cooling: Electric heating; Window air conditioning unit(s)
- Interior features: Refrigerator; Range; Vinyl flooring; Crawl space
Neighborhood map
What this means for you Summary
Snapshot
- This is a 3-bed/1.0-bath single-family listed at $85k.
Deal economics
- At list price, monthly cash flow is $135 ($2k/yr) — positive.
- The deal already cash-flows at list — no discount required.
- Meets the 1% rule at list price ($999 rent vs $85k).
- Recommended offer: $77k (9.0% below list) — sets the bar for market timing.
- Cap rate 9.1% vs local median 4.2% in Weston — top-decile yield for the area; either an underpriced asset or a hidden risk that comps aren't pricing in. Stress-test before assuming the spread holds.
Location & tenants
- Location reads 73/100 on livability (#38 in WV) — a middle-class / working-renter tenant base. Strengths: cost of living A+, housing A+, health & safety A+; Watch: amenities D-, commute F, employment F.
- Lewis County Schools (rural): math 19% / reading 27% proficiency, ranked #53 of 55 in WV (top 96%) — low school quality limits family demand, transient renter base, plan for 1-2y turnover.
- Zoned schools: Jane Lew Elementary School (math 27% / reading 27%, grade F, #261 of 377 statewide, top 75%, 244 students, 0% FRL); Robert L. Bland Middle School (math 16% / reading 28%, grade F, #95 of 109 statewide, top 88%, 658 students, 0% FRL); Lewis County High School (math 12% / reading 37%, grade F, #91 of 110 statewide, top 85%, 756 students, 0% FRL) — zoned schools average 0% FRL vs 50% district-wide (50 pts lower); this property's tenant base skews higher-income than the district average.
- Market conditions: 37 active listings in the ZIP.
Forward outlook
- In year one you build about $2k of equity ($588 loan paydown + $996 appreciation (1.2% local appreciation)).
- Lewis County population projected to shrink 5% by 2050 — rents likely to lag national; underwrite the cash flow, not the appreciation.
- At projected returns (1.2% appreciation + 3.0% rent growth), your $24k cash investment doubles in ~7 years — after that, you're playing with house money.
Negotiation context
- It's been on market 111 days — a 9% lower offer ($77k) is reasonable based on typical stale-listing flexibility.
Risks & watch-outs
- Watch-outs: flood insurance adds $66/mo; built in 1860 — expect roof / HVAC / electrical / plumbing capex.
- Climate carrying-cost: severe flood risk — expect insurance premiums to compound above CPI over the hold.
Questions for the listing agent
- It's been on market 111 days. Have you received any prior offers? Is the seller open to a 9% concession, seller financing, or rate buy-down credit?
- Built in 1860 — when were the roof, HVAC, electrical panel, plumbing, and water heater last replaced?
- What's the actual annual flood-insurance premium (NFIP or private), and is the property in a SFHA with mandatory coverage?
- Why hasn't it sold? Are there any deal-killer items the seller is aware of (foundation, flood, title, zoning, code violations)?
- Is there a deadline driving the sale (1031 exchange, divorce, estate, relocation)? That informs how much negotiation room exists.
- Schools are D-rated, which usually means shorter tenancies and higher turnover. Who's the typical renter profile here, and what's been the actual vacancy rate?
- What's the average days-on-market for RENTAL listings here right now (not sales)? A rising rental-DOM trend means longer vacancies and softer asking-rent achievability than the comps imply.
- What's the recent tenant-quality profile in this submarket — average credit score on applications, eviction rate, late-payment / NSF rate, and stable-employment percentage? A property-management company in the area should have these aggregated.
- How much new for-sale + rental construction is in the pipeline within 1–3 miles? Heavy new supply typically softens prices + rents 12–24 months out; constrained supply supports both.
Investment metrics
- 1% rule
- 1.18% ✓
- Cap rate
- 9.14%
- Cash-on-cash
- 10.17%
- DSCR
- 1.45
- GRM
- 7.1
CMA / ARV
- ARV (on-the-fly)
- $128,364
- Comps found
- 12
Show comp detail 12 sales within ~0.75 mi
| Address | Dist | Beds/Ba | Sqft | Sold | Price | $/sf | Match |
|---|---|---|---|---|---|---|---|
| 147 E 6th St | 0.17mi | 3/1.0 | 1,183 (+5%) | 10mo | $90,000 | $76 | 75 |
| 119 E 3rd St | 0.34mi | 3/1.5 | 1,196 (+6%) | 3mo | $136,820 | $114 | 69 |
| 19 Forinash Rd | 0.73mi | 3/1.0 | 1,092 (-3%) | 1mo | $150,000 | $137 | 60 |
| 232 Wilson St | 0.74mi | 3/1.0 | 1,080 (-4%) | 1mo | $85,000 | $79 | 58 |
| 249 Main Ave | 0.38mi | 3/2.5 | 1,028 (-9%) | 6mo | $68,000 | $66 | 57 |
| 842 Cemetery St | 0.32mi | 3/1.5 | 1,248 (+11%) | 16mo | $238,000 | $191 | 52 |
| 131 Mcgary Ave | 0.53mi | 2/1.0 (-1) | 1,113 (-1%) | 22mo | $37,500 | $34 | 50 |
| 156 Montgomery Rd | 0.31mi | 3/2.0 | 1,260 (+12%) | 14mo | $219,000 | $174 | 50 |
| 344 1/2 E 7th St | 0.39mi | 2/1.0 (-1) | 1,248 (+11%) | 14mo | $145,000 | $116 | 47 |
| 650 Locust Ave | 0.43mi | 2/2.0 (-1) | 1,284 (+14%) | 5mo | $55,000 | $43 | 44 |
| 350 Center Ave | 0.30mi | 2/1.0 (-1) | 960 (-15%) | 23mo | $112,500 | $117 | 38 |
| 506 Broad St | 0.72mi | 2/1.5 (-1) | 980 (-13%) | 8mo | $110,000 | $112 | 31 |
Match score weights: distance 35% · size 25% · config 20% · recency 20%. Top-matched comps best support the ARV.
Projected returns pro-forma
1.17% appreciation · 3.0% rent growth · sell at horizon
- IRR
- 9.0%
- Equity multiple
- 1.46×
- Total profit
- $10,975
- Equity at exit
- $29,780
- IRR
- 12.8%
- Equity multiple
- 2.59×
- Total profit
- $37,726
- Equity at exit
- $40,170
Cash invested: $23,800 (down + closing). Projections, not guarantees.
Landlord ↔ Tenant lean methodology
- Overall (STATE)
- 83 Strongly Landlord-Friendly
- State West Virginia
- 83 Strongly Landlord-Friendly · R+22
- County
- — inherits STATE
- City
- — inherits STATE
ZIP-level market 26452
- Home prices YoY
- 0.8%
- Active inventory
- 37
- Price-to-rent
- 7.1×
Monthly cashflow live
- Estimated rent
- $999 medium interval (Pro) →
- Mortgage (P&I)
- −$446
- Tax est. 1.5%
- −$106 /mo · $1,275/yr
- Insurance
- −$35
- Flood insurance flood zone
- −$66 /mo · $798/yr
- HOA
- −$0
- Vacancy / Maint / Mgmt
- −$210
- Net cashflow
- $135
Break-even live
UW: 25.0% down · 7.5% · 30yr · 1.5% tax · 5.0% vac · 8.0% maint · 8.0% mgmt
Financing live
Cash to close
- Down payment
- $21,250
- Closing costs
- $2,550
- Reserves months
- —
- Total cash needed
- —
Loan-product check · same deal, 3 products live
Conventional
25% down · 7.5% · 30yr
- Down + closing
- —
- Monthly P&I
- —
- Monthly cashflow
- —
- DSCR
- —
- Eligible?
- —
Personal DTI + credit; lowest rate.
DSCR
20% down · 8.5% · 30yr
- Down + closing
- —
- Monthly P&I
- —
- Monthly cashflow
- —
- DSCR
- —
- Eligible?
- —
No personal income docs; deal must DSCR.
Hard money
10% down · 12.0% · 12mo
- Down + closing
- —
- Monthly P&I
- —
- Monthly cashflow
- —
- DSCR
- —
- Eligible?
- —
Short-term bridge; refi at stabilization.
Listing history 18 events
-
2026-06-18days on market $85,000 Active 111 DOM
-
2026-06-17days on market $85,000 Active 110 DOM
-
2026-06-16days on market $85,000 Active 109 DOM
-
2026-06-15days on market $85,000 Active 108 DOM
-
2026-06-15days on market $85,000 Active 107 DOM
-
2026-06-13days on market $85,000 Active 106 DOM
-
2026-06-12days on market $85,000 Active 105 DOM
-
2026-06-09days on market $85,000 Active 102 DOM
-
2026-06-08days on market $85,000 Active 101 DOM
-
2026-06-08days on market $85,000 Active 100 DOM
-
2026-06-07days on market $85,000 Active 99 DOM
-
2026-06-04days on market $85,000 Active 97 DOM
-
2026-06-03days on market $85,000 Active 96 DOM
-
2026-06-02days on market $85,000 Active 95 DOM
-
2026-06-01days on market $85,000 Active 94 DOM
-
2026-05-31days on market $85,000 Active 93 DOM
-
2026-04-29price $85,000
-
2026-02-27$95,000 Active
ⓘ Source: listings_history table (triggers on properties + properties_extension) + one-shot
backfill from property_details.listing_events for pre-trigger history.
Climate risk First Street
- Flood 9/10 Extreme FEMA zone X (unshaded) · 99% chance over 30 yrs
- Wildfire 3/10 Moderate
- Heat 4/10 Moderate 7 d/yr ≥100°F today · 19 d/yr by 30 yrs out
- Wind 1/10 Low 100% chance of damaging wind over 30 yrs
- Air quality 2/10 Low 0 unhealthy d/yr today · 1 by 30 yrs out
Nearby sold comps map
Loading sold comps map…
Walkable amenities ~0.75 mi
Loading nearby amenities…
Taxation est. · year 1
- Rental income
- $11,987
- − Mortgage interest
- −$4,761
- − Property taxes
- −$1,275
- − Insurance
- −$1,222
- − Repairs & maintenance
- −$959
- − Management
- −$959
- − Depreciation
- −$2,473
- Taxable income
- $337
- Est. tax owed @ 24.0%
- −$81
- After-tax cash flow
- $1,542/yr
For passive investors: Depreciation is non-cash, so a rental often shows a tax loss while cash-flowing — sheltering income. Rental losses are passive: they offset passive income freely, and up to $25,000/yr can offset ordinary (W-2) income if you actively participate and your MAGI is under $100k (phasing out to $0 by $150k); unused losses carry forward. On sale, claimed depreciation is recaptured at up to 25%, and gains may owe capital-gains tax (a 1031 exchange can defer both). Figures are a year-1 estimate at your 24.0% rate — not tax advice; consult a CPA.
Schools (NCES district)
- District
- Lewis County Schools
- NCES district ID
- 5400630
- Math proficiency
- 19% ▼ -12.00%
- Reading proficiency
- 27% ▼ -8.00%
- Median HH income
- $36,146
- Composite
- 19.05/100
- National rank
- #8843
- State rank
- #53 of 55 in WV
Livability — Weston
- Score
- 73/100
- State rank
- #38
- US rank
- #5368
Category grades
Schools grade is shown separately in the Schools card above.
Census & demographics
- Census place
- Weston, WV
- Population (ZIP)
- 9,374
Population outlook (Lewis County) Hauer SSP2
- Today (2025)
- 16,382 people
- By 2030
- 16,293 · -0.5%
- By 2040
- 15,999 · -2.3%
- By 2050
- 15,569 · -5.0%
- By 2075
- 14,450 · -11.8%
- By 2100
- 12,164 · -25.7%
Race, ethnicity, and origin ACS 2023
- Neighborhood character
- Predominantly White (92%)
- Race & ethnicity
- White 92% Two or more races 6% Hispanic / Latino 2%
- Common ancestry
- Serbian 1% Iranian 1% Italian 1%
- Foreign-born
- 1% · Canada
- Languages at home
- 98% English-only · Spanish 1%
Political lean MEDSL · Lewis
- 2024 margin
- Solid R (+59.3) · D 19.5% · R 78.8% · Other 1.8%
- 2008→2024 swing
- -25.6pp toward R · 2008: -33.7pp · 2024: -59.3pp
- All cycles
- 2024: R+59.3 2020: R+56.9 2016: R+56.8 2012: R+42.1 2008: R+33.7
Not yet ingested
- Civics
- —
Market trends
- HPI YoY
- ▲ 1.17%
- Current HPI
- 144.3377
- Rent YoY
- —
- Metro
- —
- State GDP YoY
- —
- F500 in state
- 0
Price history
-10.5% since first listed2 events — show timeline
- 2026-04-29 Price Changed $85,000 NCWVREIN
- 2026-02-27 Listed $95,000 NCWVREIN
Property tax history
+32.4%/yrLatest (2025): $66 · +17.0% YoY. Source: county tax records.
Cash-flow waterfall
monthlySold comps — $/sqft
last 12 mo · ≤1 miLoading sold comps…