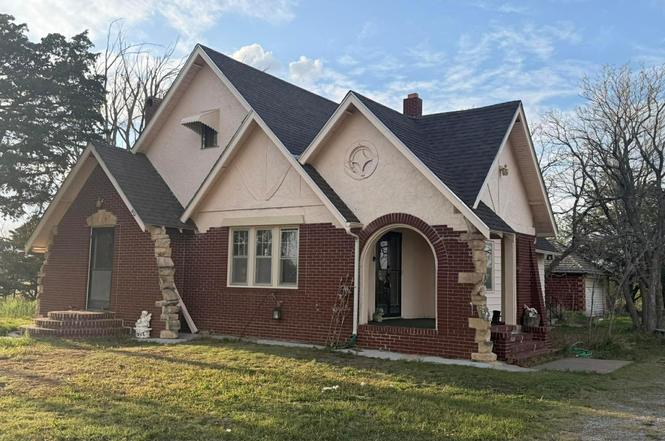
406 E Old Hwy 4 · Ransom, KS
Flood risk 1/10 · Minimal
- FEMA flood zone
- —
- Chance of flooding over 30 yrs
- 0.0%
- Est. flood insurance / yr
- —
Fire risk 5/10 · Moderate
- Est. fire insurance / yr
- $1,154 – $2,142
Heat risk 4/10 · Minor
- Hot days now (above 104°F)
- 7 days/yr
- Hot days in 30 yrs
- 17 days/yr
Wind risk 2/10 · Minimal
- Chance of severe wind over 30 yrs
- —
Air-quality risk 2/10 · Minimal
- Unhealthy air days now
- 1 days/yr
- Unhealthy air days in 30 yrs
- 1 days/yr
Risk factors via First Street. Map © Google.
Why this score? — see what drove the D grade
The composite is a weighted blend of 9 inputs, each scored 0–100. Each bar is that input's sub-score; the figure is the points it added to the 100-point composite (weight × sub-score).
- Cash flow +10.8/30.0
- ARV discount +7.5/15.0
- Appreciation +6.1/10.0
- Livability +3.6/5.0
- 1% rule +3.2/10.0
- DSCR +3.1/10.0
- Rent growth +2.5/5.0
- Condition / age +2.5/5.0
- Schools +2.1/10.0
$135,000
🖨 Deal sheet 📄 Offer letter ✓ Due diligence
Key facts
- Covered porch
- Galley kitchen
- Spacious dining room
Tags
Property features AI
Exterior
- Utilities: Public water; Public sewer
- Home design: Single-story residential property
- Construction: Brick and stucco construction
- Exterior features: 1-acre lot (approximate) with 208 x 208 dimensions; Zoned NC.1 / R-1
Interior
- Bedrooms: 1 main-level bedroom
- Heating & cooling: Central air conditioning
- Interior features: Window coverings
Neighborhood map
What this means for you Summary
Snapshot
- This is a 4-bed/3.0-bath single-family listed at $135k.
Deal economics
- At list price, monthly cash flow is $-62 ($-748/yr) — negative.
- To cash-flow at today's rent, offer at most $126k (6.7% below list).
- To meet the 1% rule (rent ≥ 1% of price), the offer needs to be $110k (18.4% below list).
- Recommended offer: $110k (18.4% below list) — sets the bar for 1% rule.
Location & tenants
- Location reads 71/100 on livability (#141 in KS) — a middle-class / working-renter tenant base. Strengths: cost of living A+, housing A+, health & safety A+; Watch: crime F, amenities F, commute F.
- Western Plains (rural): math 11% / reading 30% proficiency, ranked #263 of 280 in KS (top 94%) — low school quality limits family demand, transient renter base, plan for 1-2y turnover.
- Market conditions: 1 active listings in the ZIP; 2 units permitted in Ness County in 2024 (0 in 5+ unit buildings).
Forward outlook
- In year one you build about $4k of equity ($933 loan paydown + $3k appreciation (2.2% local appreciation)).
- Ness County population projected to shrink 7% by 2050 — rents likely to lag national; underwrite the cash flow, not the appreciation.
- At projected returns (2.2% appreciation + 3.0% rent growth), your $38k cash investment doubles in ~9 years — after that, you're playing with house money.
- By year 9, paydown + projected appreciation supports a ~$34k cash-out refi (75% LTV) — recoverable capital for the next deal without selling this one.
Negotiation context
- It's been on market 198 days — a 12% lower offer ($119k) is reasonable based on typical stale-listing flexibility.
- 2 sale attempts; this cycle's ask is 8% above the opening price — seller raised mid-cycle; expect resistance to lowballs.
Risks & watch-outs
- Watch-outs: built in 1935 — expect roof / HVAC / electrical / plumbing capex.
- Climate carrying-cost: moderate wildfire risk — expect insurance premiums to compound above CPI over the hold.
Questions for the listing agent
- What do current leases actually rent for vs. the listed asking? Can we see a recent rent roll and the last 12 months of T-12 income?
- It's been on market 198 days. Have you received any prior offers? Is the seller open to a 18% concession, seller financing, or rate buy-down credit?
- Built in 1935 — when were the roof, HVAC, electrical panel, plumbing, and water heater last replaced?
- Why hasn't it sold? Are there any deal-killer items the seller is aware of (foundation, flood, title, zoning, code violations)?
- Is there a deadline driving the sale (1031 exchange, divorce, estate, relocation)? That informs how much negotiation room exists.
- Crime grade is F in this area — have there been break-ins, vandalism, or insurance claims at this property in the last 3 years? What carrier currently insures it and at what premium?
- The area grade is low — what's the realistic commute time and amenity access for the typical tenant pool here? Any planned neighborhood developments (good or bad) we should know about?
- What's the average days-on-market for RENTAL listings here right now (not sales)? A rising rental-DOM trend means longer vacancies and softer asking-rent achievability than the comps imply.
- What's the recent tenant-quality profile in this submarket — average credit score on applications, eviction rate, late-payment / NSF rate, and stable-employment percentage? A property-management company in the area should have these aggregated.
- How much new for-sale + rental construction is in the pipeline within 1–3 miles? Heavy new supply typically softens prices + rents 12–24 months out; constrained supply supports both.
Investment metrics
- 1% rule
- 0.82% ✗
- Cap rate
- 5.74%
- Cash-on-cash
- -1.98%
- DSCR
- 0.91
- GRM
- 10.2
CMA / ARV
No comps found within radius.
Projected returns pro-forma
2.25% appreciation · 3.0% rent growth · sell at horizon
- IRR
- 3.4%
- Equity multiple
- 1.19×
- Total profit
- $7,005
- Equity at exit
- $55,061
- IRR
- 7.1%
- Equity multiple
- 1.99×
- Total profit
- $37,352
- Equity at exit
- $80,705
Cash invested: $37,800 (down + closing). Projections, not guarantees.
Landlord ↔ Tenant lean methodology
- Overall (STATE)
- 83 Strongly Landlord-Friendly
- State Kansas
- 83 Strongly Landlord-Friendly · R+10
- County
- — inherits STATE
- City
- — inherits STATE
ZIP-level market 67572
- Home prices YoY
- 1.4%
- Active inventory
- 1
- Price-to-rent
- 10.2×
Monthly cashflow live
- Estimated rent
- $1,102 medium interval (Pro) →
- Mortgage (P&I)
- −$708
- Tax est. 1.5%
- −$169 /mo · $2,025/yr
- Insurance
- −$56
- HOA
- −$0
- Vacancy / Maint / Mgmt
- −$231
- Net cashflow
- $-62
Break-even live
UW: 25.0% down · 7.5% · 30yr · 1.5% tax · 5.0% vac · 8.0% maint · 8.0% mgmt
Financing live
Cash to close
- Down payment
- $33,750
- Closing costs
- $4,050
- Reserves months
- —
- Total cash needed
- —
Loan-product check · same deal, 3 products live
Conventional
25% down · 7.5% · 30yr
- Down + closing
- —
- Monthly P&I
- —
- Monthly cashflow
- —
- DSCR
- —
- Eligible?
- —
Personal DTI + credit; lowest rate.
DSCR
20% down · 8.5% · 30yr
- Down + closing
- —
- Monthly P&I
- —
- Monthly cashflow
- —
- DSCR
- —
- Eligible?
- —
No personal income docs; deal must DSCR.
Hard money
10% down · 12.0% · 12mo
- Down + closing
- —
- Monthly P&I
- —
- Monthly cashflow
- —
- DSCR
- —
- Eligible?
- —
Short-term bridge; refi at stabilization.
Listing history 19 events
-
2026-06-18days on market $135,000 Active 198 DOM
-
2026-06-17days on market $135,000 Active 197 DOM
-
2026-06-16days on market $135,000 Active 196 DOM
-
2026-06-15days on market $135,000 Active 195 DOM
-
2026-06-13days on market $135,000 Active 193 DOM
-
2026-06-12days on market $135,000 Active 192 DOM
-
2026-06-09days on market $135,000 Active 189 DOM
-
2026-06-08days on market $135,000 Active 188 DOM
-
2026-06-07days on market $135,000 Active 187 DOM
-
2026-06-05days on market $135,000 Active 185 DOM
-
2026-06-04days on market $135,000 Active 183 DOM
-
2026-06-02days on market $135,000 Active 182 DOM
-
2026-06-01days on market $135,000 Active 181 DOM
-
2026-05-31days on market $135,000 Active 180 DOM
-
2026-05-31days on market $135,000 Active 179 DOM
-
2026-04-15status Active
-
2026-04-15price $135,000
-
2025-11-26status Pending
-
2025-07-10$125,000 Active
ⓘ Source: listings_history table (triggers on properties + properties_extension) + one-shot
backfill from property_details.listing_events for pre-trigger history.
Climate risk First Street
- Flood 1/10 Low 0% chance over 30 yrs
- Wildfire 5/10 Major
- Heat 4/10 Moderate 7 d/yr ≥104°F today · 17 d/yr by 30 yrs out
- Wind 2/10 Low
- Air quality 2/10 Low 1 unhealthy d/yr today · 1 by 30 yrs out
Nearby sold comps map
Loading sold comps map…
Walkable amenities ~0.75 mi
Loading nearby amenities…
Taxation est. · year 1
- Rental income
- $13,224
- − Mortgage interest
- −$7,562
- − Property taxes
- −$2,025
- − Insurance
- −$675
- − Repairs & maintenance
- −$1,058
- − Management
- −$1,058
- − Depreciation
- −$3,927
- Taxable loss
- −$3,081
- Est. tax savings @ 24.0%
- +$739
- After-tax cash flow
- $-9/yr
For passive investors: Depreciation is non-cash, so a rental often shows a tax loss while cash-flowing — sheltering income. Rental losses are passive: they offset passive income freely, and up to $25,000/yr can offset ordinary (W-2) income if you actively participate and your MAGI is under $100k (phasing out to $0 by $150k); unused losses carry forward. On sale, claimed depreciation is recaptured at up to 25%, and gains may owe capital-gains tax (a 1031 exchange can defer both). Figures are a year-1 estimate at your 24.0% rate — not tax advice; consult a CPA.
Schools (NCES district)
- District
- Western Plains
- NCES district ID
- 2000020
- Math proficiency
- 11% ▬ 0.00%
- Reading proficiency
- 30% ▲ 19.00%
- Median HH income
- $44,167
- Composite
- 20.96/100
- National rank
- #13715
- State rank
- #263 of 280 in KS
Livability — Ransom
- Score
- 71/100
- State rank
- #141
- US rank
- #6937
Category grades
Schools grade is shown separately in the Schools card above.
Census & demographics
- Census place
- Ransom, KS
- Population (ZIP)
- 403
Population outlook (Ness County) Hauer SSP2
- Today (2025)
- 2,917 people
- By 2030
- 2,867 · -1.7%
- By 2040
- 2,757 · -5.5%
- By 2050
- 2,724 · -6.6%
- By 2075
- 2,875 · -1.4%
- By 2100
- 2,943 · +0.9%
Race, ethnicity, and origin ACS 2023
- Neighborhood character
- Predominantly White (95%)
- Race & ethnicity
- White 95% Two or more races 3%
- Common ancestry
- Italian 4% Hungarian 2% Norwegian 1%
- Foreign-born
- 1% · Canada
- Languages at home
- 98% English-only · Russian/Polish/Slavic 1% Tagalog/Filipino 0%
Political lean MEDSL · Ness
- 2024 margin
- Solid R (+79.0) · D 9.5% · R 88.4% · Other 2.1%
- 2008→2024 swing
- -18.8pp toward R · 2008: -60.2pp · 2024: -79.0pp
- All cycles
- 2024: R+79.0 2020: R+78.5 2016: R+73.6 2012: R+69.1 2008: R+60.2
Not yet ingested
- Civics
- —
Market trends
- HPI YoY
- ▲ 2.25%
- Current HPI
- 166.0448
- Rent YoY
- —
- Metro
- —
- State GDP YoY
- —
- F500 in state
- 0
Price history
+8.0% since first listed4 events — show timeline
- 2026-04-15 Relisted — Hays MLS
- 2026-04-15 Price Changed $135,000 Hays MLS
- 2025-11-26 Pending — Hays MLS
- 2025-07-10 Listed $125,000 Hays MLS
Cash-flow waterfall
monthlySold comps — $/sqft
last 12 mo · ≤1 miLoading sold comps…