 Multi-family
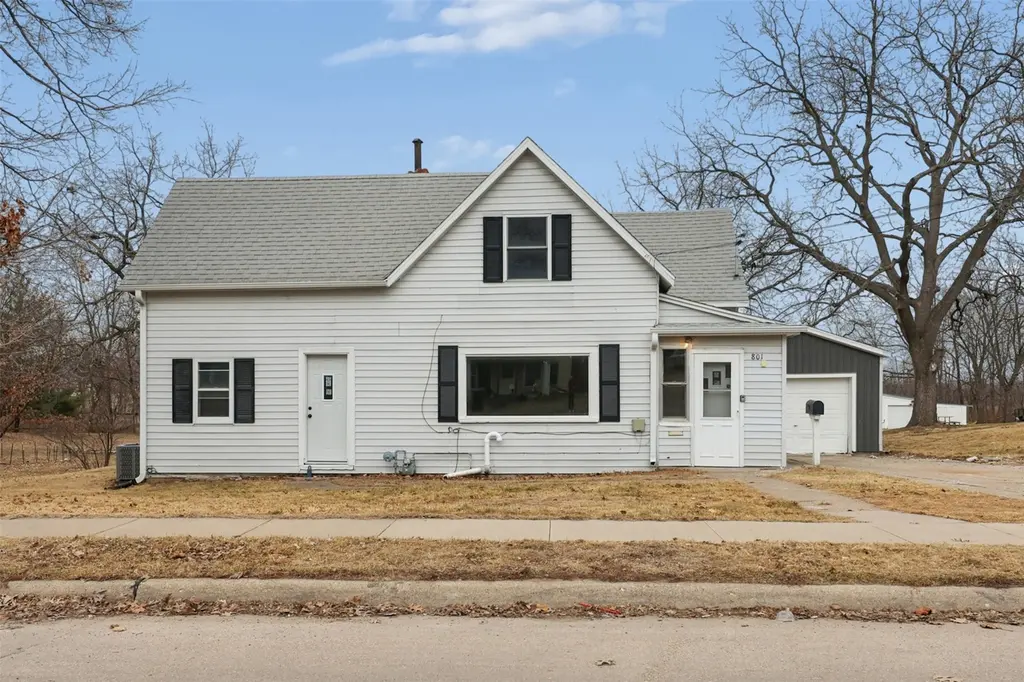
801 E Marion St · Knoxville, IA
Flood risk 1/10 · Minimal
- FEMA flood zone
- X (unshaded)
- Chance of flooding over 30 yrs
- 0.0%
- Est. flood insurance / yr
- $473 – $860
Fire risk 3/10 · Minor
- Est. fire insurance / yr
- $902 – $1,676
Heat risk 3/10 · Minor
- Hot days now (above 104°F)
- 7 days/yr
- Hot days in 30 yrs
- 16 days/yr
Wind risk 2/10 · Minimal
- Chance of severe wind over 30 yrs
- —
Air-quality risk 2/10 · Minimal
- Unhealthy air days now
- 0 days/yr
- Unhealthy air days in 30 yrs
- 1 days/yr
Risk factors via First Street. Map © Google.
Why this score? — see what drove the B- grade
The composite is a weighted blend of 9 inputs, each scored 0–100. Each bar is that input's sub-score; the figure is the points it added to the 100-point composite (weight × sub-score).
- Cash flow +30.0/30.0
- DSCR +10.0/10.0
- 1% rule +8.4/10.0
- ARV discount +7.5/15.0
- Schools +5.3/10.0
- Livability +3.5/5.0
- Rent growth +2.5/5.0
- Condition / age +2.5/5.0
- Appreciation +0.0/10.0
$159,900
🖨 Deal sheet 📄 Offer letter ✓ Due diligence
Multi-family units
County records classify this as Multi-Family (2-4 Unit). Listing-text estimate: 1 unit. estimate disagrees with records
Listing remarks
Welcome to this updated 3-bedroom, 1.5-bath property offering both charm and modern comfort! Enjoy peace of mind with new flooring throughout the home along with fresh paint in every room, creating a bright and inviting atmosphere. Step inside to discover a spacious living area perfect for relaxing or entertaining. Just off 2nd front entrance closest to garage, a versatile front room provides the ideal space for a mudroom/drop zone, home office, or flex area to fit your lifestyle. The kitchen features stainless steel appliances with new slide in range, a center island, blue cabinetry, and a fresh, contemporary feel. The main floor includes a convenient bedroom connected to the updated full
Key facts
- Fresh paint
- Spacious living area
- New flooring
Tags
Property features AI
Finance
- Other: Lot dimensions approximately 99 x 319.5 (about 0.73 acres); Concrete road access
Exterior
- Parking: Detached one-car garage
- Security: Smoke detector(s)
- Utilities: Public water; Public sewer
- Home design: R-3 zoning
- Construction: Vinyl siding; Asphalt/rolled/shingle roof; Unfinished basement
- Exterior features: Covered patio; Patio; Fire pit; Outdoor storage
Interior
- Kitchen: Dishwasher; Stove; Refrigerator
- Bedrooms: 1 main-level bedroom
- Flooring: Carpet; Tile
- Bathrooms: 1 full bathroom; 1 half bathroom
- Heating & cooling: Forced air heating (natural gas); Central air conditioning
- Interior features: Dining area; Window treatments
- Laundry & utility: Washer; Dryer (upper level laundry)
Neighborhood map
What this means for you Summary
Snapshot
- This is a 3-bed/2.0-bath multifamily listed at $160k.
Deal economics
- At list price, monthly cash flow is $670 ($8k/yr) — positive.
- The deal already cash-flows at list — no discount required.
- Meets the 1% rule at list price ($2k rent vs $160k).
- Recommended offer: $155k (3.0% below list) — sets the bar for market timing.
- Cap rate 11.3% vs local median 2.4% in Knoxville — top-decile yield for the area; either an underpriced asset or a hidden risk that comps aren't pricing in. Stress-test before assuming the spread holds.
Location & tenants
- Location reads 69/100 on livability (#406 in IA) — a middle-class / working-renter tenant base. Strengths: cost of living A+, housing A+, health & safety A+; Watch: amenities F, commute F.
- Knoxville Community School District (town): math 62% / reading 63% proficiency, ranked #220 of 289 in IA (top 76%) — acceptable for families but not a draw, mixed tenant base, ~2y average lease.
- Market conditions: 100 active listings in the ZIP; 122 units permitted in Marion County in 2024 (0 in 5+ unit buildings).
- This rent runs 34% of the median local income ($75k/yr) — at the standard rent-burdened threshold; future hikes will face affordability resistance.
Forward outlook
- Local home prices are declining (-3.0%/yr); year-one equity from $1k of loan paydown is wiped out by about $5k of value loss. Plan a longer hold.
- Marion County population projected to shrink 7% by 2050 — rents likely to lag national; underwrite the cash flow, not the appreciation.
- At projected returns (-3.0% appreciation + 3.0% rent growth), your $45k cash investment doubles in ~7 years — after that, you're playing with house money.
Negotiation context
- It's been on market 60 days — a 3% lower offer ($155k) is reasonable based on typical stale-listing flexibility.
- 2 sale attempts; this cycle's ask has dropped $15k (9%) from the opening price — seller is motivated, your offer sets the floor, not the list.
- Current owner paid $60k; list at $160k implies a 166% gain — meaningful room to come down on a strong offer.
Risks & watch-outs
- Watch-outs: built in 1920 — expect roof / HVAC / electrical / plumbing capex.
Questions for the listing agent
- It's been on market 60 days. Have you received any prior offers? Is the seller open to a 3% concession, seller financing, or rate buy-down credit?
- Built in 1920 — when were the roof, HVAC, electrical panel, plumbing, and water heater last replaced?
- Is there a deadline driving the sale (1031 exchange, divorce, estate, relocation)? That informs how much negotiation room exists.
- Schools are B-rated — typically a magnet for longer-tenancy family renters. What's the average tenant stay here, and is there a school-zone premium baked into asking?
- What's the average days-on-market for RENTAL listings here right now (not sales)? A rising rental-DOM trend means longer vacancies and softer asking-rent achievability than the comps imply.
- What's the recent tenant-quality profile in this submarket — average credit score on applications, eviction rate, late-payment / NSF rate, and stable-employment percentage? A property-management company in the area should have these aggregated.
- How much new apartment / multifamily construction is in the pipeline within 1–3 miles? Heavy new supply (>2% of stock underway) typically softens rents 12–24 months out; light construction supports rent growth.
Investment metrics
- 1% rule
- 1.34% ✓
- Cap rate
- 11.32%
- Cash-on-cash
- 17.97%
- DSCR
- 1.80
- GRM
- 6.2
CMA / ARV
No comps found within radius.
Projected returns pro-forma
-3.0% appreciation · 3.0% rent growth · sell at horizon
- IRR
- 9.5%
- Equity multiple
- 1.37×
- Total profit
- $16,772
- Equity at exit
- $23,842
- IRR
- 18.7%
- Equity multiple
- 2.55×
- Total profit
- $69,516
- Equity at exit
- $13,825
Cash invested: $44,772 (down + closing). Projections, not guarantees.
Landlord ↔ Tenant lean methodology
- Overall (STATE)
- 83 Strongly Landlord-Friendly
- State Iowa
- 83 Strongly Landlord-Friendly · R+6
- County
- — inherits STATE
- City
- — inherits STATE
ZIP-level market 50138
- Home prices YoY
- -25.3%
- Active inventory
- 100
- Price-to-rent
- 12.4×
Monthly cashflow live
- Estimated rent
- $2,144 medium interval (Pro) →
- Mortgage (P&I)
- −$839
- Tax from tax record
- −$118 /mo · $1,418/yr
- Insurance
- −$67
- HOA
- −$0
- Vacancy / Maint / Mgmt
- −$450
- Net cashflow
- $670
Break-even live
2-unit breakdown (identical units grouped — click to expand)
| Units | Beds | Baths | Est. rent |
|---|---|---|---|
| 2× units | 3 | 1.5 | $2,144 |
| #1 | 3 | 1.5 | $1,072 |
| #2 | 3 | 1.5 | $1,072 |
| Total (2 units) | $2,144 | ||
UW: 25.0% down · 7.5% · 30yr · 1.5% tax · 5.0% vac · 8.0% maint · 8.0% mgmt
Financing live
Cash to close
- Down payment
- $39,975
- Closing costs
- $4,797
- Reserves months
- —
- Total cash needed
- —
Loan-product check · same deal, 3 products live
Conventional
25% down · 7.5% · 30yr
- Down + closing
- —
- Monthly P&I
- —
- Monthly cashflow
- —
- DSCR
- —
- Eligible?
- —
Personal DTI + credit; lowest rate.
DSCR
20% down · 8.5% · 30yr
- Down + closing
- —
- Monthly P&I
- —
- Monthly cashflow
- —
- DSCR
- —
- Eligible?
- —
No personal income docs; deal must DSCR.
Hard money
10% down · 12.0% · 12mo
- Down + closing
- —
- Monthly P&I
- —
- Monthly cashflow
- —
- DSCR
- —
- Eligible?
- —
Short-term bridge; refi at stabilization.
Listing history 9 events
-
2026-06-05status $159,900 Pending 60 DOM
-
2026-06-03days on market $159,900 Active 60 DOM
-
2026-06-02days on market $159,900 Active 59 DOM
-
2026-06-01days on market $159,900 Active 58 DOM
-
2026-05-31days on market $159,900 Active 57 DOM
-
2026-05-30days on market $159,900 Active 56 DOM
-
2026-05-22status Active
-
2026-02-17$174,900 Active
-
2025-11-04soldstatus $60,000
ⓘ Source: listings_history table (triggers on properties + properties_extension) + one-shot
backfill from property_details.listing_events for pre-trigger history.
Tax reassessment forecast IA · Partial reset (capped growth)
- Current annual tax
- $1,418 · $118/mo
- Projected year-2 tax
- $1,964 · $164/mo
- Expected delta
- +$546/yr (+$46/mo · 38.5%)
ⓘ Screening estimate from a state-policy table — verify with the county assessor before closing.
Climate risk First Street
- Flood 1/10 Low FEMA zone X (unshaded) · 0% chance over 30 yrs
- Wildfire 3/10 Moderate
- Heat 3/10 Moderate 7 d/yr ≥104°F today · 16 d/yr by 30 yrs out
- Wind 2/10 Low
- Air quality 2/10 Low 0 unhealthy d/yr today · 1 by 30 yrs out
Nearby sold comps map
Loading sold comps map…
Walkable amenities ~0.75 mi
Loading nearby amenities…
Taxation est. · year 1
- Rental income
- $25,728
- − Mortgage interest
- −$8,957
- − Property taxes
- −$1,418
- − Insurance
- −$800
- − Repairs & maintenance
- −$2,058
- − Management
- −$2,058
- − Depreciation
- −$4,652
- Taxable income
- $5,785
- Est. tax owed @ 24.0%
- −$1,389
- After-tax cash flow
- $6,657/yr
For passive investors: Depreciation is non-cash, so a rental often shows a tax loss while cash-flowing — sheltering income. Rental losses are passive: they offset passive income freely, and up to $25,000/yr can offset ordinary (W-2) income if you actively participate and your MAGI is under $100k (phasing out to $0 by $150k); unused losses carry forward. On sale, claimed depreciation is recaptured at up to 25%, and gains may owe capital-gains tax (a 1031 exchange can defer both). Figures are a year-1 estimate at your 24.0% rate — not tax advice; consult a CPA.
Schools (NCES district)
- District
- Knoxville Community School District
- NCES district ID
- 1915840
- Math proficiency
- 62% ▼ -6.00%
- Reading proficiency
- 63% ▬ 0.00%
- Median HH income
- $49,594
- Composite
- 53.11/100
- National rank
- #1512
- State rank
- #220 of 289 in IA
Livability — Knoxville
- Score
- 69/100
- State rank
- #406
- US rank
- #8643
Category grades
Schools grade is shown separately in the Schools card above.
Census & demographics
- Census place
- Knoxville, IA
- County
- Marion County · 25,533 people
- City population
- 11,117
- Metro
- Pella, IA
- Population (ZIP)
- 11,117
- Household income
- $74,693
- Rent vs Own
- Severe rent burden
- 122.0
Population outlook (Marion County) Hauer SSP2
- Today (2025)
- 32,883 people
- By 2030
- 32,685 · -0.6%
- By 2040
- 31,892 · -3.0%
- By 2050
- 30,691 · -6.7%
- By 2075
- 27,610 · -16.0%
- By 2100
- 23,851 · -27.5%
Race, ethnicity, and origin ACS 2023
- Neighborhood character
- Predominantly White (94%)
- Race & ethnicity
- White 94% Two or more races 3% Hispanic / Latino 2%
- Common ancestry
- Iranian 12% Portuguese 4% Italian 4%
- Foreign-born
- 1% · Philippines, Canada
- Languages at home
- 99% English-only · Spanish 1%
Political lean MEDSL · Marion
- 2024 margin
- Solid R (+37.8) · D 30.4% · R 68.2% · Other 1.4%
- 2008→2024 swing
- -27.0pp toward R · 2008: -10.8pp · 2024: -37.8pp
- All cycles
- 2024: R+37.8 2020: R+33.7 2016: R+31.2 2012: R+13.3 2008: R+10.8
Not yet ingested
- Civics
- —
Market trends
- HPI YoY
- ▼ -80.37%
- Current HPI
- 237.7055
- Rent YoY
- —
- Metro
- Pella, IA
- State GDP YoY
- ▲ 2.48%
- F500 in state
- 4
Industry mix (Fortune 500 HQ in IA)
| Industry | F500 HQs | Revenue |
|---|---|---|
| Financial Services | 1 | $16B |
|
||
| Retail / Convenience | 1 | $15B |
|
||
Price history
+191.5% since first listed3 events — show timeline
- 2026-05-22 Relisted — DMMLS
- 2026-02-17 Listed $174,900 DMMLS
- 2025-11-04 Sold (Public Records) $60,000 Public Records
Property tax history
+3.4%/yrLatest (2025): $1,418 · -5.8% YoY. Source: county tax records.
Cash-flow waterfall
monthlySold comps — $/sqft
last 12 mo · ≤1 miLoading sold comps…